Key Points:
1- NVDA was among one of the first stocks to break out of a multi-month base back in January. Many other stocks and ETFs have been forming similar bottoming patterns this year. We look at a few of them below.
2- The SPX, itself, remains in striking distance of a fresh breakout. The first attempt hasn’t gotten follow through yet with the last days pulling the index back below the 4,175 mark.
3- The SPX now has closed below its mid-point four days in a row. The only time when the SPX had difficulty closing well beyond a few days was during that challenging three-week period in February through March.
Topics Covered:
-Stocks with big bases
-SPX pattern update
-Not Closing Well
-Hong Kong
-UK
Patterns
With NVDA dominating the headlines after its monstrous earning’s reaction, it’s important to remember how it even got to this point. NVDA was among one of the first stocks to break out of a multi-month base back in January.
Here’s how the stock’s chart looked back then.
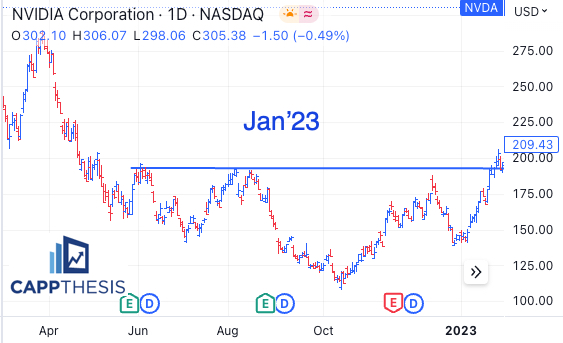
If it looks familiar, it should. Many other stocks and ETFs have been forming similar bottoming patterns this year. Some have extended already, while some are just knocking on the door of key resistance now.
For instance, MU just broke out of a very similar pattern last week, held near its breakout point on negative headlines this week and now is up in sympathy to NVDA today – like many others.
Indeed, MU had a chance to blast through its own resistance line in January and various times since then, but it didn’t until recently.
But if the market indeed has entered the stage when big bases like this will be resolving higher, then MU’s chart shouldn’t be ignored.
Here are both stocks:
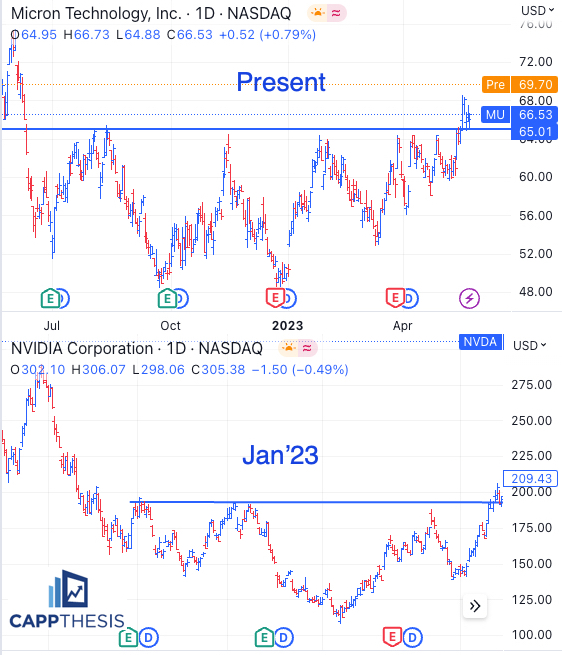
Again, nothing truly compares to NVDA right now, but instead of trying to play a massive gap in a stock that already was up +100% YTD, it’s more worth our time to look for stocks that are in earlier breakout stages like MU.
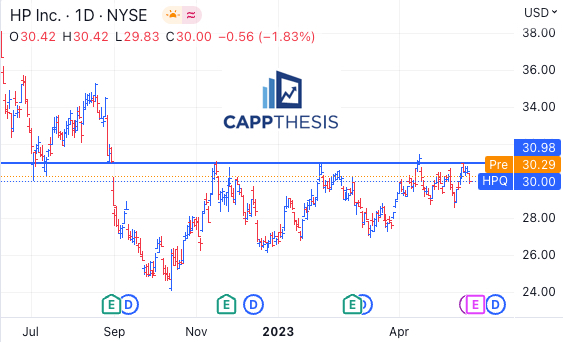
HPQ is another one that we discussed recently. Again, we’re not comparing “companies,” – just chart patterns.
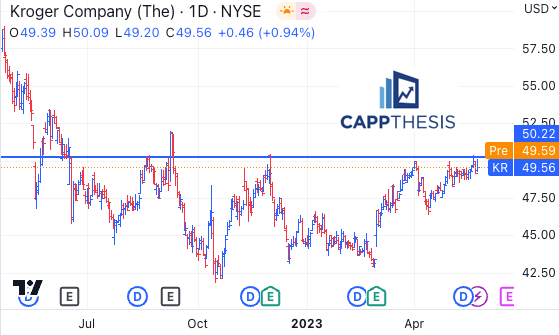
Here’s one more, a Consumer Staples name, KR.
SPX
The SPX, itself, remains in striking distance of a fresh breakout. The first attempt hasn’t gotten follow through yet with the last days pulling the index back below the 4,175 mark.
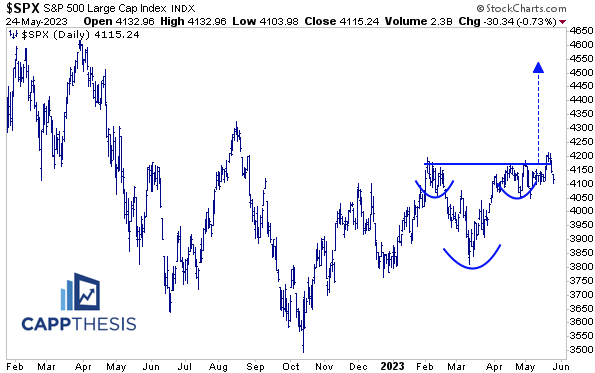
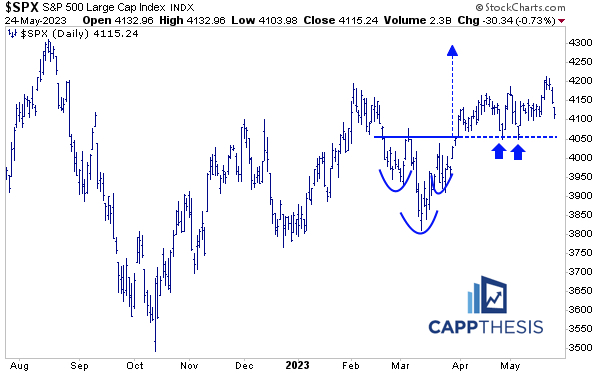
The breakout from 3/31 remains in play.
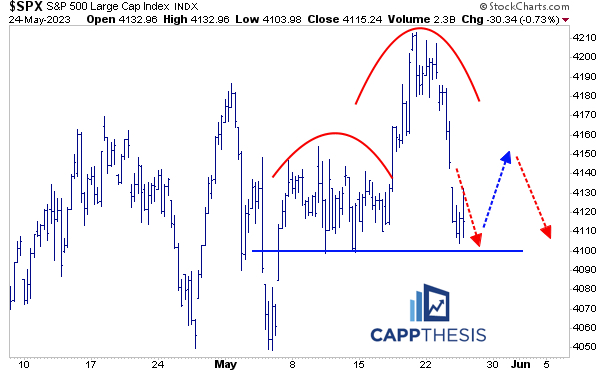
Since we’re seeing all sides, any bounce that makes a lower high could create the next topping pattern – perhaps one that looks like this.
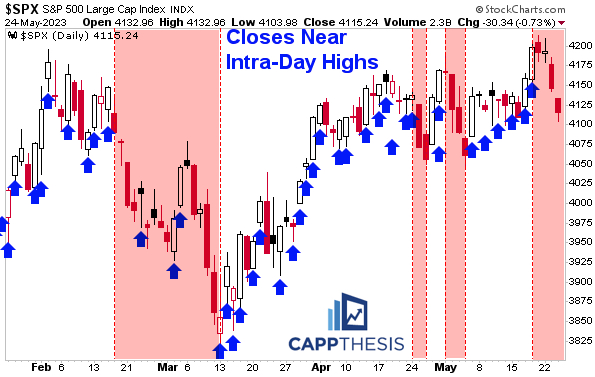
Not Closing Well
A few days ago, we discussed the SPX’s continued ability of closing near its highs most of the time in 2023. Over the last few days, that has not happened. The SPX now has closed below its mid-point four days in a row.
We’ve seen short-term phases like this over the last few weeks: April’s last week and May’s first week, but those ended up being short-lived.
Again, the only time when the SPX had difficulty closing well beyond a few days was during that challenging three-week period in February through March. Over 16 trading days, it finished near its daily high point just three times. Not surprisingly, the index endured its worst run of the year then.
Needless to say, seeing the index start to close well again will be a necessary component to keeping this comeback story alive.
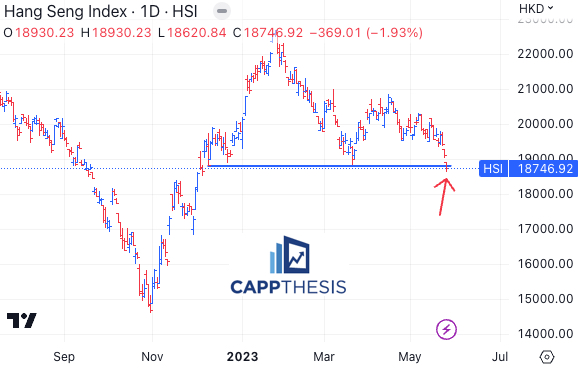
Hong Kong
The Hang Seng Index topped in February, made a lower high in April and during its Thursday session, “quietly” broke below clear support. It should remain on our radar screens.
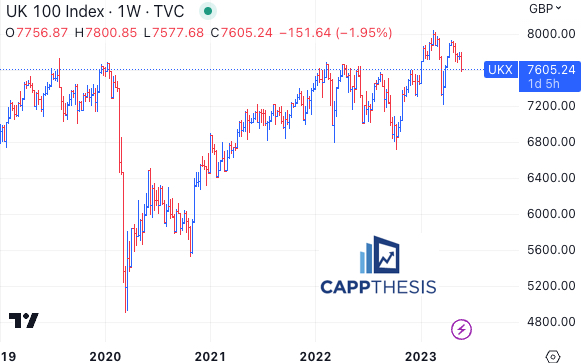
UK – FTSE 100
Another one to keep an eye on is the FTSE 100. It’s down marginally today, but it has been struggling over the last few weeks. And now it’s back to testing very important levels – the breakout zone from early 2023. That area also marked the highs in 2022 and pre-COVID.