Key Points:
1- If rotation is going to continue, then the next real bid should appear in the lagging areas – namely large cap growth.
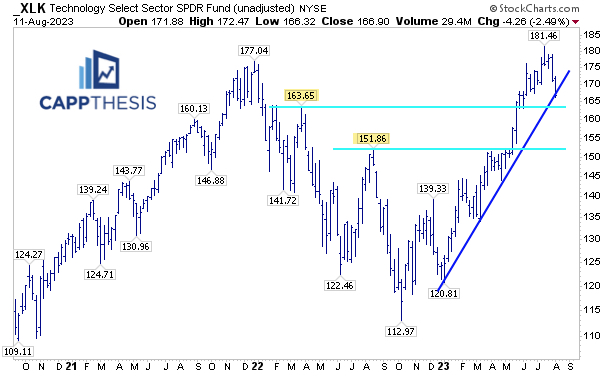
2- For the XLK Technology ETF, the 162-164 zone is the next level to monitor. Four different support lines appear there.
3– Seeing support hold is important, but it goes beyond the obvious reasons: it’s step one in potentially building another bullish pattern and maintaining an uptrend. See the seven steps below.
Topics Covered:
-Sector Perf August
-Pattern Perf YTD
-XLK Technology – multiple charts
Sector Performance
With just about half the month of August behind us, the SPX starts the week coming off two straight weekly losses. As discussed in yesterday’s PostScript report, it’s just the third losing streak of 2023. In February, the downturn lasted three straight weeks – the worst period of the year by far.
In May, it was just a short-term respite with dip-buying reappearing soon thereafter. We’ll recall that in May, said buying was focused on large cap growth. For the month, the SPX was +0.25%, but 75% of its components finished in the red.
The major theme was the egregious outperformance by large cap growth. The XLK Technology ETF was +8.9% in the year’s fifth month.
While Tech hasn’t been alone among the leaders since May concluded, it’s been the distinct laggard in August. This simple performance chart captures this quite emphatically. XLK’s current 6.4% loss is nearly more than double the second worst monthly performing sector ETF (XLU: -3.7%).
As we know, capital has flowed to Energy and Healthcare instead (two areas we discussed yesterday). They are the only sectors currently up for the month.
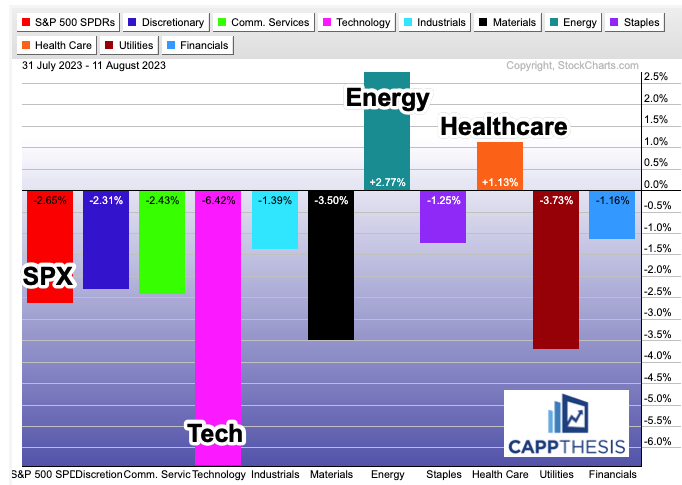
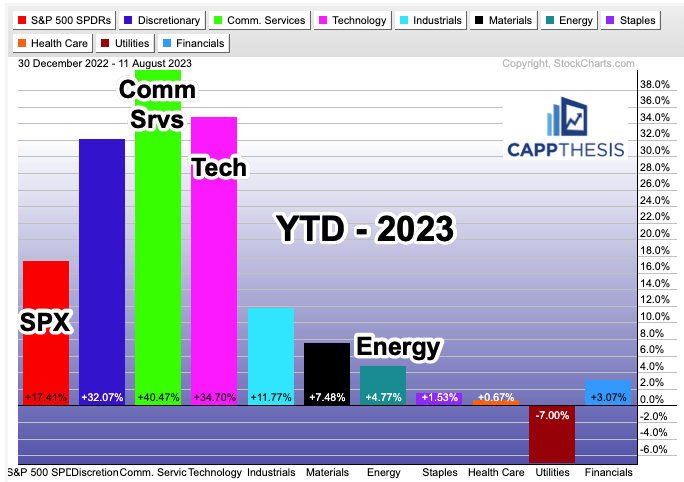
Thus, August has been the antithesis of 2023 YTD. We hear it all the time, but rotation is a key to any long-term uptrend, and we’ve seen this play out since the start of the second quarter.
XLK Technology
And, naturally, if said rotation is going to continue, then the next real bid should appear in the lagging areas – namely large cap growth. If/when that happens is the question…
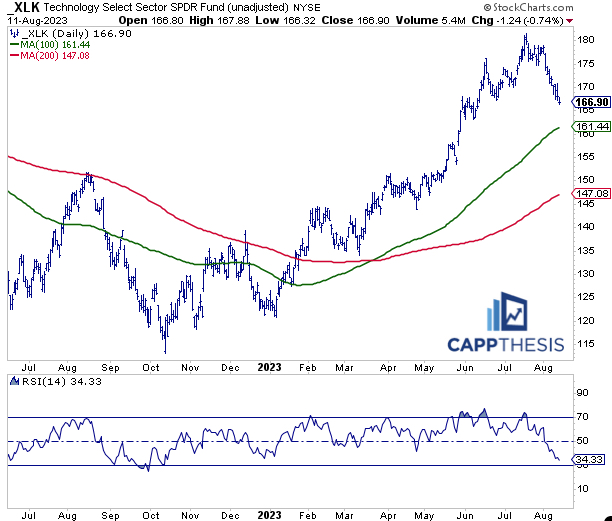
With the preceding run-up being undeterred, there have been few short-term support levels left in its wake. Here’s a zoomed in version of the XLK chart from the PostScript piece.
The high from March’22 near 164 is the next clear level to monitor. Again, long-term support levels typically don’t work as well as the short-term versions, thus, it’s up to buyers to decide for themselves if it’s truly important.
Below that, the August’22 high is near 152, which actually is right where its May breakout zone happened.
It would be helpful if other technical factors lined up around these levels, as well… which they do:
The 38.2% Fibo retracement level of the entire March – July run is at 163.
The 61.8% mark is around 152.
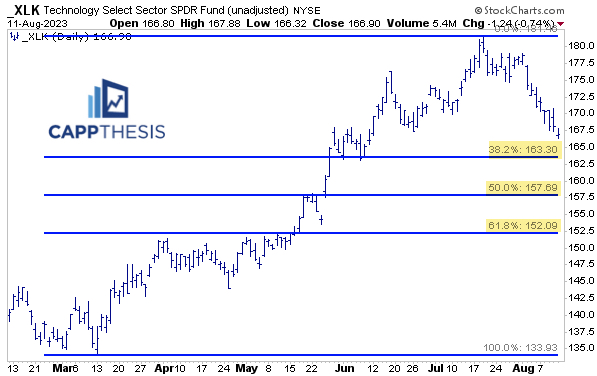
XLK’s 100-Day Moving Average is near 161, as well… with the 200-Day MA around 147. Both clearly are still moving higher every day, so they’ll eventually catch up to just mentioned the support and fibo levels…
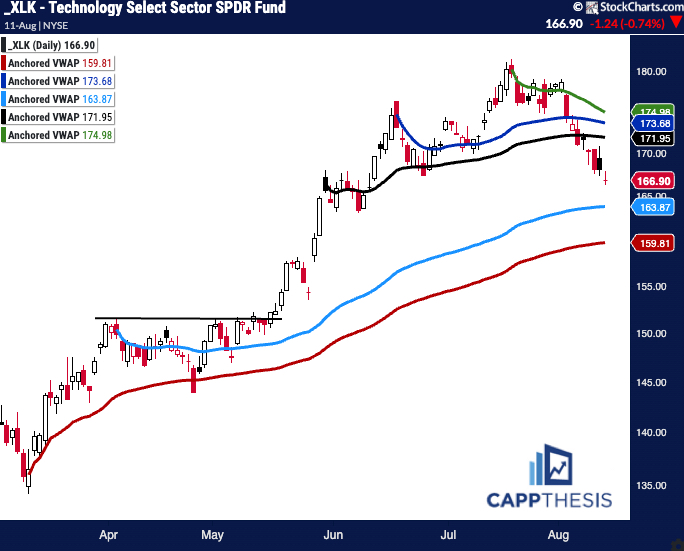
XLK – Anchored VWAP
Here are a few key AVWAP lines to monitor in XLK, as well. The lines that are tied to the May, June and July highs all are overhead. They will be important resistance levels to eventually recapture on the next real rebound effort.
Support-wise, yet another line is near 163 – the VWAP from the April highs. Again, that’s where XLK broke out from in May, which kickstarted the strong eight weeks that followed.
Step One
It goes without saying that seeing support hold is important, but it goes beyond the obvious reasons. Most significantly, it’s step one in building another bullish pattern and maintaining an uptrend:
1-Hold (or establish) support
2-Log an upside follow through
3-Form a higher low
4-Complete a bullish pattern
5-Break out
6-Hit upside target
7-Repeat
We’ll get back to the SPX tomorrow…


