Key Points:
We expand on each of these below:
Bearish
1- Sentiment remains stretched
2- Breadth: fewer Stocks > 50 and 200-Day MAs now vs. Feb
3- SPX testing tight upward sloping channel again
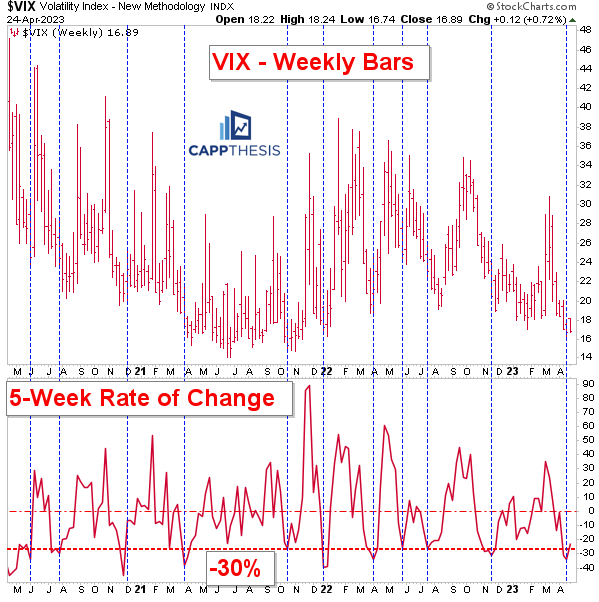
4- VIX is depressed over last five weeks
Bullish
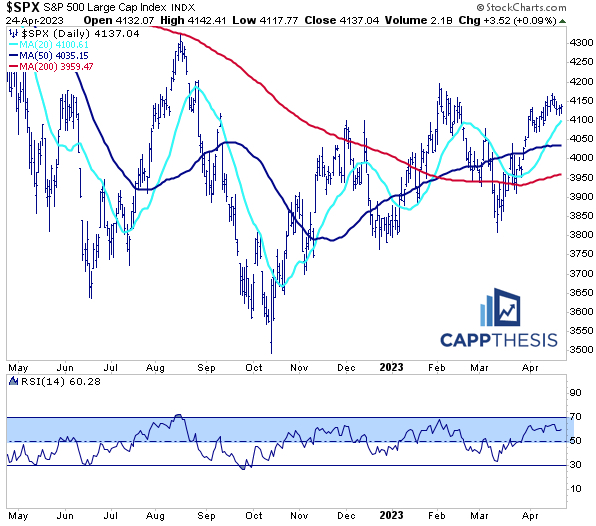
1- The SPX’s 14-Day RSI has stayed between 50 and 70
2- SPX > upward sloping moving averages
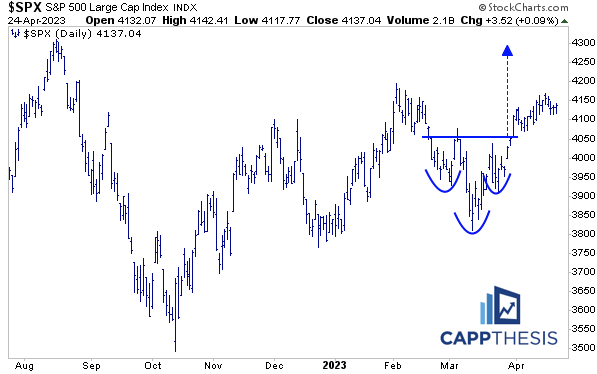
3- More successful bullish than bearish patterns in 2023
4- High amount of strong closes
5- +/-1% moves have completely disappeared
SPX:
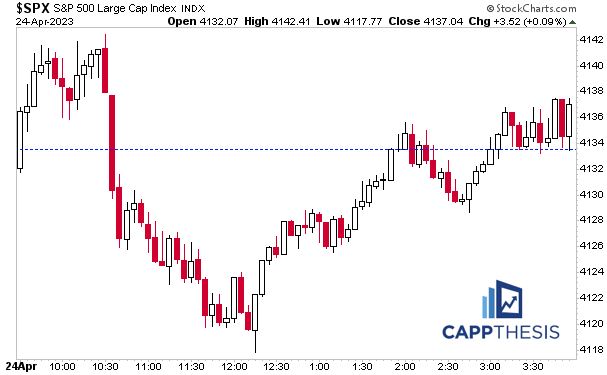
With another tiny move yesterday, the SPX’s daily and weekly charts didn’t budge. We can call it a tug of war, but that would imply that both sides are desperately trying to pull the market in their preferred direction. For that to be true, we’d be seeing big intra-day swings.
We’re not.
There have been sell-off attempts, but they’ve been snuffed out early nearly every day in April. There have been spurts of buying, too, but they’ve mainly been in response to those weak selling squalls.
Follow through on both sides has been lacking, creating the veritable stalemate that we’re now seeing.
So, which side has the edge heading into the glut of earnings?
Let’s review a few metrics to get an idea:
Bearish
1- Sentiment remains stretched
2- Breadth: fewer Stocks > 50 and 200-Day MAs now vs. Feb
3- SPX testing tight upward sloping channel again
4- VIX is depressed over last five weeks
Bullish
1- The SPX’s 14-Day RSI has stayed between 50 and 70
2- SPX > upward sloping moving averages
3- More successful bullish than bearish patterns in 2023
4- High amount of strong closes
5- +/-1% moves have completely disappeared
Bearish
1- Sentiment remains stretched
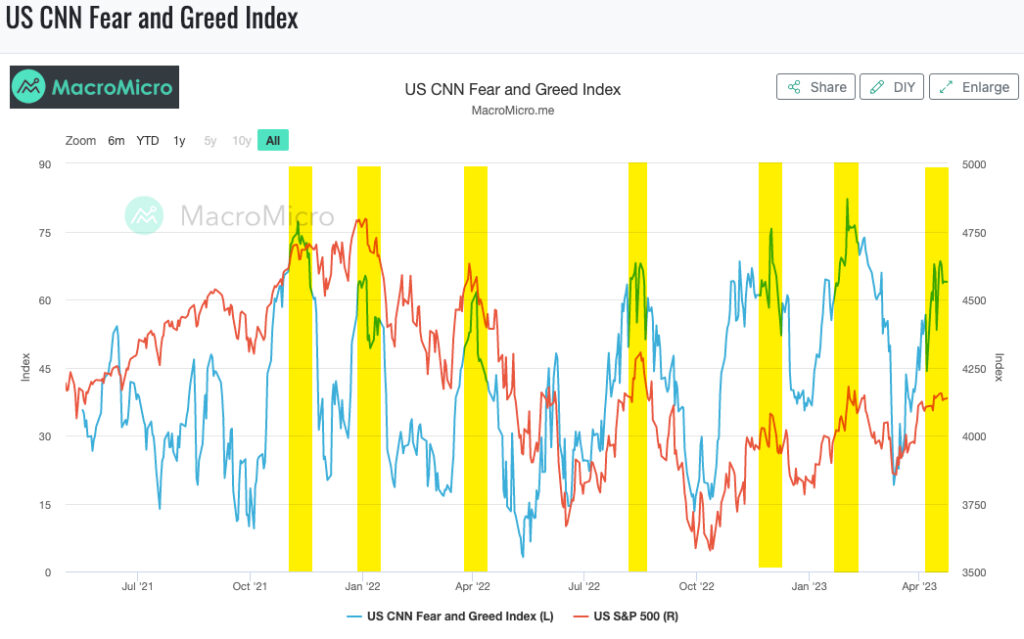
The CNN Fear & Greed Index has been the most useful timing tool since the index spiked to Extreme Greed in November’21. We show it often for a reason.
With the index closer to the upper edge of the scale, sentiment remains elevated. This condition never lasts for too long. Thus, simply repeating what’s happened before would suggest a bigger downturn is coming.
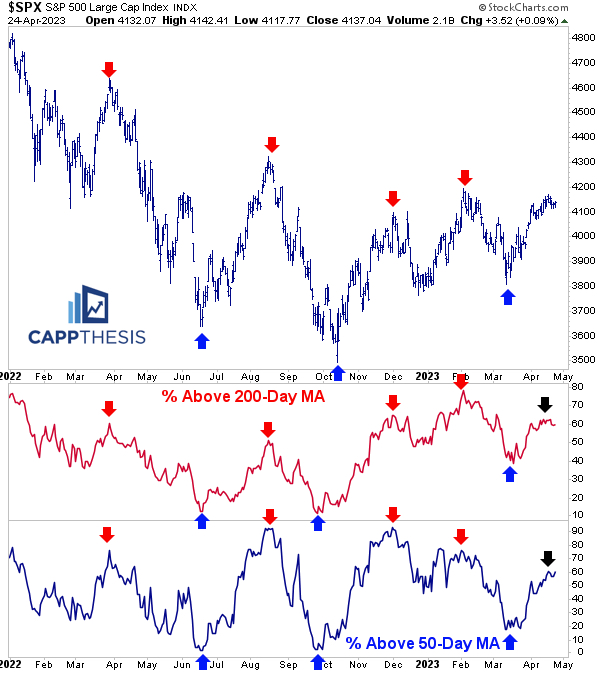
2- Breadth: fewer Stocks > 50 and 200-Day MAs now vs. Feb
While the SPX has approached the February highs, fewer components are now above their 50 and 200-Day MAs than in February. This is a divergence worth paying attention to.
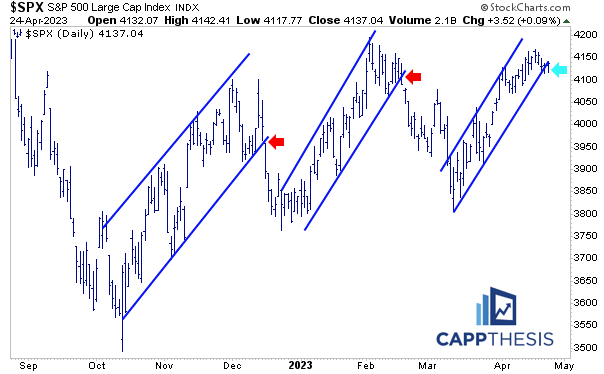
3- SPX testing tight upward sloping channel again
The downside implications are clear if another substantial downside break materializes.
4- VIX is depressed over last five weeks
We talked about this last week. The last 10 times the VIX declined at least 30% over a five-week period, a bounce in Vol followed relatively soon.
Bullish
1-The SPX’s 14-Day RSI has stayed between 50 and 70
This is bullish as long as it stays this way. It hasn’t remained in this zone for longer than a few weeks at a time – even during this comeback.
2- SPX > upward sloping moving averages
This has happened in recent weeks for the first time since the start of 2022. The SPX never stays above its 20-Day MA for long periods of time, but it CAN stay above its longer-term trend indicators for an extended duration during long uptrends.
3- More successful bullish than bearish patterns in 2023
So far this year, we’ve seen TWO successful bullish patterns and ONE successful bearish pattern. Number three remains in the works.
4- High amount of strong closes
We reviewed this yesterday, and on Monday, the SPX closed near its highs again.
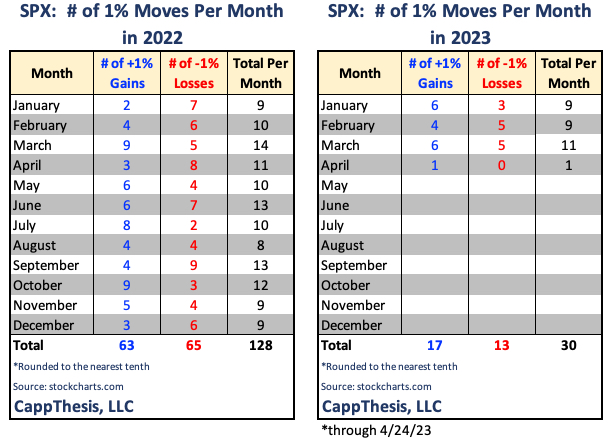
5- +/-1% moves have completely disappeared
This has been the most striking change so far in April.
We’ve talked about this phenomenon since launching CappThesis in September of last year (and for years before that). If there is a high amount of large daily moves (up and down), there will be outsized risk for both sides of the market.
Indeed, the market made a low in mid-October’22, but the acute swings continued. The two near-10% selloffs in 2023 showcased exactly that.
Now, with just a single 1% move in April, the environment has completely changed. Yes, this can all change again any day, but it’s a notable difference that can’t be ignored.
We looked at 2017 and 2019 yesterday – the underlying characteristic that drove both uptrends (especially in Q4) was the absence of big moves. That prevented bearish patterns from forming and dictated dip buying until emotion returned.
The blueprint is there for the taking…
Indeed, if this has been just a temporary pause in the otherwise volatile action, then, the aforementioned stretched sentiment will need to be entirely corrected again.
Let the tug of war continue.