Key Points:
1- In 2022, there were 19 weekly absolute moves of at least +/-3% (9 up, 10 down). In 2023, there have been two (one up, one down – both in March).
2- Last week, over 80% of the S&P 500’s stocks advanced, and 82 of them were up at least 5%. However, none of the biggest gainers were among the 20 largest holdings.
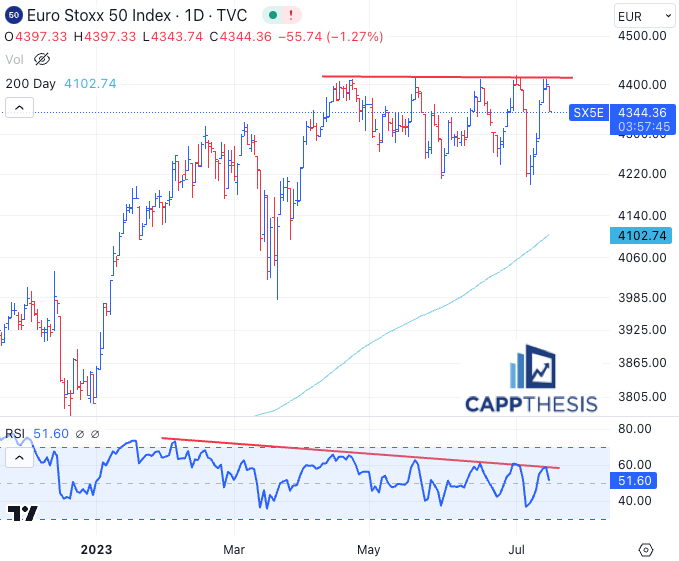
3- The Euro Stoxx 50 index is down over 1% today and still having trouble breaking out to new highs. Its own 14-Day RSI has been making lower highs for months now.
Topics Covered:
-SPX Weekly Moves
-S&P 500 Leaders
-Pattern Update
-Market Strength Indicator
-RSI
-Euro Stoxx 50
SPX:
The SPX comes into the first full week of earnings fresh off its third 2% weekly gain in the last five weeks. As detailed in yesterday’s PostScript report, while this has been a strong run, the individual weekly advances haven’t come close to the huge weekly spikes we saw in 2022.
Here’s that chart again.
In 2022, there were 19 weekly absolute moves of at least +/-3% (9 up, 10 down). In 2023, there have been two (one up, one down – both in March).
It’s not a coincidence that 2022 resulted in a downtrend and 2023, an uptrend – through the middle of July.
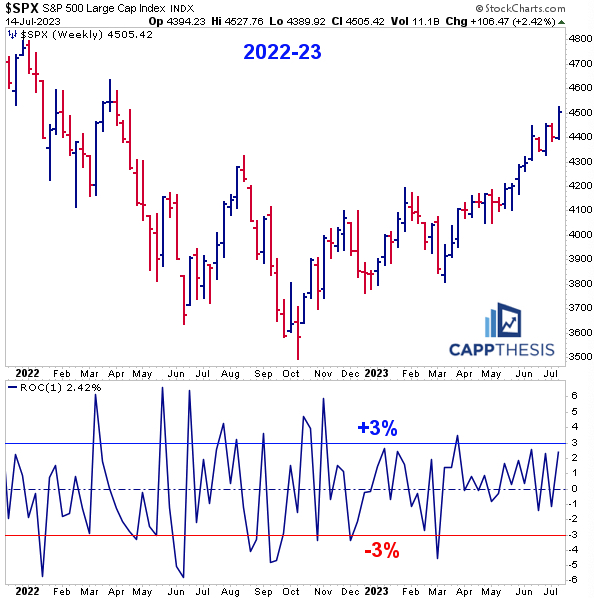
We already know that relatively small moves have been a major theme from a daily point of view in 2023 (and especially since April), and it’s been clear from this longer-term perspective, too.
That’s all fine and good, but how much longer can a tranquil environment like this persist? It’s a market of stocks, after all, and the underlying components’ aggregate movement will continue to dictate the action.
Last week, over 80% of the S&P 500’s stocks advanced, and 82 of them were up at least 5%. However, none of the biggest gainers were among the 20 largest holdings.
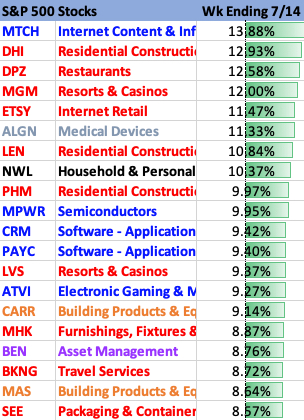
In other words, the revolving rotation continues to keep things under control from an index perspective.
In particular, the SPX remains above three uptrend lines, including the one that commenced in mid-May.
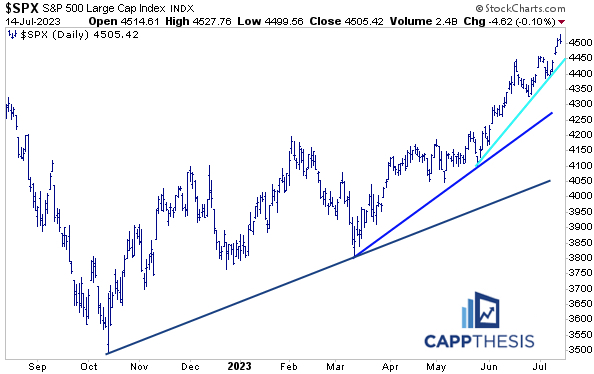
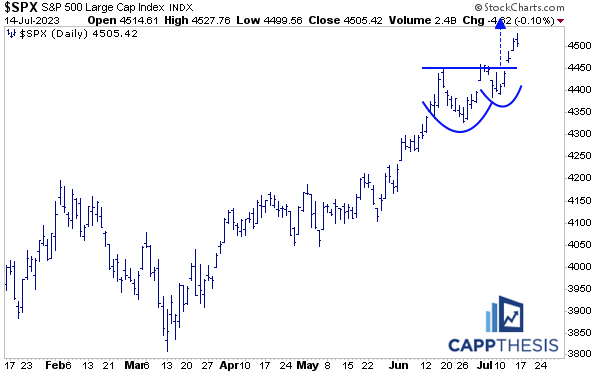
Updating the pattern work, the index got closer to achieving its 4,540-target near Friday’s highs (4,527).
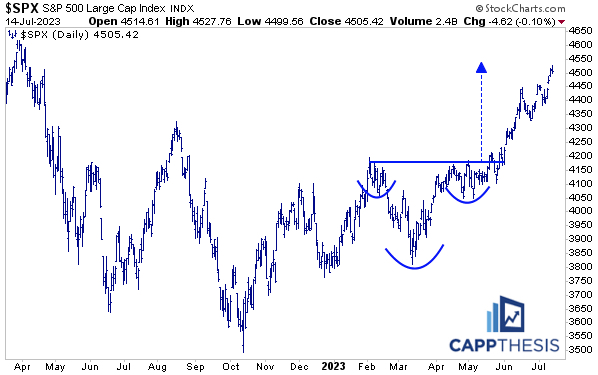
It remains above the most recent cup/handle breakout, as well (target 4,590).
Market Strength Indicator
Last week’s gain pulled the SPX’s Market Strength Indicator back near its extreme, with both the Williams %R and 14-Day RSI indicators now overbought again.
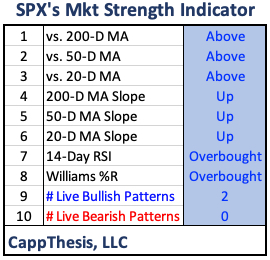
Like most indicators now, though, this hasn’t resulted in s tradeable sell-signal. We talked about the MACD last week in this regard – the last four “sell signals” (all since April) only have resulted in whipsaws – where the prior five nailed major tops going back to the beginning of 2022.
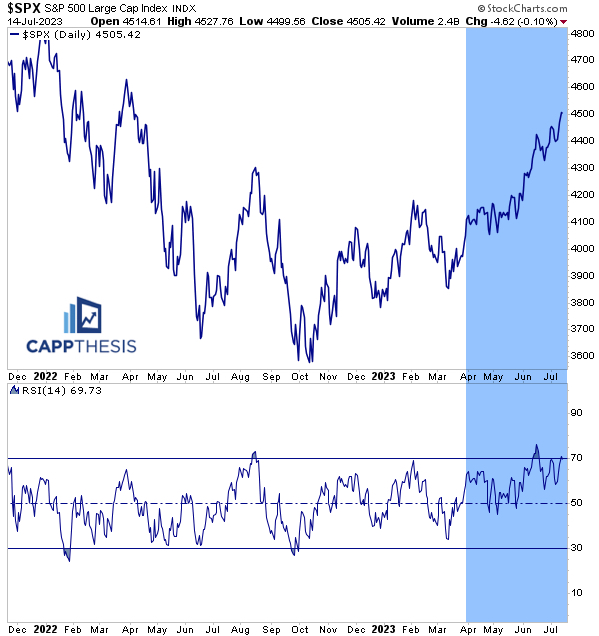
Simply stated, in uptrends, the term “overbought” isn’t a bad word. Looking at the 14-Day RSI specifically, seeing the SPX oscillate between overbought territory and the mid-point of its range recently has been the epitome of a strong market.
We know this can’t continue into perpetuity, but we need to both recognize it and respect it for as long as it persists.
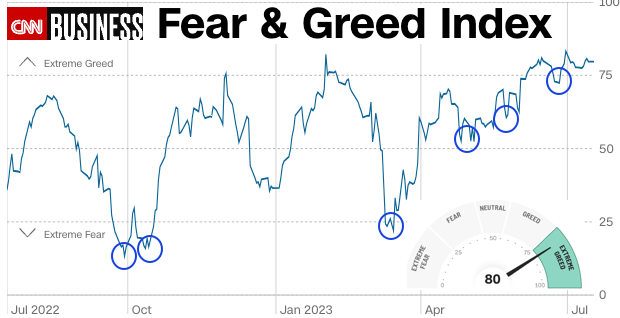
Sentiment
The CNN Business Fear & Greed Index also has remained at, or near, the Extreme Greed zone for multiple weeks – again, this can’t persist forever either.
But the one trend we’ve noted over the last few months is that the sentiment gauge has been making higher lows on pullbacks, like the SPX. This is something we all should be monitoring going forward.
Euro Stoxx 50
We know things can turn on a dime, thus, it’s worth keeping an eye out for potential divergences. The Euro Stoxx 50 index is down over 1% today and still having trouble breaking out to new highs. Its own 14-Day RSI has been making lower highs for months now.
With so many foreign markets doing well last week thanks to the tumbling dollar, this remains an important one to keep on our radar screens.
Continued weakness eventually could negatively affect the US.