Topics Covered:
-Weekly Performance
-SPX Weekly Winning Streaks
-Weekly Breadth
–Best 20 ETFs: OIH Oil Services
–Worst 20 ETFs: SMH Semis vs. SPX
–Major Indices: IWM R2k
–Sectors: XLP Con Staples
–Style: VT Total Stock Market
–Industries: ARKK
–Stocks: BA, J
–Foreign Markets: VNM Vietnam
–Fixed Income: 10-Year Yield
–Commodities: Gold
–Currencies: US Dollar
–Crypto: Bitcoin
Weekly Performance
SPX
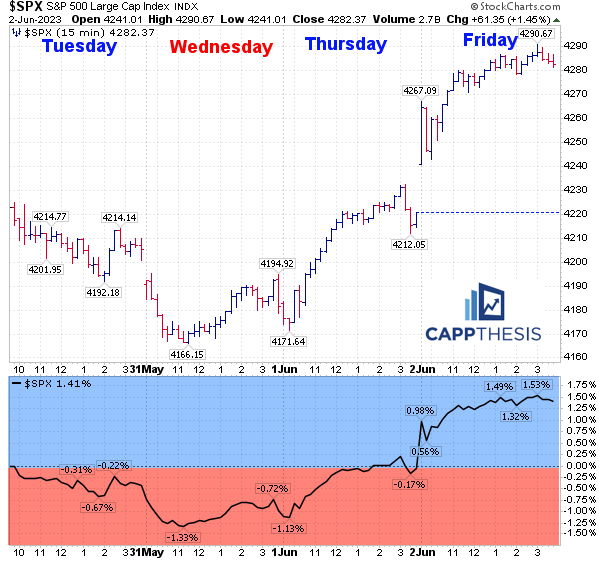
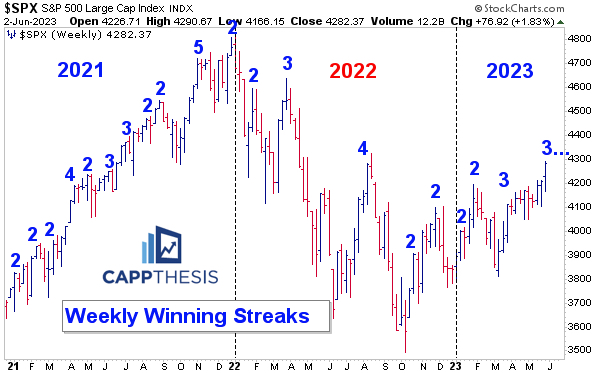
The SPX logged its third straight weekly gain last week, which now is tied for the longest of 2023. The last time we saw four straight was during the June – August’22 bear market rally.
From the October’22 low, we’ve now seen six different streaks over eight months.
From January – September’22, there were just three over a nine-month time frame.
In 2021, there were 11 weekly winning streaks.
Momentum is a real thing, and we see how differently that has played out over the last 30 months.
So, while bulls would like to see current streak extend further now, it’s more important to see another winning streak commence soon after this one ends.
Breadth
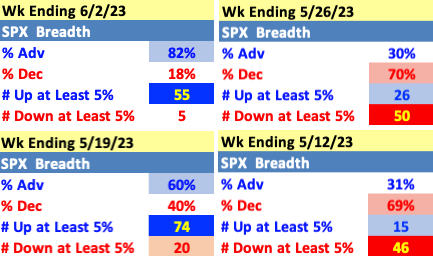
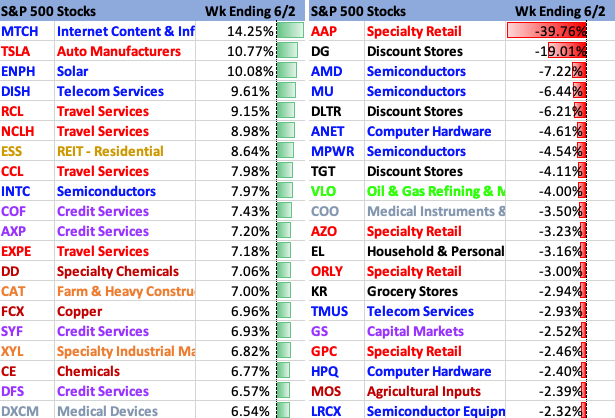
With 82% of the S&P 500’s components up last week, it was the strongest breadth since the first week of 2023 – also 82%. The number of stocks losing more than 5% (5) were the fewest since the week ending 11/25/22.
Tech finally underperformed during last week’s four trading days, but with the rest of the market stepping up, the “bad breadth” argument took a big hit. Seeing this rotation continue as Tech works off some very extended indicator readings will be the biggest test now.
Best 20
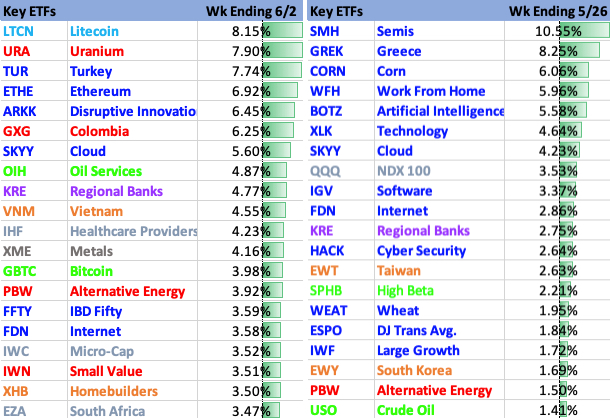
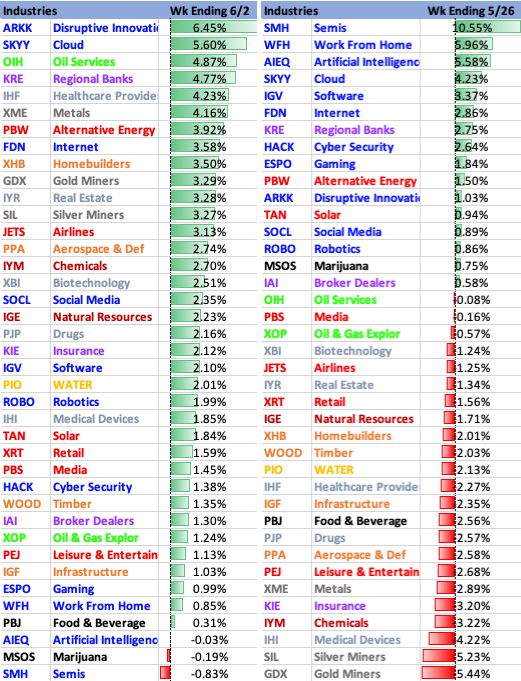
The more colors we see in the top 20, the healthier it is. Note how many more were in blue (mostly tech) the prior week vs. this past week.
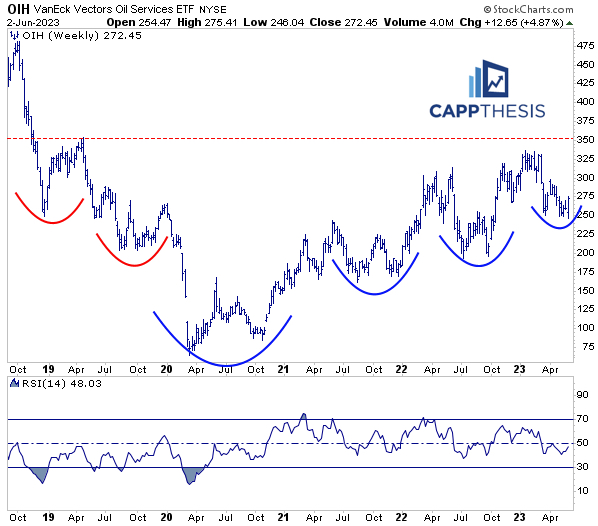
Seeing the likes of OIH Oil Services continue to leverage its reversal would be a big piece of the continued rotation now. Each prior “higher low” eventually led to new highs, which OIH will be trying to replicate again now.
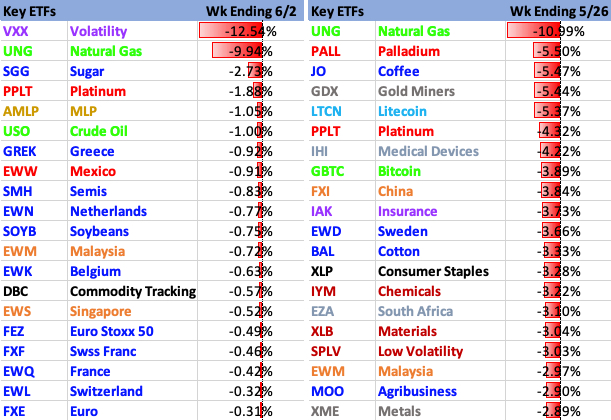
Worst 20
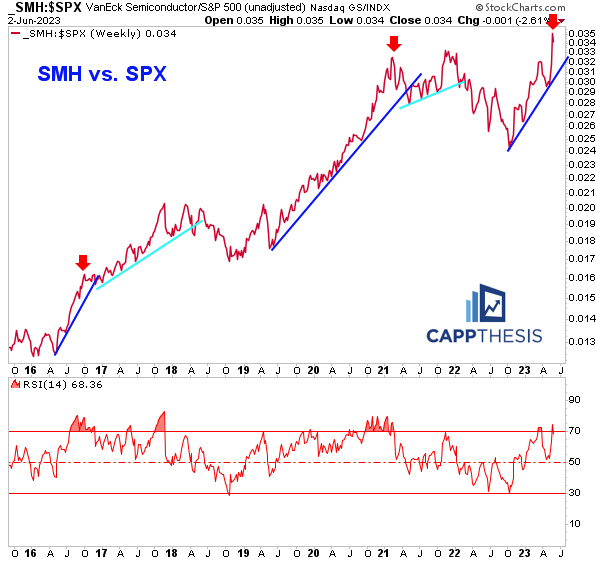
SMH finally took a breather last week, but it’s clearly still quite extended vs. the SPX. We’ve seen this before over the years.
Since 2016, we’ve seen steep uptrends develop twice prior (dark blue uptrend lines). Both weren’t sustainable, but the ratio didn’t crack right away after the past uptrend lines were broken.
Instead, a second leg then started both times, which took the ratio even higher, but at a slower pace (light blue line). We shouldn’t discount that happening again in the coming months.
Major Indices

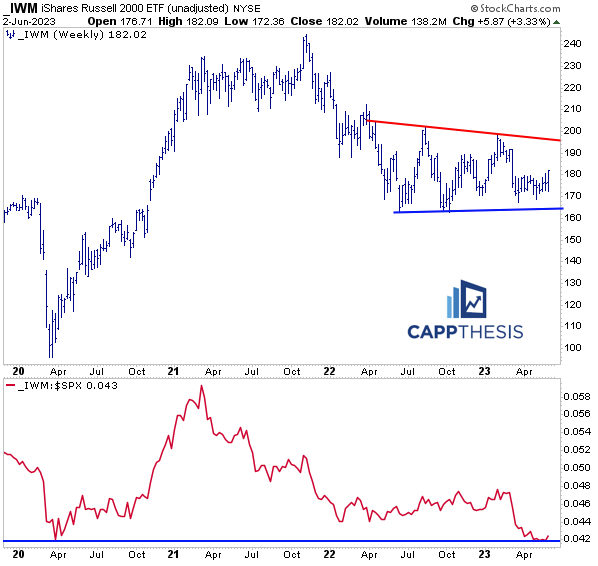
IWM logged its best week since the last week of March. If the past rallies are any indication of how far this will go, then IWM could eventually get back to the resistance line in the mid-190s.
S&P 500 Sectors
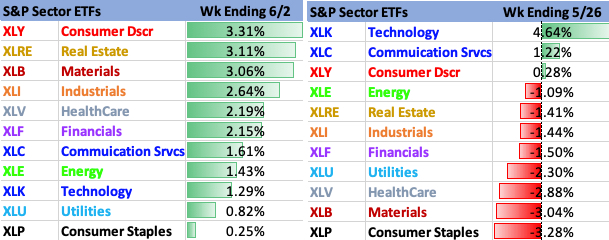
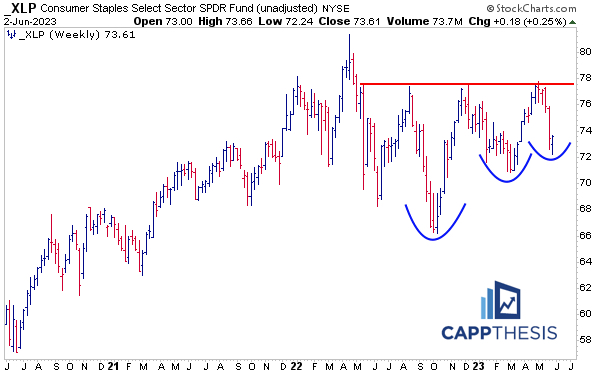
All 11 Sector ETFs advanced last week, including XLP Consumer Staples, though it only was up 25 bps. But if a rotation is upon us, then last week’s hold could be a key higher low for the ETF. A return to the clear resistance line near 78 then would not be surprising.
Style
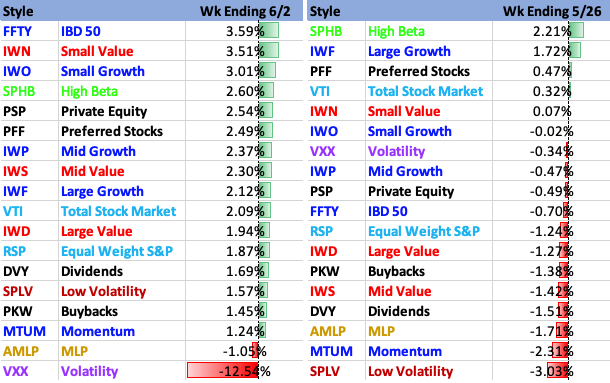
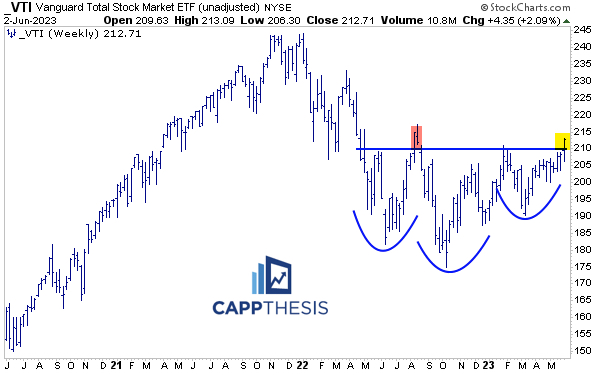
The VTI Total Stock Market ETF broke out from a major bottoming formation last week. The initial measured move target now is near 230 – as long as the breakout zone holds. The last push above this zone happened last August, which was reversed aggressively with the market rolling over.
Industries
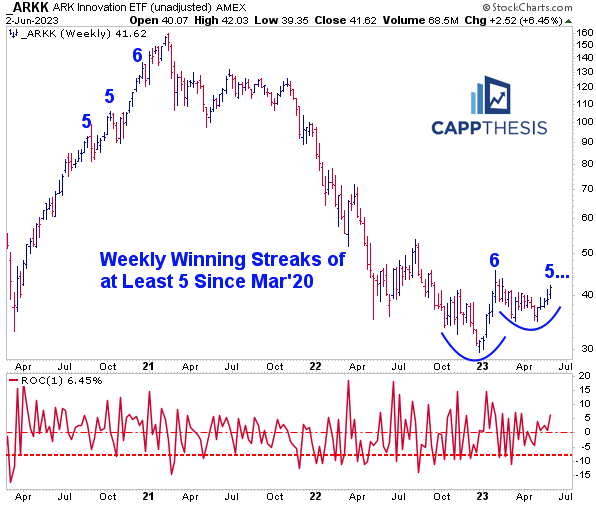
ARKK’s snapback continued last week, too, and now it’s up five straight weeks. We saw six in a row earlier this year. More importantly, this is the first cluster of 5-week winning streaks since 2021.
We profiled ARKK’s daily pattern breakout recently, and it could complete a bigger formation soon should the extension persist.
S&P 500 Best & Worst 20
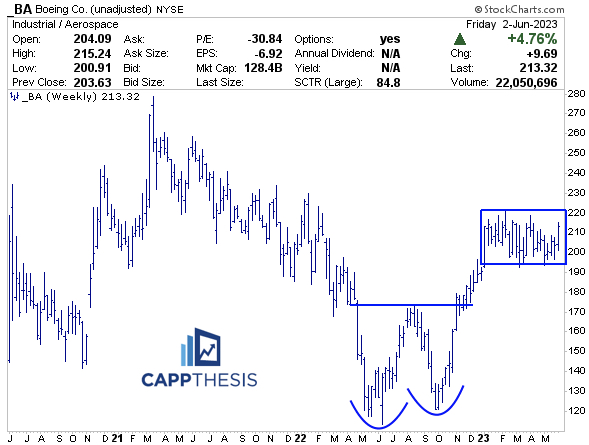
BA literally has done nothing on a net basis in 2023. But in doing so, it’s constructively digested the preceding extension. A breakout through the 220 zone could encourage another round of demand and target the 250 area.
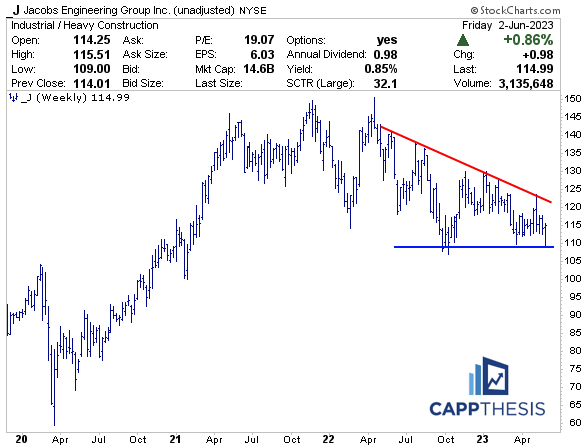
J has been in a downtrend for over a year now. And while it has continued to hold near the 120 zone, each ensuing rebound has made a lower high. As long as that continues, selling strength near the downtrend line would be the best strategy.
Global Markets
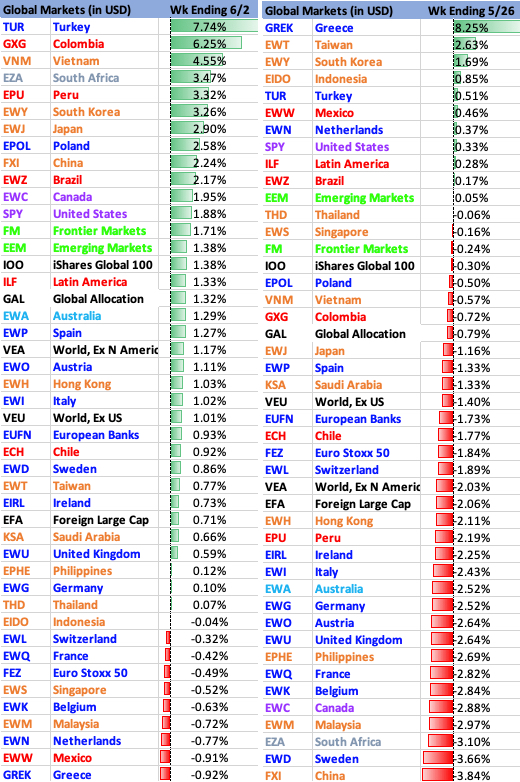
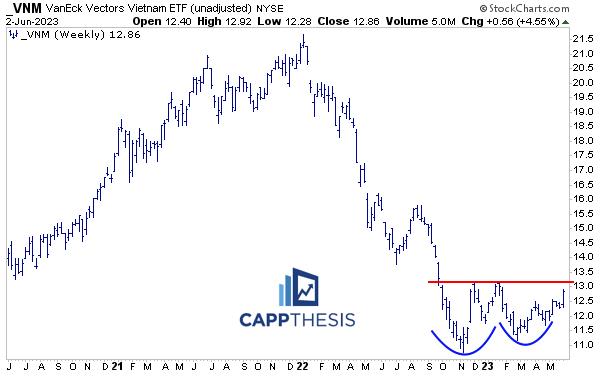
VNM was among the leaders last week, and it now has gotten closer to the 13 zone, where it failed at twice prior. That said, finally breaking above it soon would complete a multi-month bottoming formation. The initial upside objective would be near the 15-16 area – its August’22 highs.
Fixed Income
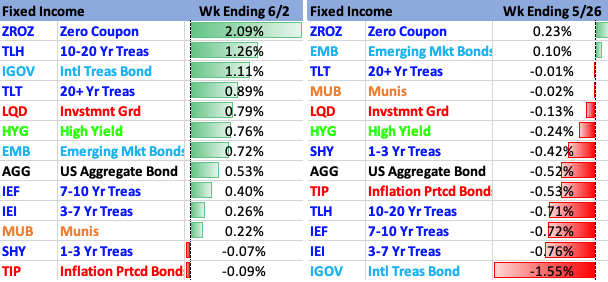
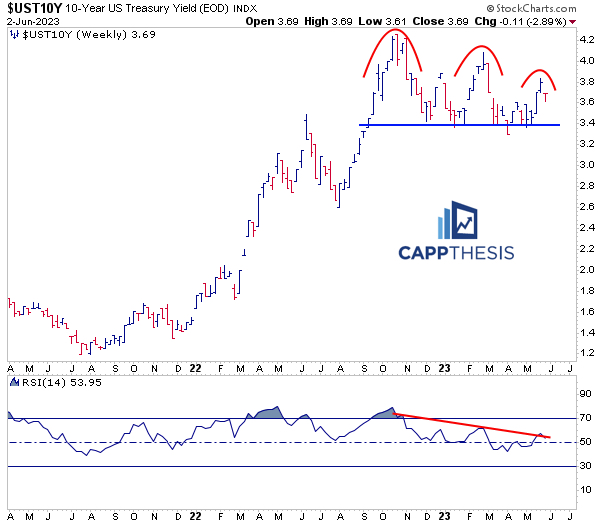
The 10-Year Yield’s weekly winning streak ended at four last week. It was up six straight weeks during the last failed bounce. For now, then, it continues to make lower highs, which still is the most important trend to watch.
Commodities
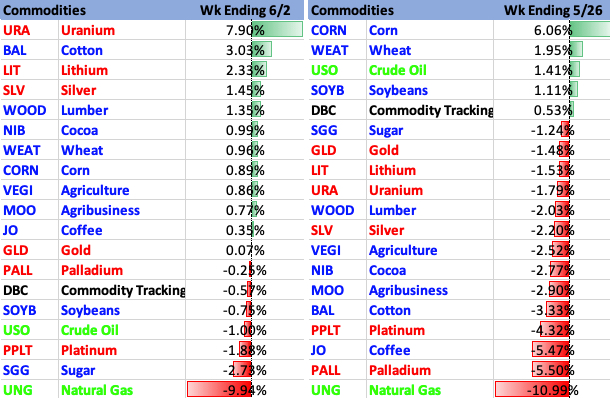
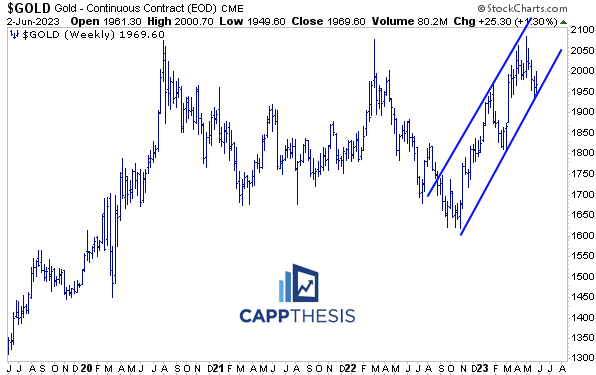
Despite its recent struggles, Gold has remained in a tight upward sloping channel. The best rallies have come when it has bounced from the bottom of said channel – which it will be trying to do once again now. Each rally led to higher highs and a return to the channel’s upper line.
Currencies
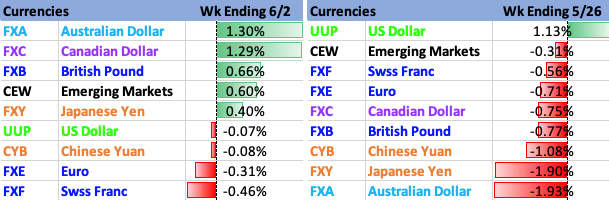
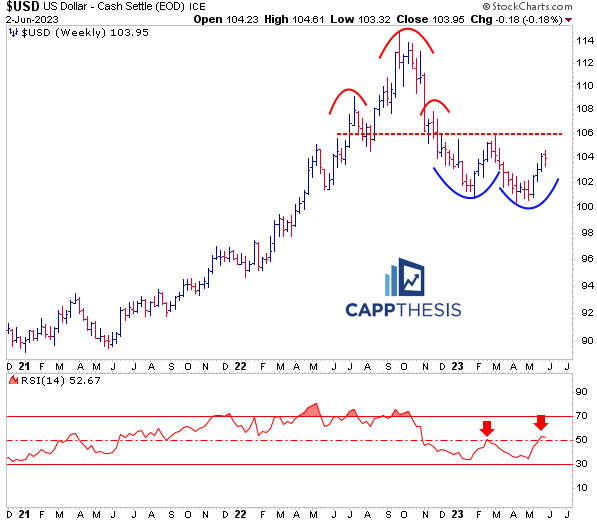
The US Dollar’s winning streak ended at three last week, which was the longest streak since four in a row from earlier this year. That last bounce failed near the pictured resistance line. This one faded before returning to that same line.
While we can see the potential for a bottoming formation, for that to happen, the Dollar needs to return to – and bust through – that 106 area.
If that continues to fail, the longer-term downtrend will remain in play.
Crypto

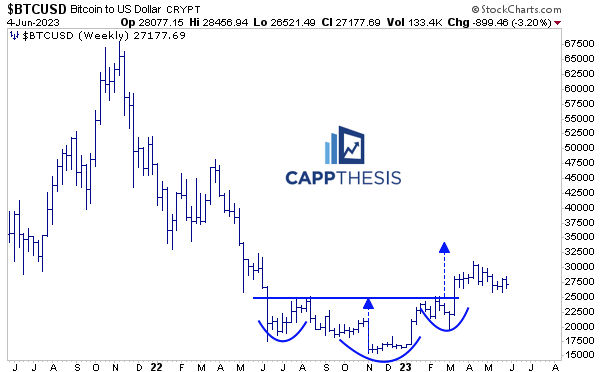
New week, same chart for Bitcoin… The sideways movement has frustrated both sides, but the 2023 breakout continues to be alive.
