Topics Covered:
1- SPX: +1% WEEKS
2- Breadth
3- NDX
4- XLC Comm Services
5- MTUM Momentum
6- SMH Semiconductors
7- Stocks: MNST, LYV
8- EWT Taiwan
9- ZROZ Zero Coupon Bonds
10- Gold
11- US Dollar
12- Ethereum
Weekly Performance
SPX
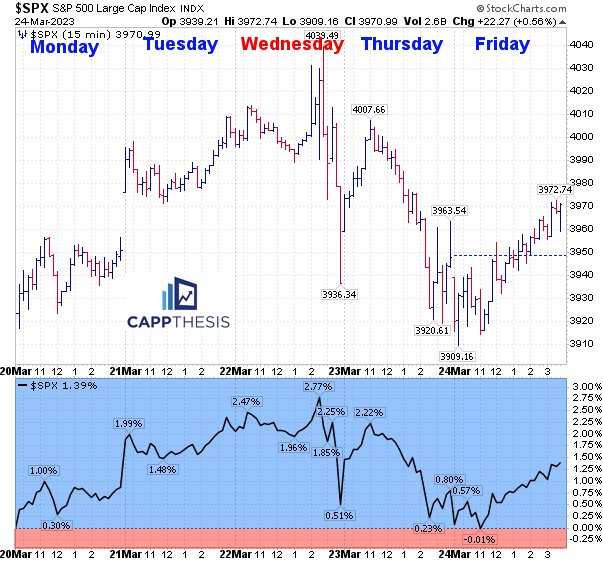
The SPX withstood the 2.6% intra-day sell-off on Fed Day last Wednesday and notched its second straight weekly gain. As discussed on Friday morning, this now is the second two-week winning streak of 2023.
There were five all last year… and 11 in 2021.
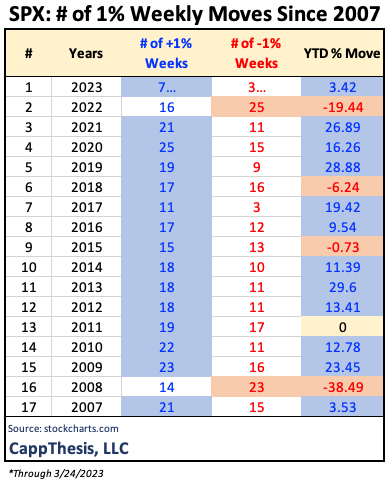
It also was the index’s SEVENTH 1% weekly gain of the year vs. just THREE 1% weekly losses. That’s been the overriding difference so far in 2023. We showed the below table three weeks ago and noted the following:
“Since 2007, -1% weeks outnumbered +1% weeks only twice in a calendar year – in 2008 and 2022. The SPX was down -38% and -19%, respectively.
A quick glimpse at the data also shows that the greater the discrepancy between the number of +1% and -1% weeks, the better the YTD gain:
The SPX had 10 more weekly 1% gains vs -1% losses from 2019-2021 and it logged gains of +29%, +16% and +27% during those years.
In other words, limited downside action produces uptrends.”
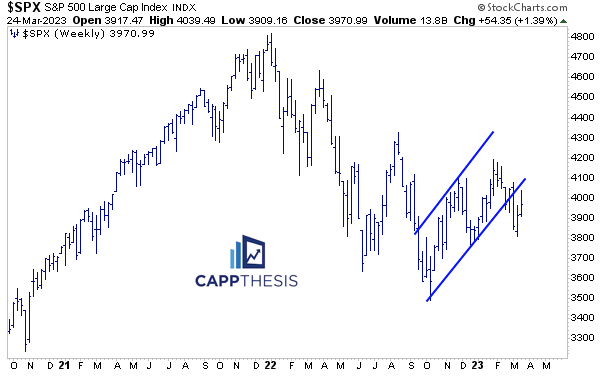
The back-and-forth movement led to a muddled week in our daily pattern work. On the weekly chart, the SPX remains below the uptrend line from the October lows.
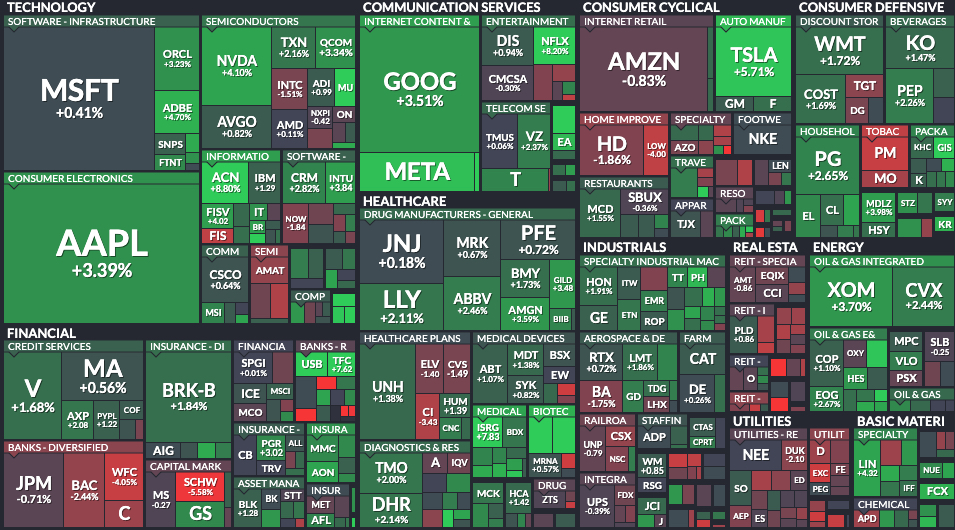
Weekly Market Map
Breadth
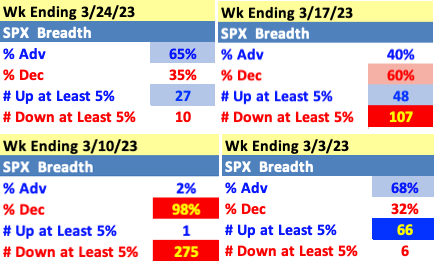
The rebound was supported by positive breadth this past week: with 65% components advancing, it was the best weekly internal ratio since the week ending 3/3. This was a better outcome than the prior week (60% down despite the SPX being up 1%).
The biggest difference last week was that only TEN components dropped 5% vs 107 and 275 during the last two weeks, respectively…
Major Indices

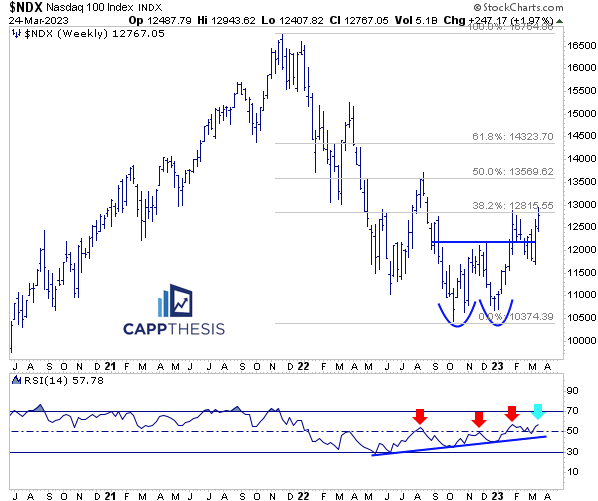
The NDX has held the top spot now for four straight weeks, though this past week the performance difference was the smallest we’ve seen yet.
The recent comeback has reignited the pictured multi-month double pattern. The NDX finished right near the 38.2% retracement of the entire decline last week, which it faded near in early February. This is the next key hurdle again now.
S&P 500 Sectors
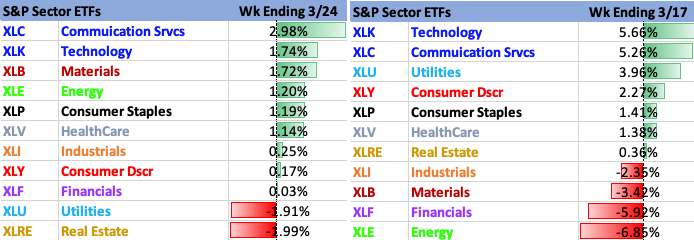
Year-to-Date, XLC, XLK and XLY are up +18%, +17% and +9%, respectively. The other sectors are down for the year.
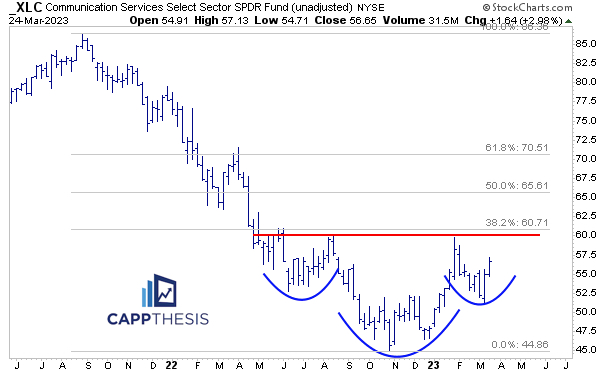
XLC Communication Services continues to lead, as it was the first one to show signs of turning by breaking out as the year began. For its comeback story to continue, it will need to eventually break the 60 level.
That point is the neckline of the clear potential H&S pattern AND where the 38.2% retracement of the entire 2021-22 decline resides.
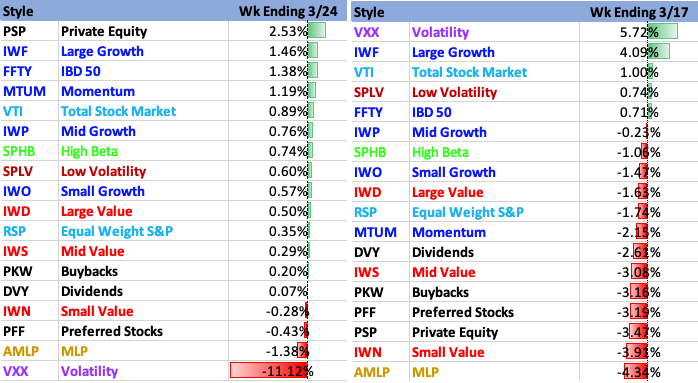
Style
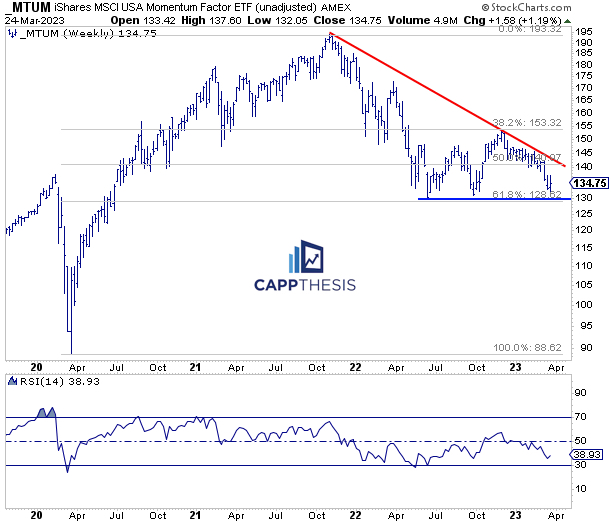
MTUM Momentum was among the Style leaders last week thanks to its dominant sectors, Healthcare (36%) and Energy (24%) bouncing. Holding the 128-30 zone remains critical: the 2022 lows are right there, along with the 61.8% retracement of the 2020-21 advance.
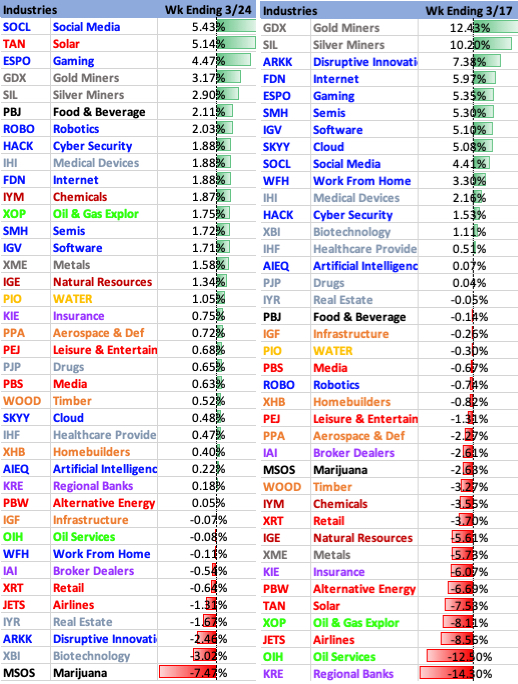
Industries
On Friday, I tweeted this chart of the SMH Semiconductors and mentioned that momentum is fading – noting the diverging RSI indicator. It received a high level of engagement from both sides, showing how many eyes are focused on SMH and how influential its next leg will be.
So far, it remains close to its highs, but it hasn’t closed well the last four days…
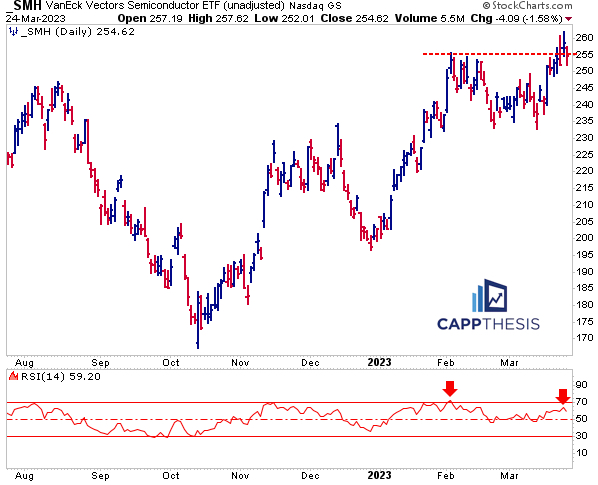
On the weekly chart, the 250 zone is crucial to hold. It tried and failed here earlier this year. It will need a better follow through effort this time.

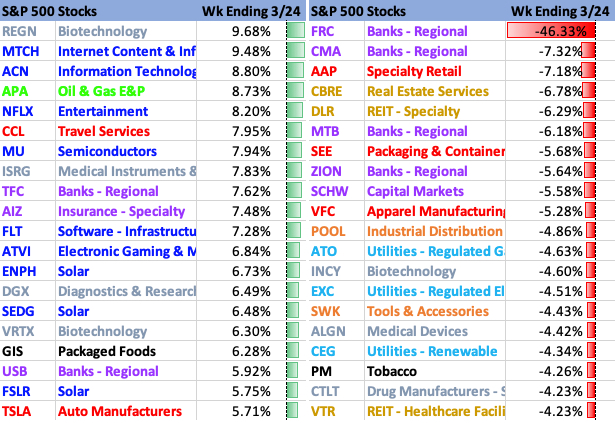
S&P 500 Best & Worst 20
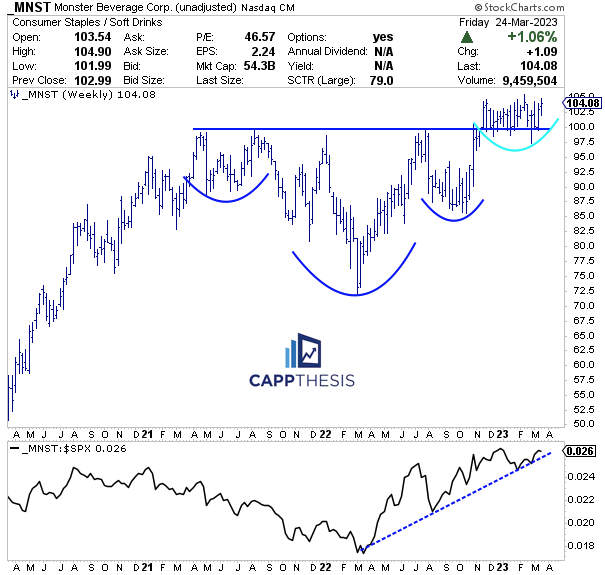
As Consumer Staples continues to quietly outperform, one of its holdings, MNST, possesses a constructive chart pattern. It has held the breakout zone of this “monster” bullish formation over the last few months.
The tight consolidation since could act as a springboard when/if it’s finally leveraged.
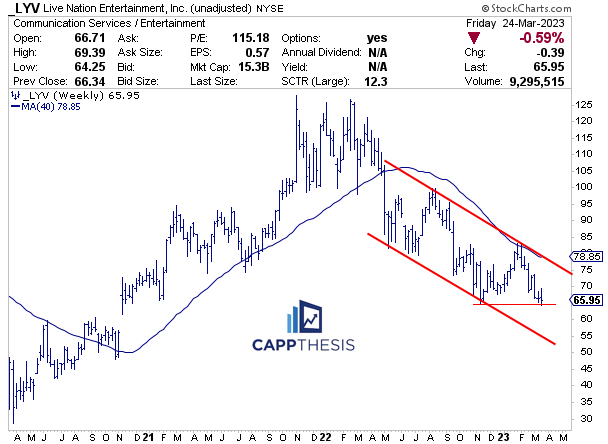
LYV continues to trend lower and has been unable to puncture its 40-week Moving Average since breaching it 12 months ago. While it hasn’t been a free fall since then, strength continues to be sold.
It finished last week near a key support zone, which, if broken, would the target being the lower line of its long trading channel.
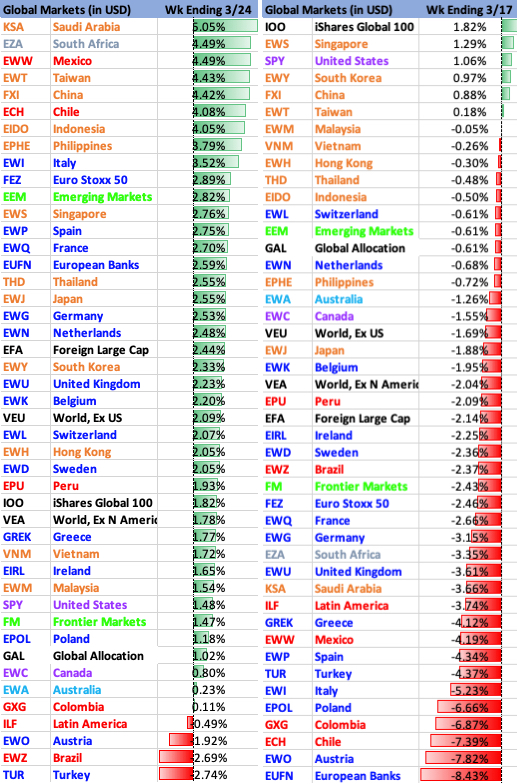
Global Markets
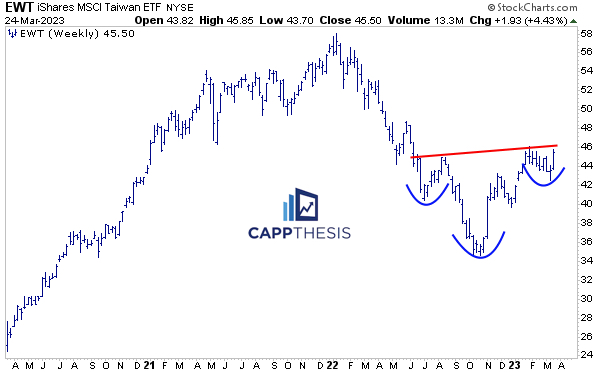
EWT Taiwan has outperformed the last two weeks and now is back to testing the neckline of its long potential bullish pattern.
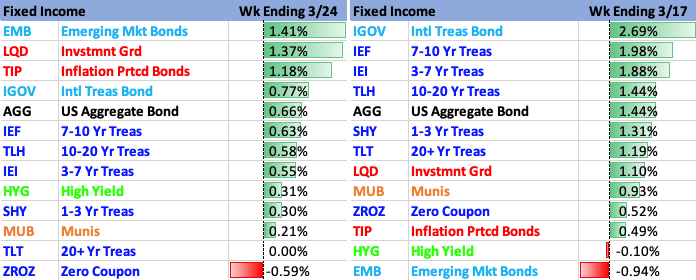
Fixed Income
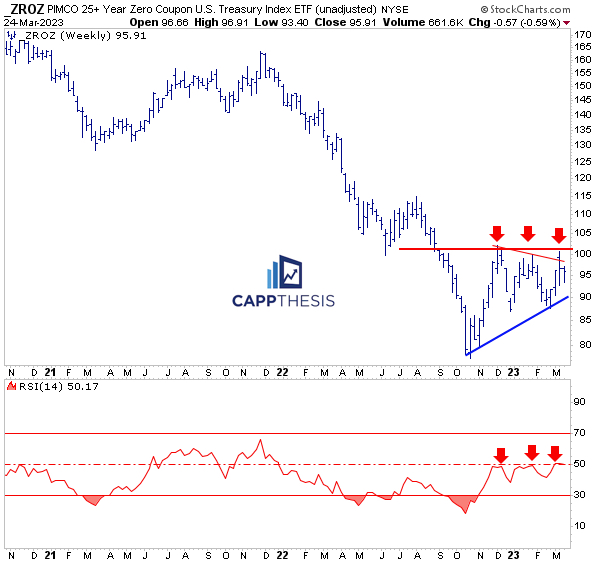
As the 10-Year Yield tests the 3.4% zone, ZROZ continues to flirt with the 100 area. So far, that level has held as resistance, as the 14-Week RSI has been unable to punch through 50… This is not a coincidence. It continues to be a waiting game for now…
Commodities
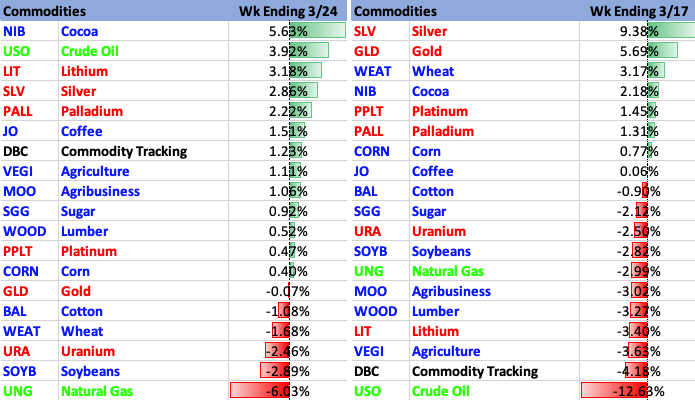
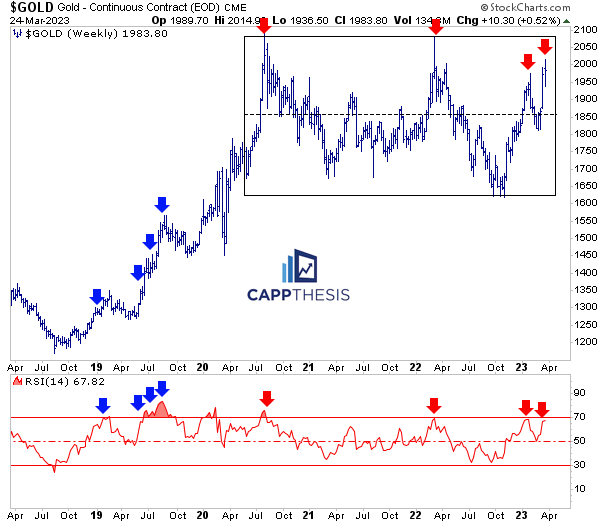
Gold was up marginally last week, as it approaches the top of its two-year range. Needless to say, the area around 2,000 has not treated buyers too kindly since 2020.
Gold’s weekly RSI is nearly overbought again, as well, which has led to negative reversals the last three times.
However… the same overbought conditions only temporarily slowed down Gold in late 2018 through early 2020 during its strong uptrend.
We’ll know if it’s different this time by how it reacts to being stretched again now.
Currencies
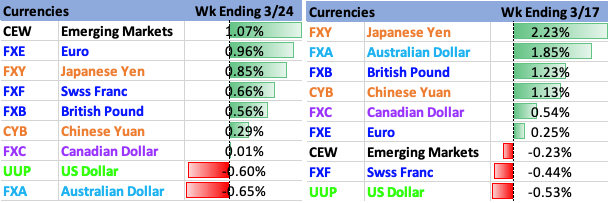
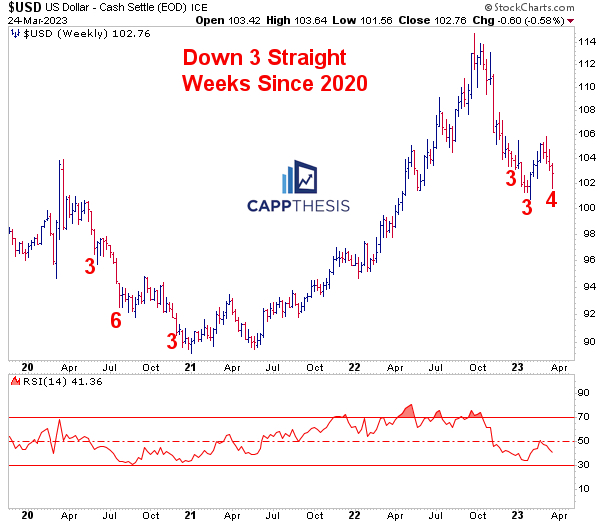
The Dollar dropped for the fourth straight week last week, which is the longest losing streak since June-July’2020. It’s also the third weekly losing streak since late 2022. Clusters of weekly declines equals a downtrend until proven otherwise…
Crypto

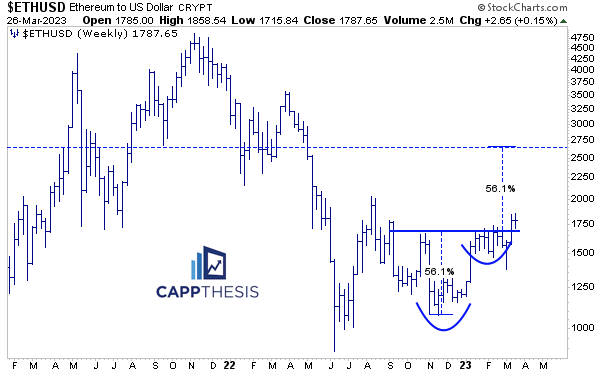
While Bitcoin’s breakout is clear, Ethereum’s is a bit trickier with noticeable resistance from the summer still overhead. That said, ETH has broken through a key level. Using a log scale measured move approach, the target would be up near 2,600.
