Topics Covered:
1- SPX -1% Week Study
2- Breadth
3- DJIA
4- XLE Energy
5- IWO Small Cap Growth
6- ARKK
7- Stocks: TSCO
8- Stocks: LYV
9- EUFN European Financials
10- ZROZ Zero Coupon Bonds
11- Crude Oil
12- US Dollar – Weekly Winning Streaks
13- Bitcoin
Weekly Performance
SPX
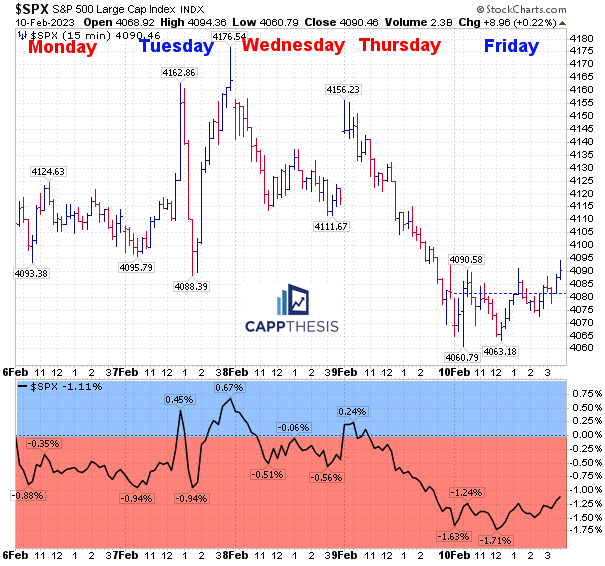
Last week, the SPX logged its first 1% weekly decline of 2023. It wasn’t overly damaging on the weekly chart, though, as the index remains inside the multi-month upward sloping trading channel.
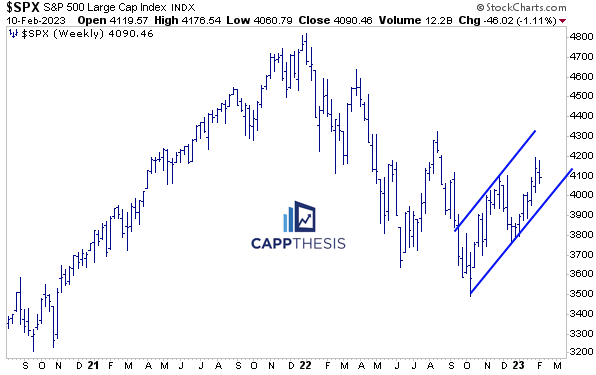
The best thing the SPX has done over the last two months is avoid downside follow-through. This simple, yet powerful trait, is key for all uptrends. One easy way to detect downside follow-through is by tracking what the SPX does the week after a 1% weekly loss.
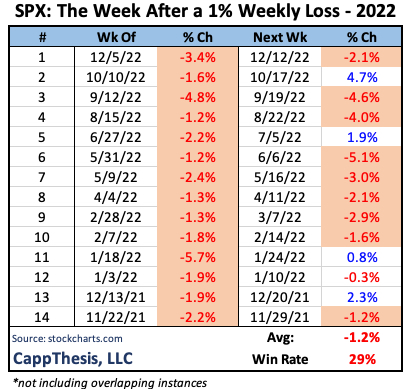
For instance, in 2022, the index did a VERY poor job of bouncing back after -1% weeks:
10/14 times, the SPX was lower again the next week. 9/14 times, another weekly loss of at least -1% followed.
The average weekly move after the first appearance of a -1% week was -1.2%
2021 was a different story…
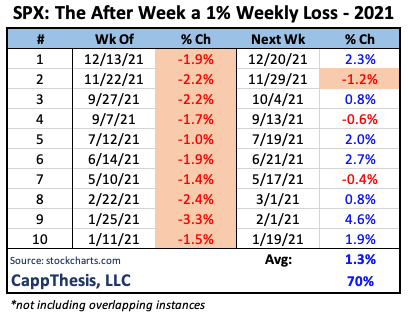
The SPX was HIGHER 7/10 times the next week, with an average move of +1.3%. There were consecutive -1% weekly losses just once.
So, while this coming week won’t determine the rest of the year, tracking how the SPX responds to big down weeks in 2023 will be telling.
Weekly Market Map
Breadth
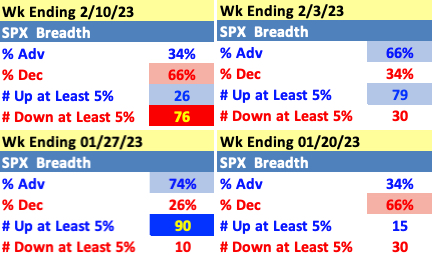
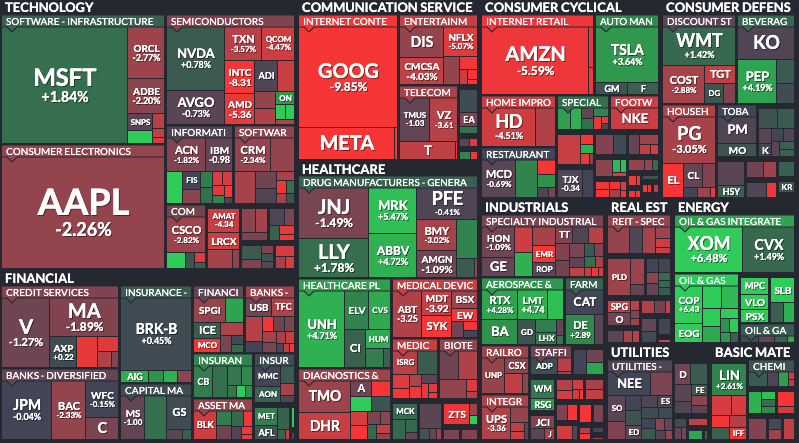
It wasn’t just the biggest names struggling last week, as the SPX’s weekly breadth was the worst since the week ending 1/20. The number of 5% decliners was the worst we’ve seen in 2023, too.
Major Indices

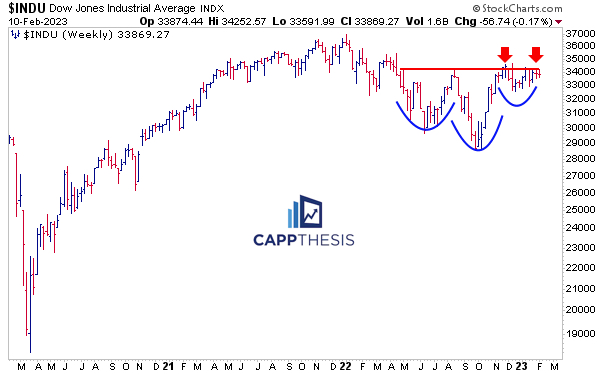
The DJIA was the first of the major indices to reclaim its August highs during the comeback, and with non-Growth areas outperforming last week, it was just marginally lower. The average has yet to break out from the 11-month potential inverse H&S pattern, but it remains very close to the neckline.
S&P 500 Sectors
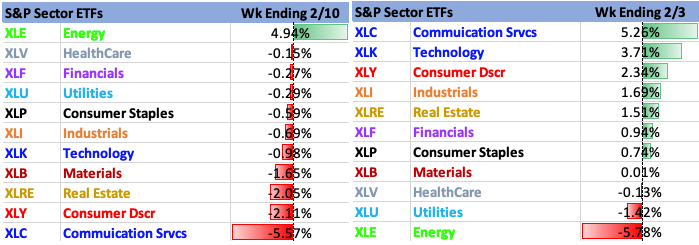
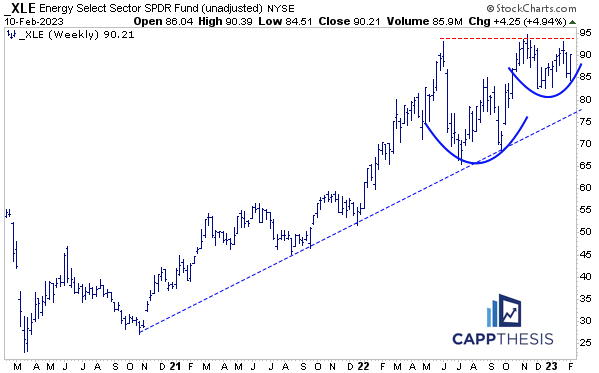
The XLE Energy ETF went from last to first on our weekly performance grid. And by holding where it did, the large potential bullish cup and handle that we’ve been discussing remains in play
Style
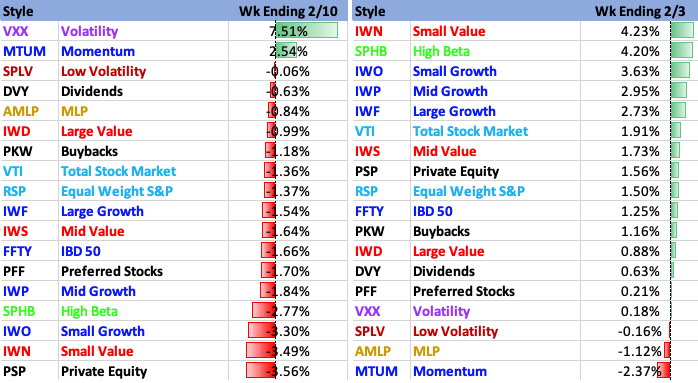
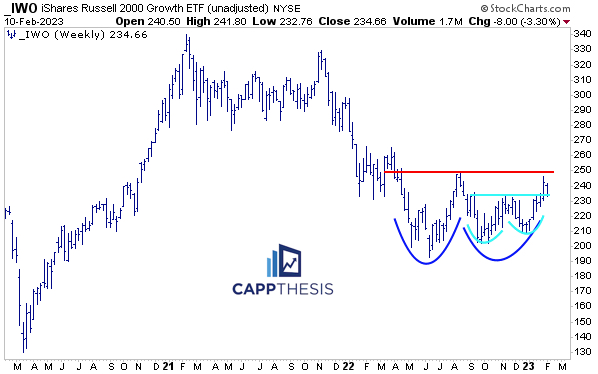
Like various other ETFs, the IWO Small Cap Growth ETF shied away from a multi-month breakout last week, enduring a 3.3% decline. But IWO did manage to close on top of the shorter-term breakout zone from last week. Continuing to hold near 230 now is very important.
Industries
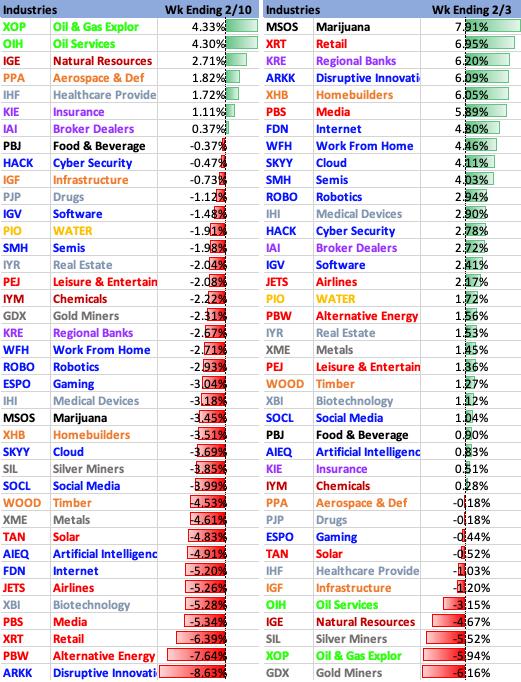
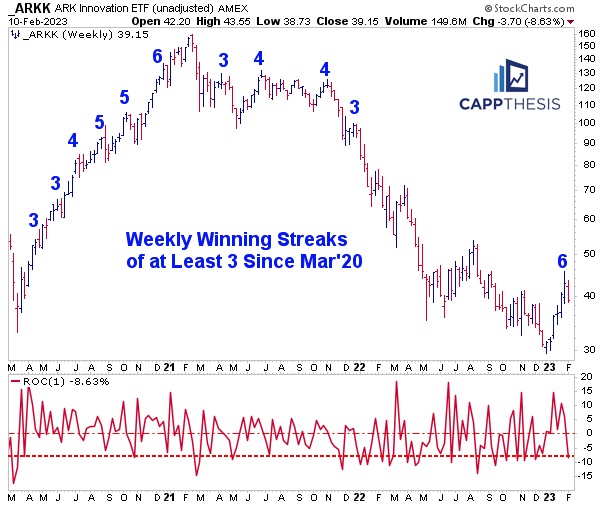
ARKK got crushed by 8.6% last week, the worst among our 175 ETF list, which nearly wiped out ALL the prior week’s gain. That shattered ARKK’s 6-week winning streak, which had been the longest weekly run since late 2020 – as the ETF was still going up.
As we see from the bottom panel, –8% weeks were the norm since late 2021, when the ETF’s major leg down commenced… Needless to say, more -8% weeks wouldn’t be a good sign…
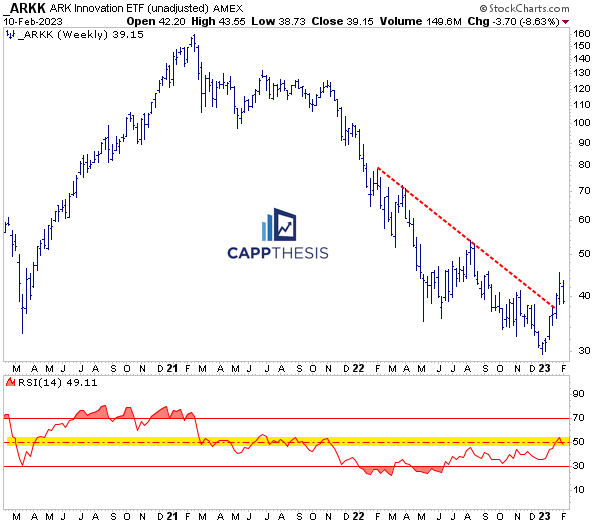
The strong weekly run produced a weekly RSI above 50 for the first time since November’21, as well. For most of 2021, the indicator topped out in the 50s, which eventually gave way to the big down leg. ARKK will need a better effort now to keep the RSI buoyant.
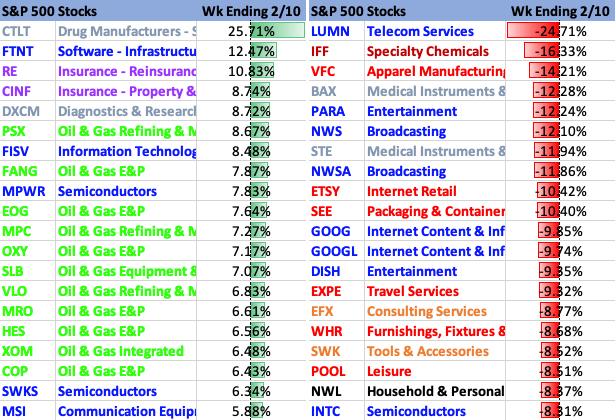
S&P 500 Best & Worst 20
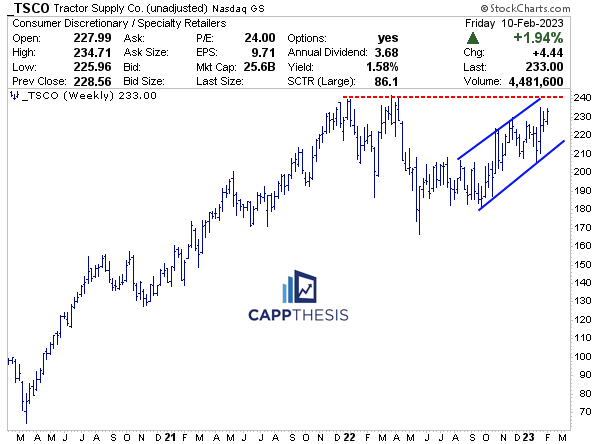
TSCO bottomed last May and has stayed confined to the pictured upward sloping channel since last summer. Continuing on this path would put its former highs near 240 in the crosshairs.
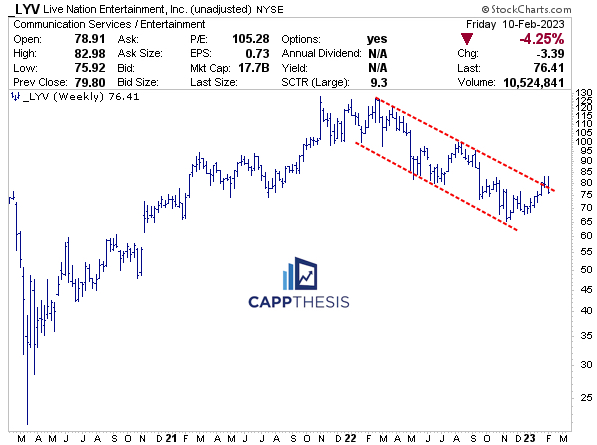
LYV is coming off a strong bounce since October, but the stock continues to make lower highs. Last week, it reversed near the upper line of its downward sloping channel.
If this trend persists, LYV could continue to retrace the recent bounce.
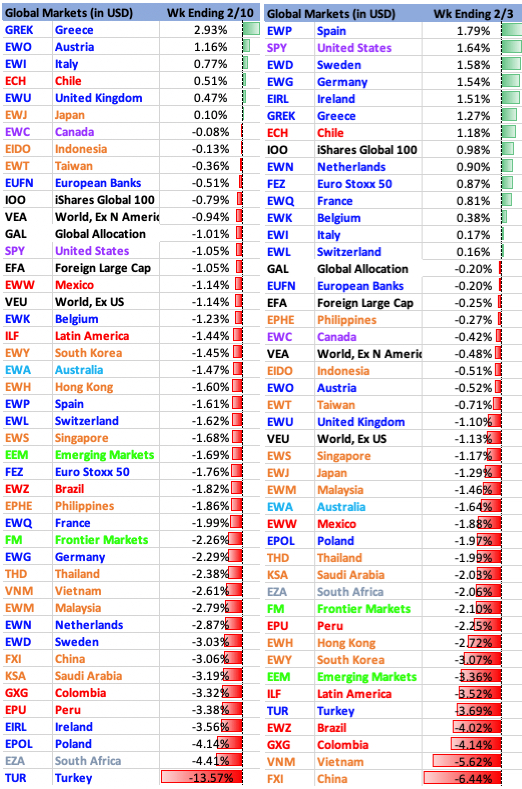
Global Markets
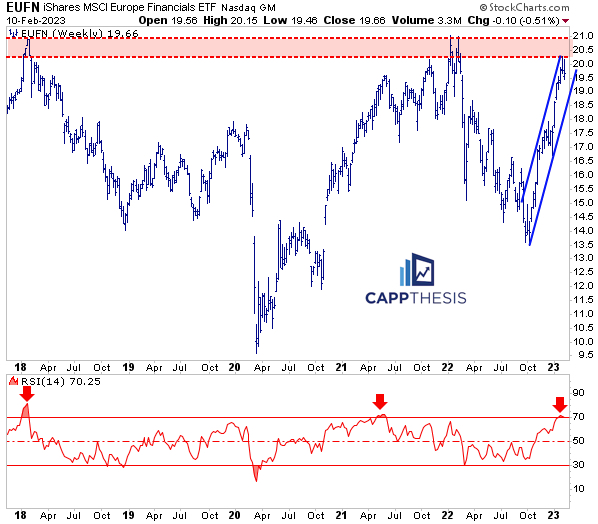
EUFN gained 50% from its 2022 low point through its high two weeks ago. That prompted the first overbought weekly RSI reading since May, 2021.
The ETF also is right back to the 20-21 supply zone, which it aggressively faded from in early 2018 and early 2022. This suggests a challenging risk-reward scenario.
Fixed Income
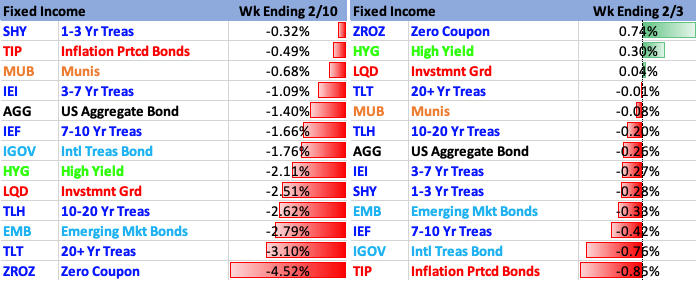
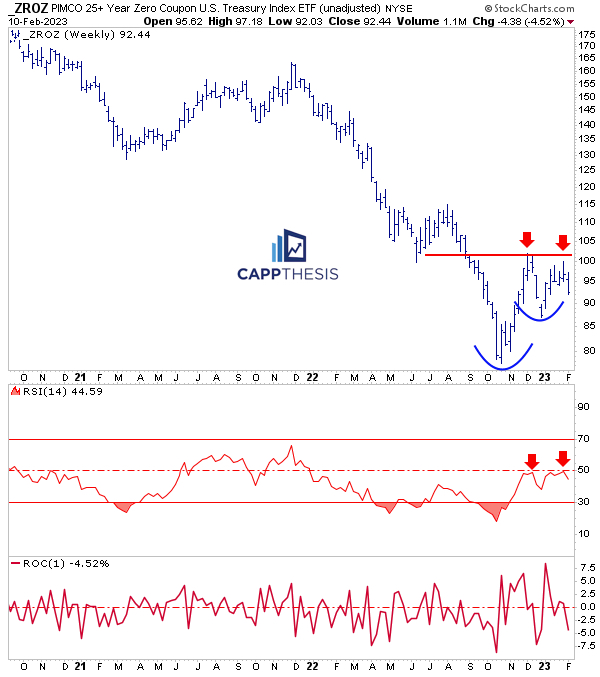
With yields rising again last week, the ZROZ Zero Coupon ETF logged its worst weekly decline (-4.5%) of the young year. That prevented ZROZ from breaking out for the second straight week. The 14-Week RSI has yet to puncture the mid-point, as well…
Commodities
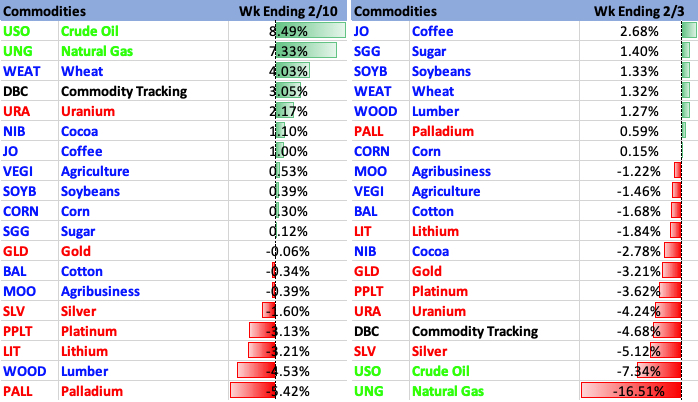
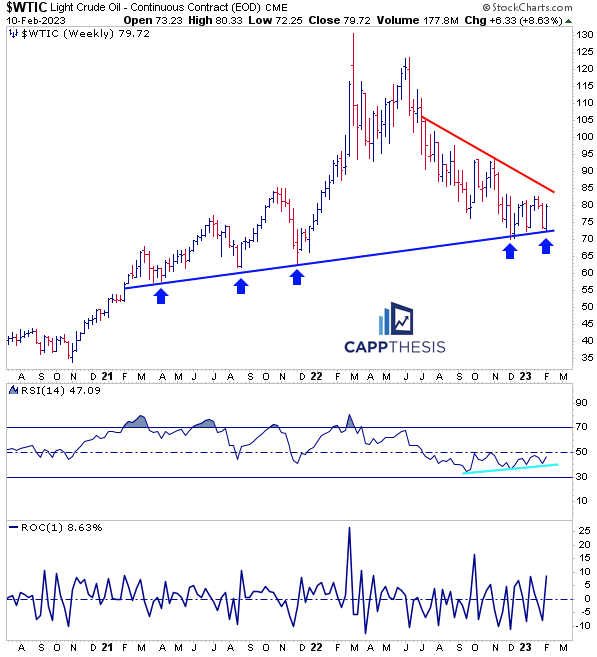
Crude Oil’s 8.6% surge last week was the second 8% weekly gain of 2023 and best since the first week of October (+16%). It bounced from a clear uptrend line, as Crude’s 14-Wk RSI continues to trend higher. The indicator bottomed in September, as Crude continued to sputter, a positive divergence.
Next step = puncture the DOWNTREND line.
Currencies

The Dollar has logged consecutive weekly gains now for the first time since August’22. In fact, that was the last time it had a streak of at least three, as well.
All the weekly win streaks of at least three since 2021 are highlighted in blue below. Obviously, long weekly runs were the hallmark of the Dollar’s strong ascent, which makes next week’s response a critical one.

Crypto

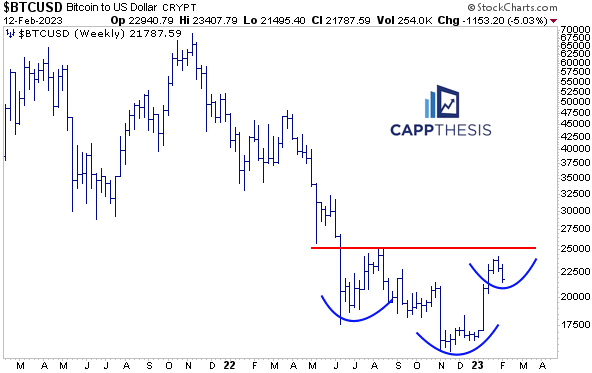
BTC finally gave some back last week, and now it must prove it can log a long-term higher low.
