Topics Covered:
SPX, Seasonality, Breadth, DJIA, Sector ETFs above their August Highs, XLV, MTUM, XME, ZBH, AMZN, EWD (Sweden), 10-Year Yield, WOOD (Lumber), US Dollar & Bitcoin
Weekly Performance
SPX
As we’ll see in the charts throughout this piece, many ETFs and asset classes we track have formed potential multi-month bottoming formations. Some have reclaimed their August highs (XLV), while others are getting closer (XME).
Indeed, the moves from the October lows are substantial, so we can’t expect the pace to continue. But at this stage, many have done what they SHOULD have done. It’s all about the follow through now…
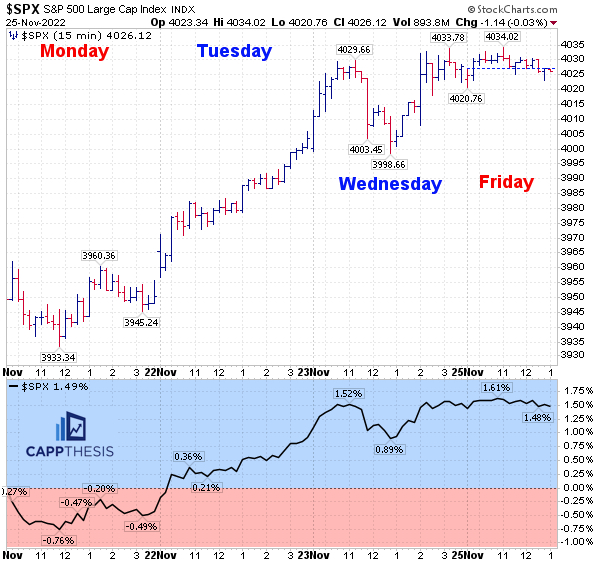
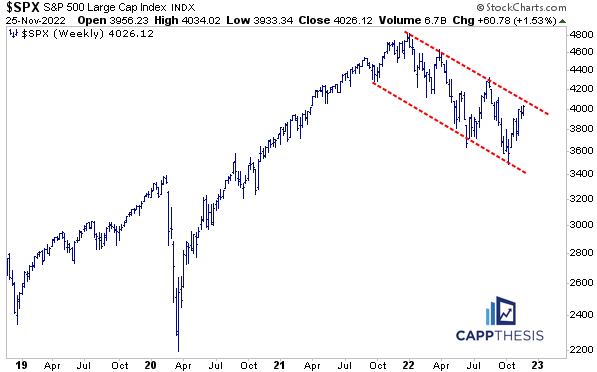
For the SPX, the breakout on the DAILY chart remains in play… as does the WEEKLY downward sloping channel. The index has yet to make a meaningful higher high since the end of 2021. This will need to change at some point.
Seasonality
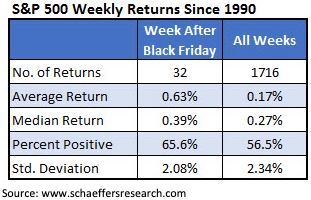
As noted by Schaeffer’s Investment Research, the SPX has outperformed ALL weeks since 1990 (+0.63% vs. +0.17%) the week after Thanksgiving. The index has been higher 65.6% of the time vs. the 56.5% across all 1,716 weeks.
Breadth – Last Four Weeks
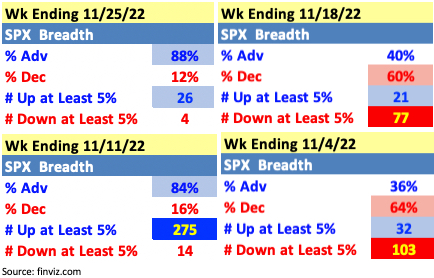
Breadth was very strong during the short week: the +88% ratio was the best since +90% during the week ending 10/28. The only two times since the summer that we saw two straight weeks of +85% were the weeks ending 10/21-28.
Major Indices

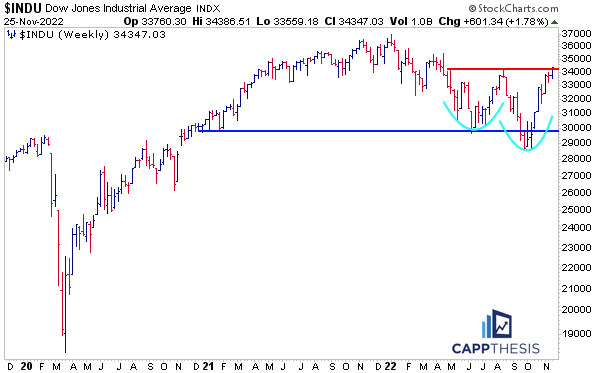
The DJIA continues to be among the weekly leaders, and with last week’s advance, it’s now above its August highs. With the index now up almost +20% from the October intra-day low, it could stand to digest some of this move. But from a pattern standpoint, a clear double bottom now has been completed.
S&P 500 Sectors
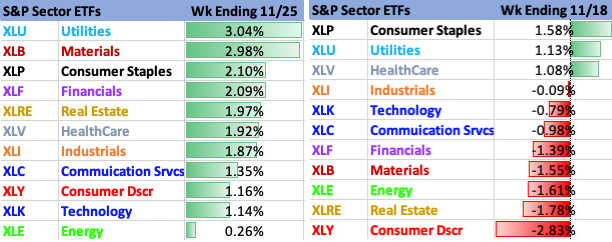
Five Sector ETFs now are above their respective August highs: XLB Materials, XLE Energy, XLF Financials, XLI Industries and XLV Healthcare.
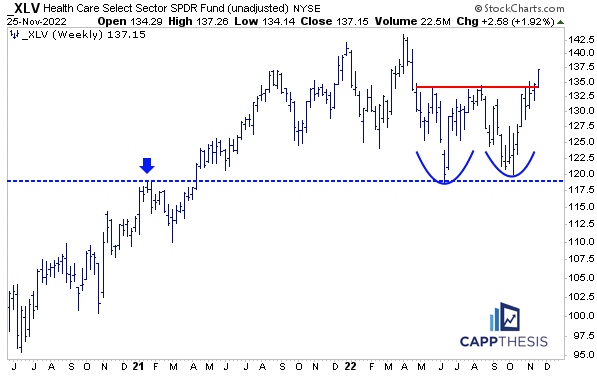
For XLV, it was the third straight week above said August high, as the ETF extended its double bottom pattern breakout. The upside target would be above its former highs.
Style
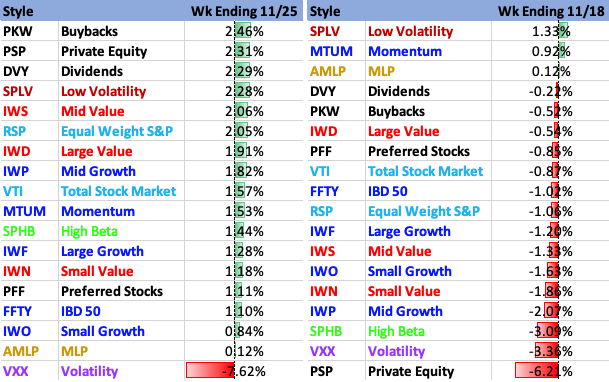
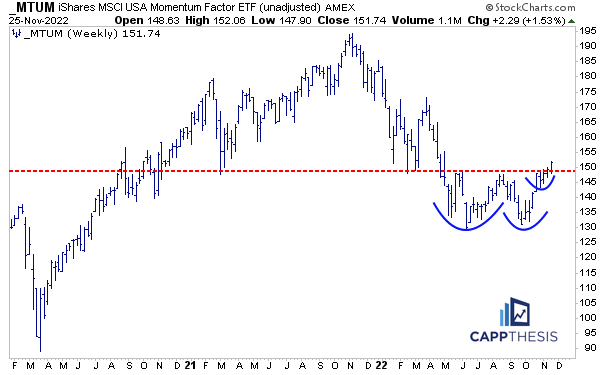
MTUM Momentum was up 1.5% last week, as the ETF extended above the very important resistance point in the high 140s. That zone marked the major breakdown area from May. A continued hold above the breakout would target roughly 167.
Industries
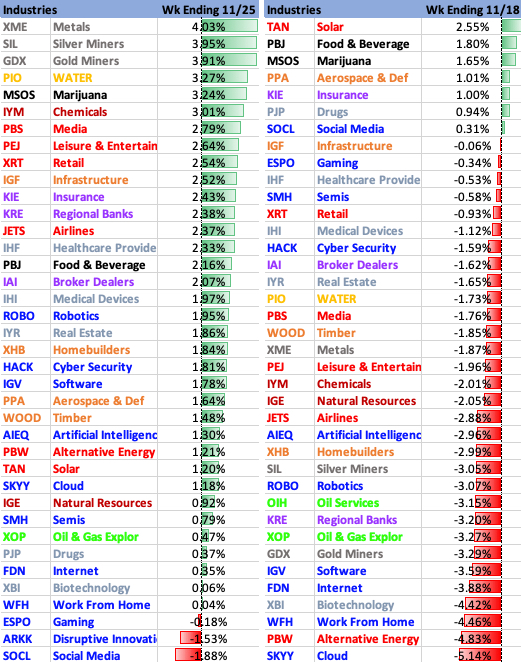
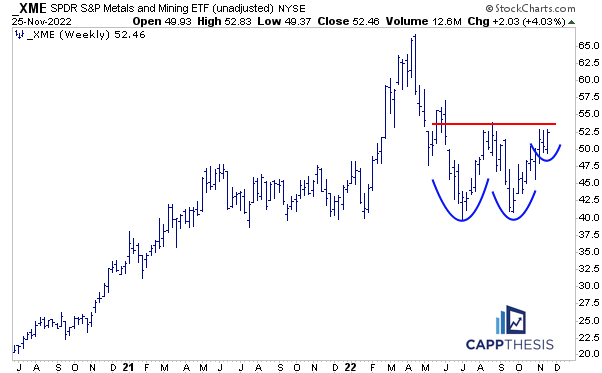
Metals dominated last week, with XME Metals & Mining, GDX Gold Miners and SIL Silver Miners all up about 4%. We commented on SIL and GDX’s bullish patterns last week, and XME also now is close to completing a six-month bottoming formation.
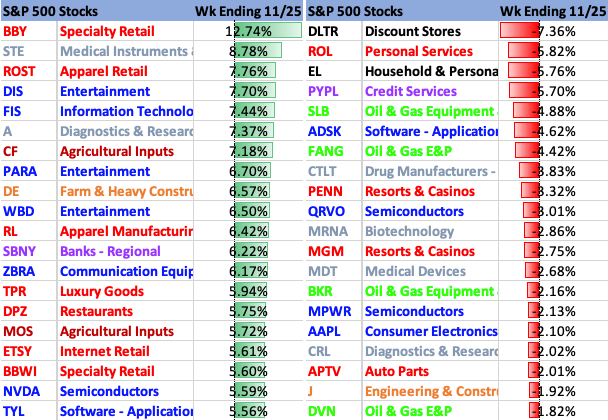
S&P 500 Best & Worst 20
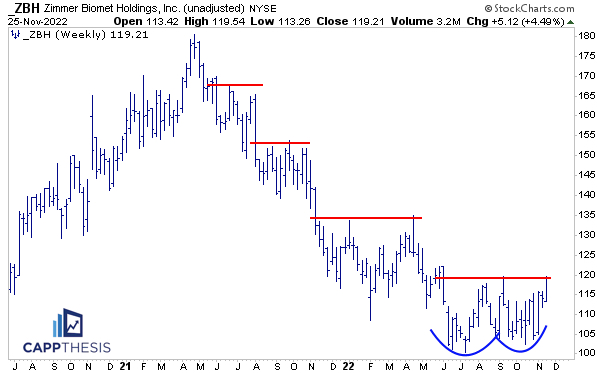
ZBH gained 4.5% last week and closed near its September highs, as the stock is close to completing a potential six-month bottoming formation. We’ve seen multi-week consolidation efforts fail three prior times since spring, 2021, which makes this test a critical one.
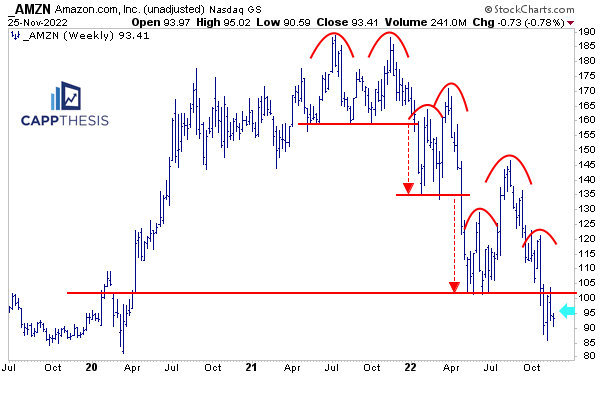
AMZN remains below key resistance after breaking below its third major bearish pattern since 2021. The previous two times, the downside targets were hit. For this time to be any different, it would need to reclaim the 102 zone.
Global Markets
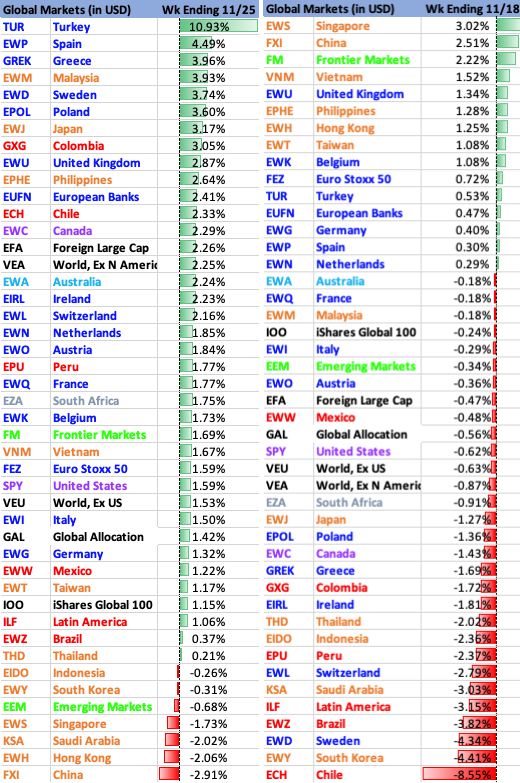
EWD Sweden was near the top of the Global Markets performance list last week, up 3.7%. After the spike two weeks ago, the best-case scenario was some short-term consolidation. That happened with the prior week’s pullback, and now a potential bottoming formation now is clear.
Many other European ETFs are flashing a similar looking pattern.
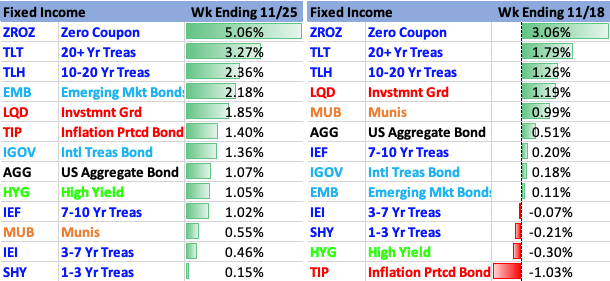
Fixed Income
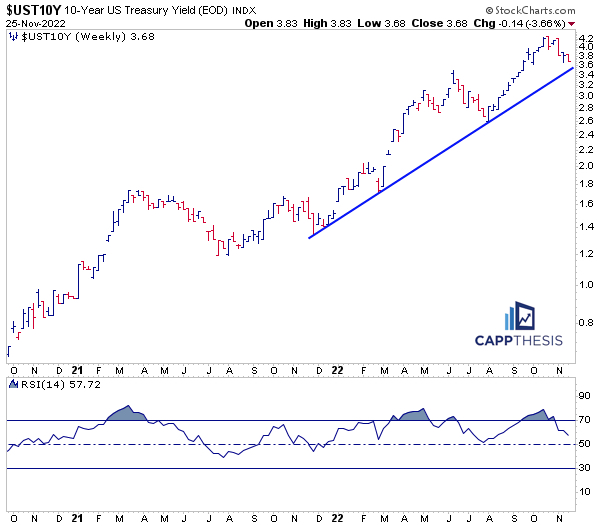
The 10-Year Yield ticked lower again during last week’s shortened trading week, but that didn’t alter its technical state. It remains above the 2022 uptrend line, and its 14-W RSI is still atop the mid-point of its range. In other words, the 10-Year’s key up-trending characteristics have not been violated yet.
Commodities
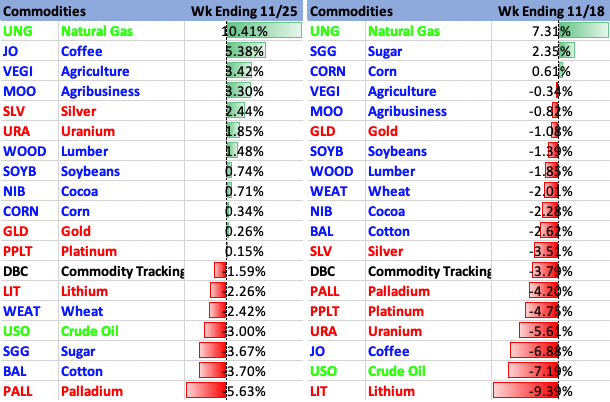
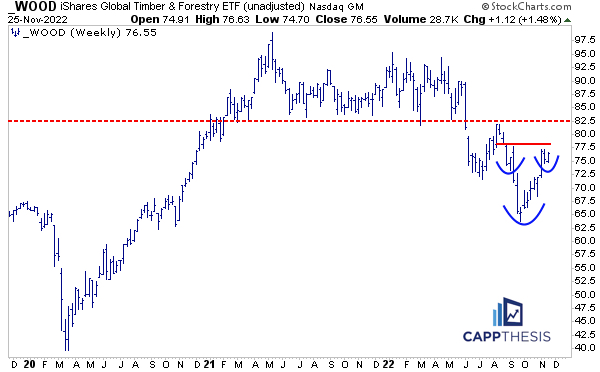
WOOD (Lumber) was up 1.5% last week, as it continues its fight back from the brutal summer breakdown. Like many other charts we’ve reviewed today, it now has formed a clear bullish pattern over the last few months.
That said, its supply zone (which begins near the 82.5 zone) is much more formidable, which could be challenging if/when the ETF gets back up there.
Currencies

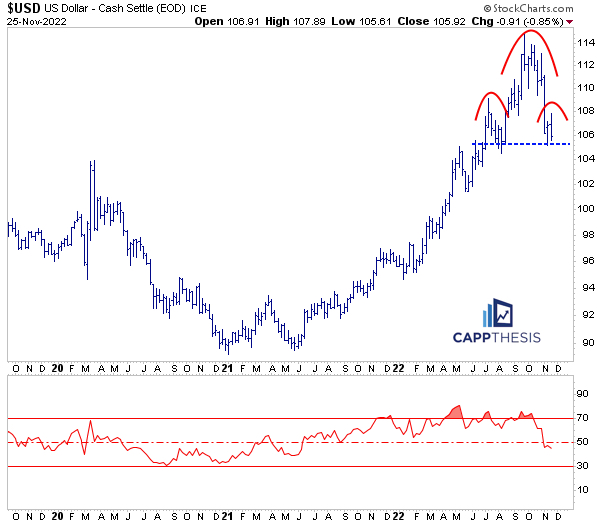
The US Dollar finished on its lows last week but did not undercut the prior week’s low. Regardless, its potential bearish formation is unmistakable. Unlike the 10-Year Yield, its RSI already is below the 50-level, as momentum has reversed a greater clip.
With the Dollar getting closer to the 103-04 zone (where it peaked in 2016 and 2020), it will be facing a major test soon.
Crypto

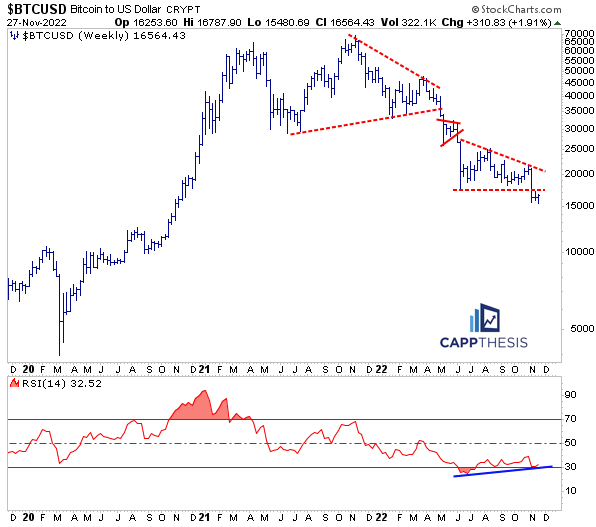
In aggregate, Crypto bounced last week, which, of course, could be a starting point for a bigger snapback rally. For the hold to turn into anything meaningful for Bitcoin, it must reclaim the prior low point (near 17,600) and leverage the slight positive RSI divergence that we discussed last week.
