Topics Covered:
-Weekly Performance
-SPX Weekly Chart
-Pattern update
-SPX: 20-DMA & RSI
-AVWAP
-Weekly Market Map
–Weekly Breadth: SPX, NDX
–Best 20 ETFs: GDX, VIX
–Worst 20 ETFs: IHI
–Major Indices: DJIA, IWC
–Sectors: XLE, XLU
–Style: AMLP, IWO
–Industries: OIH, XRT
–Foreign Markets: VNM, KSA
–Fixed Income: ZROZ
–Commodities: Crude Oil
–Currencies: US Dollar
–Crypto: Bitcoin vs. USD
Weekly Performance
SPX Weekly
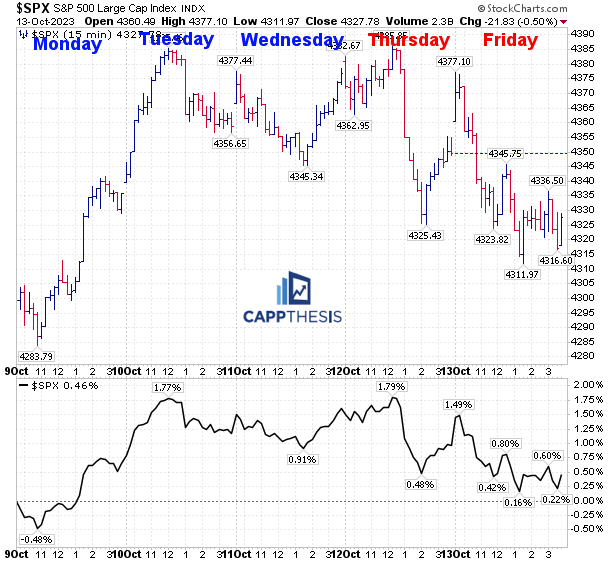
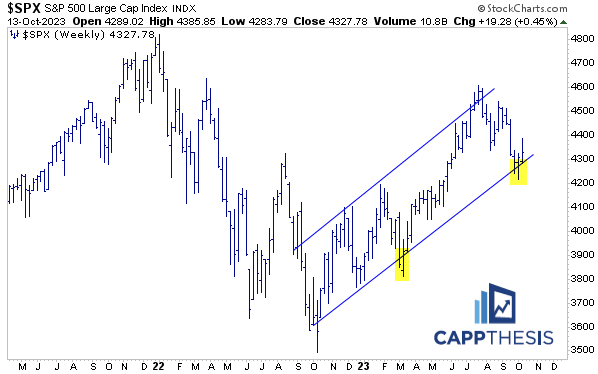
It may not have felt like it, but the SPX logged its second straight weekly advance last week. And for the third straight week, the index tested the bottom of its upward sloping channel, before closing above it.
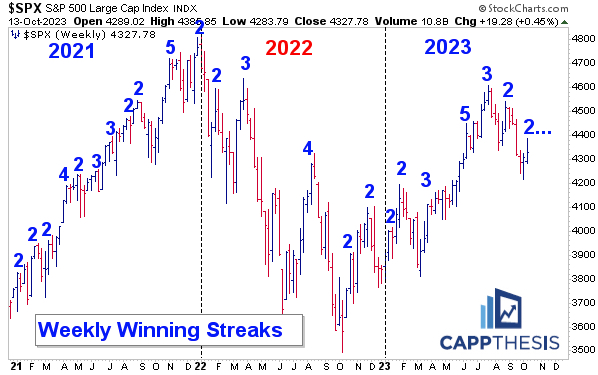
This now is the seventh weekly win streak of 2023, with the last one being two in a row to conclude August. Of course, that was immediately followed by the longest weekly LOSING streak of the year so far (four), a path that the SPX will be trying to avoid this time.
For some context, in 2021, the index had 11 weekly winning streaks; in 2022, it had five.
Short-term
The SPX finished last week right near its short-term breakout point, which keeps the small bullish pattern alive for another day.

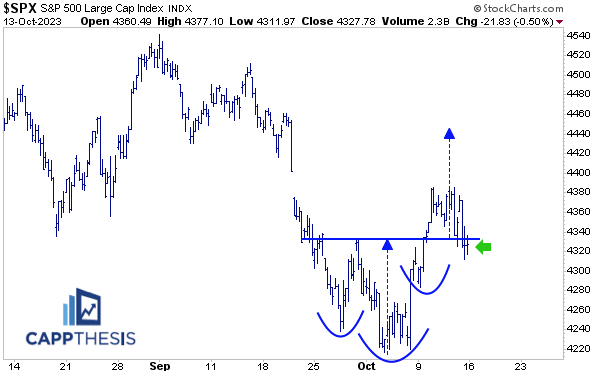
As we know, a quick roll-over from here would reignite the bearish formation, thus, seeing a strong response this week is critical.

SPX: 20-DMA & RSI
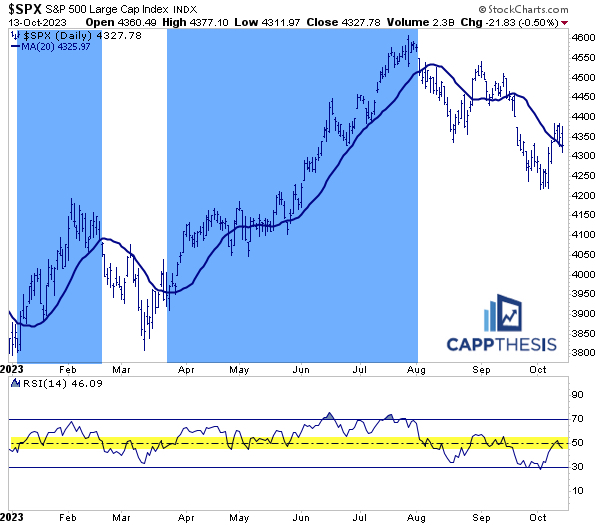
The market’s two best runs in 2023 had two critical traits: The SPX traded above its 20-Day and its 14-Day RSI oscillated between the mid-point and overbought territory.
Currently, the index has been above the 20-DMA for four straight days, which is a START. It spent two weeks above the line from late August through early September but then quickly lost its footing. During that time, the RSI never pushed through 60, which kept a lid on the advance.
That simply will need to change going forward.
SPY AVWAP
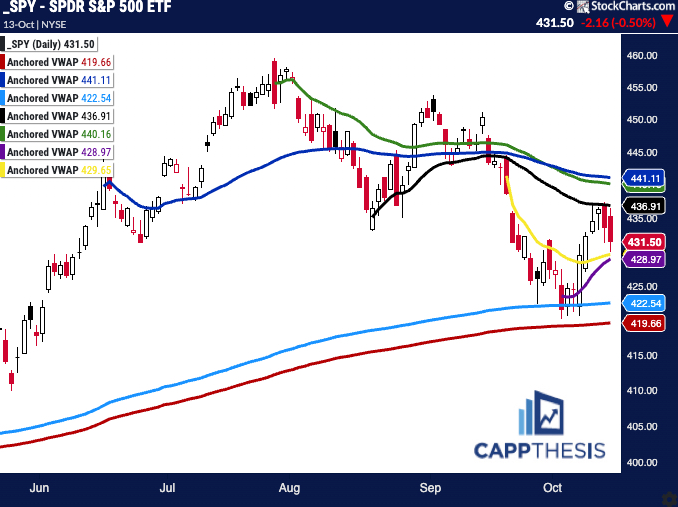
SPY tested and closed below the VWAP anchored to the August low (black) for the fourth straight time on Friday, which remains a significant short-term resistance line.
Red: 1/2/23 – YTD VWAP
Light Blue: 2/3 – Former high point
Purple: 10/03 – Most recent closing low point
Yellow: 9/20 – FOMC Meeting
Black: 8/18 – August low
Green: 7/27 – Key outside negative day (day after FOMC Meeting)
Blue: 6/15 – mid-June high
Weekly Market Map
Breadth
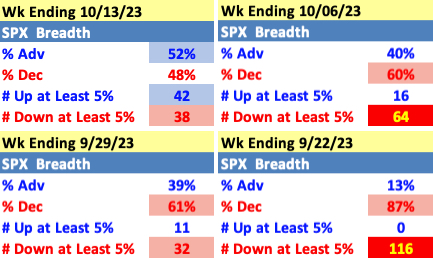
The SPX had positive weekly breadth numbers for the first time since the week ending 9/29, with an equal number of stocks moving +5% and -5%. That said, we haven’t seen more than 60% up stocks week-over-week since the week ending 9/1.
NDX Breadth
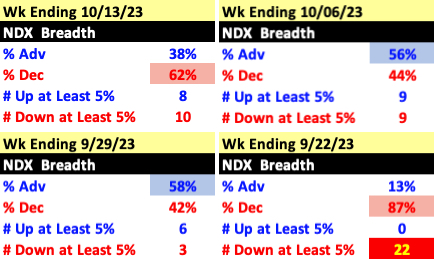
The internals for the NDX, however, were noticeably worse, with only 38% stocks up for the week.
Best 20
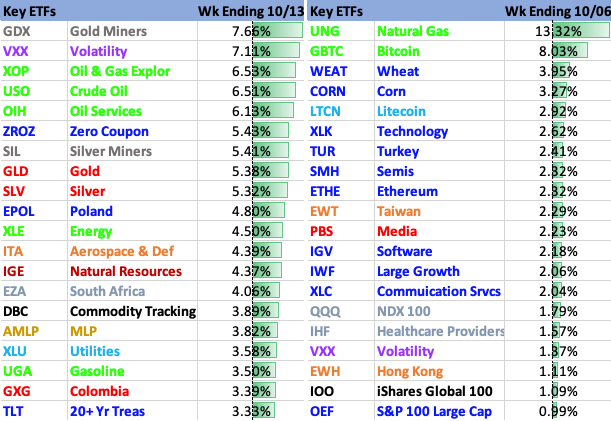
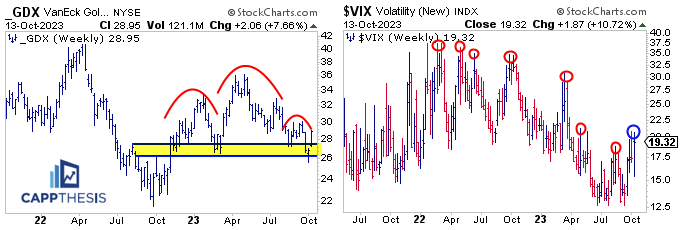
GDX logged its best weekly gain last week since the week ending 7/14/23. That had no follow through back then, as the ETF fell for the next six weeks. With this one coming right after GDX pivoted from a key support area, it will be looking for a better effort now. If that does NOT happen the big topping pattern would come back into play.
The VIX gained 10% last week and logged and notched its highest weekly close since the week ending 3/24/23. Of greater importance, this is the first higher high since late 2021-early 2022.
Worst 20
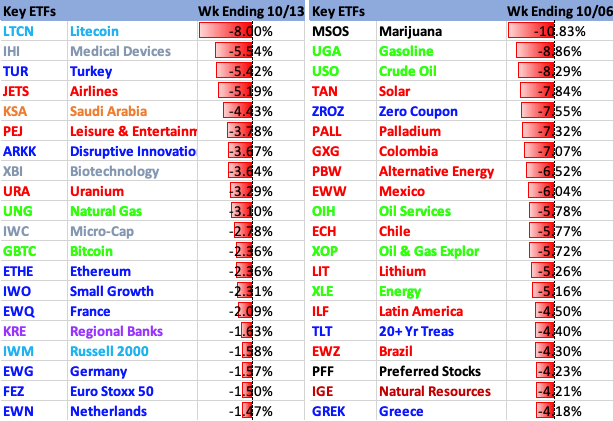
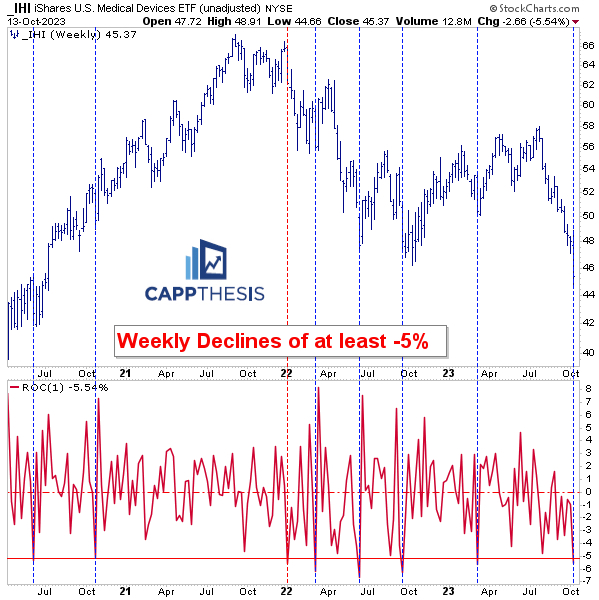
IHI Medical Devices lost over 5% last week for only the second time in 2023. The good news is of the last seven 5% weekly declines since 2020, six times this came close to marking a key trading low. The only time that did NOT happen was in January’22.
Major Indices

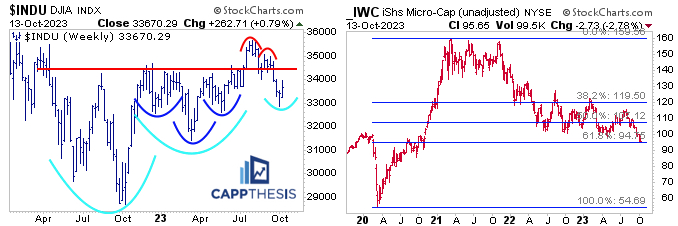
While DJIA outperformed last week, it remains below the breakout zone it fell back below a few weeks ago. That said, by staying above the prior week’s low point, it still has the chance to leverage another long-term higher low now.
IWC Micro Caps made another new 52-week low last week and again closed below the large descending triangle pattern (not pictured). Applying the Fibonacci retracement lines, IWC settled right on the 38.2% mark of its entire 2020-21 advance. That’s support until proven otherwise.
S&P 500 Sectors
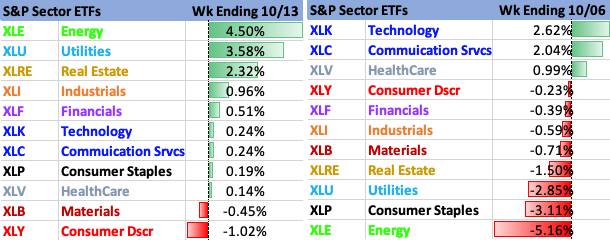
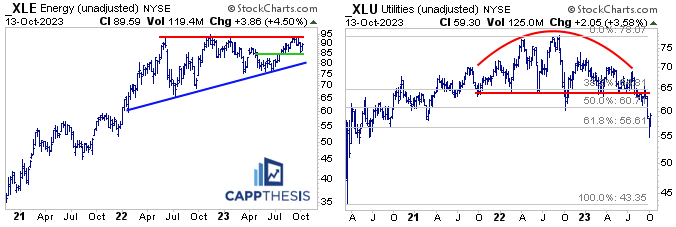
XLE Energy bounced on the short-term support line we discussed last week and now is back with striking distance of potentially breaking out of a multi-year bullish pattern.
XLU Utilities snapped back from one of its worst runs in recent years, respecting the 61.8% retracement level highlighted during the decline. It has more space to rally from here, but the large supply still looms overhead.
Style
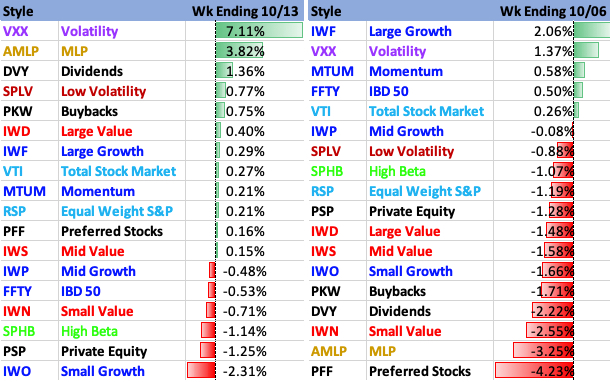
AMLP (MLPs) snapped back last week, as well, and is close to testing a major breakout zone.
IWO Small Cap Growth was the worst ETF on our Style list, as its bearish pattern breakdown continued. It finished the week right on its March lows, which could provide support for a bounce attempt soon.

Industries
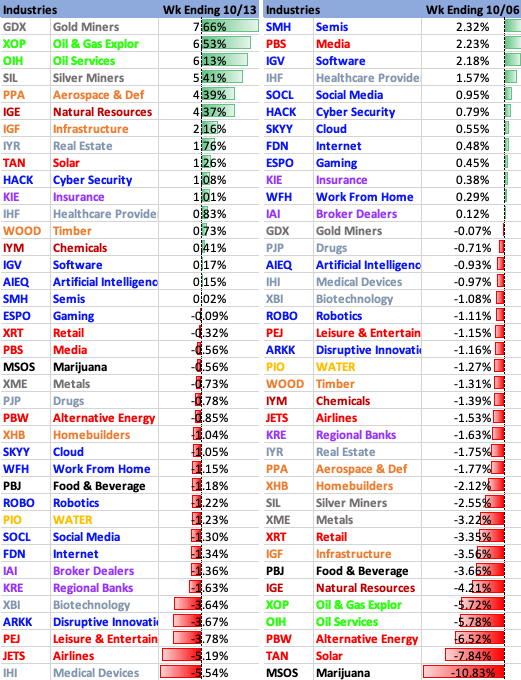
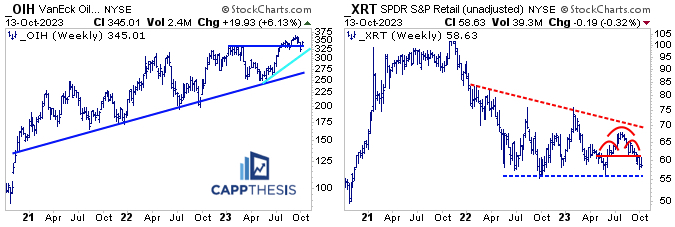
Sticking with the Energy theme, OIH’s strong +6% move last week pulled it back above the late 2022 / early 2023 highs, the zone it broke above earlier this year. It, too, now is close to breaking out again.
XRT Retail was flat last week but given the pictured H&S pattern, we should watch it closely. Next support would be the lows from 2022 and 2023 near 55.
Global Markets
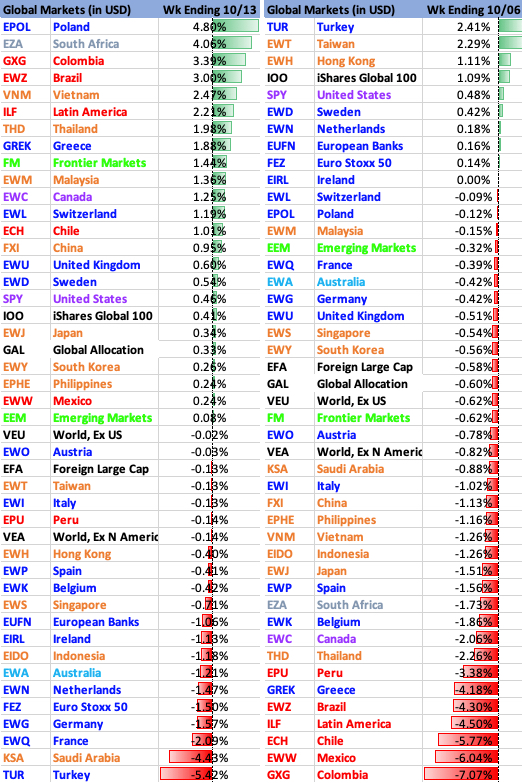
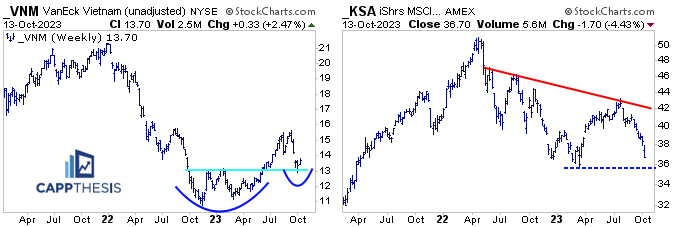
VNN Vietnam was among the leaders last week, as it held above the 13-level, where it broke through this past summer. In doing so, it maintained its series of higher lows, which have been in place since the 2022 low point.
KSA Saudi Arabia fell over 4%, as the decline from early July continued. Needless to say, holding near its 2023 lows now is very important. After that, there will be nothing to key off of from a support perspective.
Fixed Income
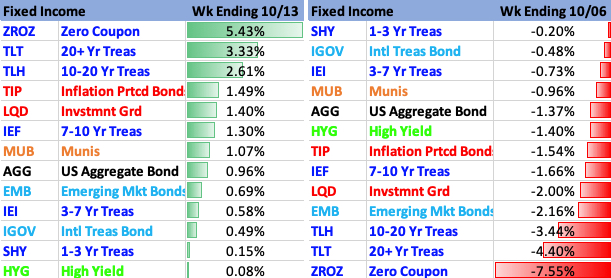
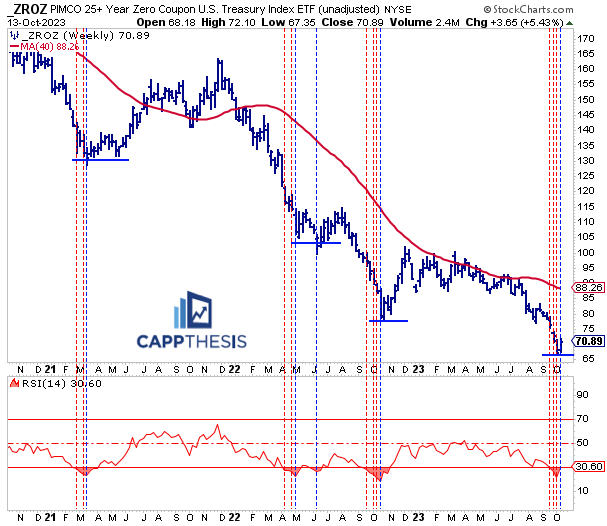
ZROZ Zero Coupon Bonds finally bounced from a deeply weekly oversold condition last week with rates dropping. Profiled here are the last few times it rallied from a similar condition.
Weekly oversold readings lasted for a few weeks each time before a bigger bounce materialized. Some were relatively short-lived (early 2021), while other times, the oversold condition lasted for weeks (Sept-Oct’22). Again, it’s all about the follow through.
Commodities
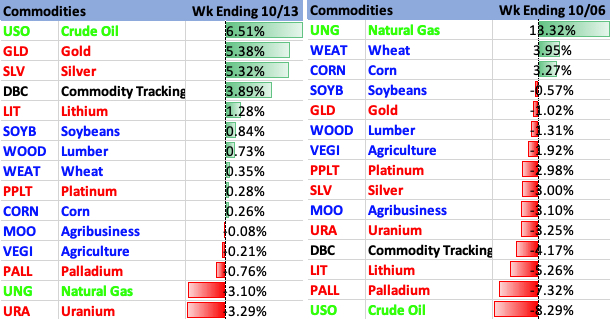
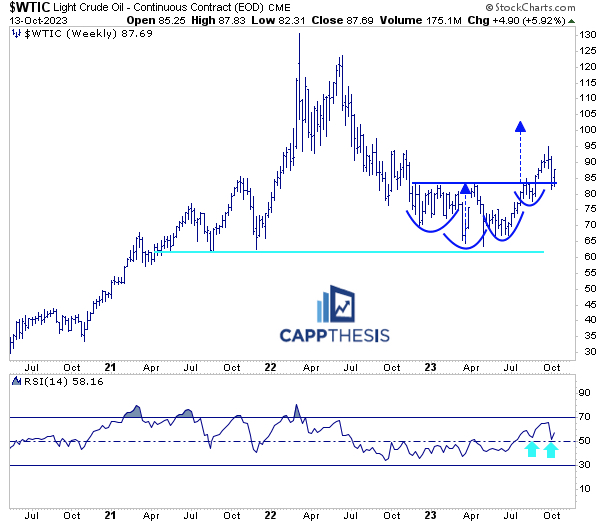
Crude Oil reclaimed its major breakout zone from August last week with the 6% spike. The measured move targets 104.
Currencies

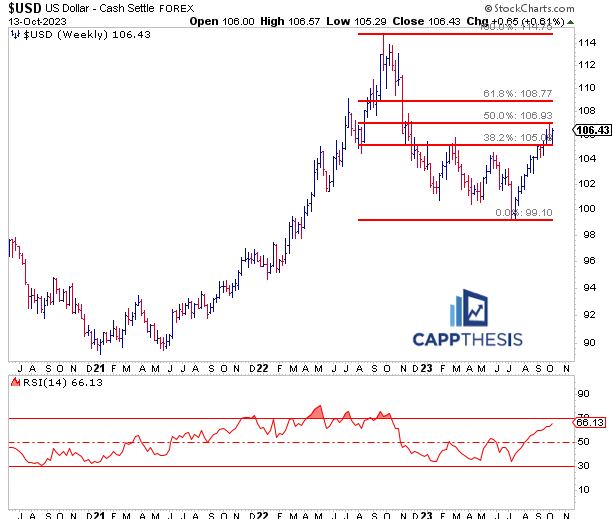
The Dollar bounced last week and is again close to the 50% retracement of the 2022-23 decline (near 107), which remains a key resistance zone.
Crypto

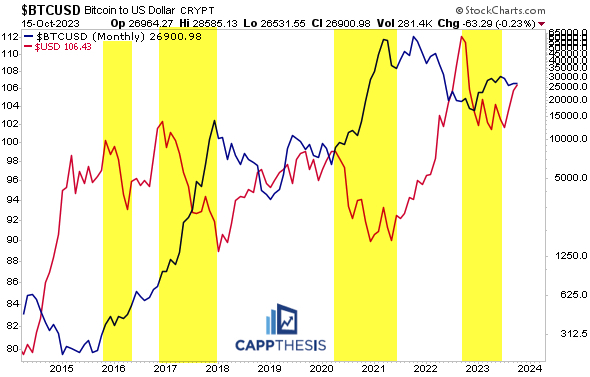
Here’s a chart of Bitcoin and the US Dollar, with the biggest Dollar sell-offs highlighted in yellow. Those times coincided with the best BTC rallies. It’s not a coincidence.
We’ve talked about this before, but it’s clear how negatively correlated Bitcoin is to the dollar and how important a dollar decline would be for BTC’s near-term prospects.
