Key Points:
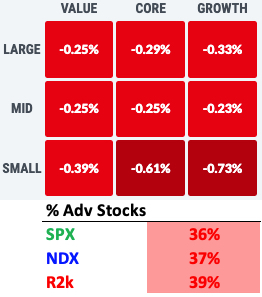
1- Breadth on the index level was poor in the 30-40% range yesterday, but it wasn’t extreme. Our ETF list presented a much grimmer picture, with over 90% ETFs down.
2- We’ve shown the potential path for both bullish and bearish patterns to develop from here. Given the consistent bid over the last four months, the onus remains squarely on the bears to change the narrative.
3– As the SPX’s price level has gotten higher, the pullbacks have gotten shallower. A change is inevitable at some point.
Topics Covered:
-Index breadth
-ETF breadth
-Pattern scenarios
-Drawdowns
-Trading boxes
-SPX vs. trendlines
-SPY AVWAP
-Japan Nikkei 225
SPX:
The first day of August was less than thrilling, but outside of the SPX, things were weaker than they seemed yesterday. We reviewed this in last night’s Last Licks piece.
To briefly recap: while breadth on the index level was poor in the 30-40% range, it wasn’t extreme.
Our 170 ETF universe suggested otherwise:
64 ETFs fell at least 1% on Tuesday vs. just two UP 1%, which was the largest discrepancy between big decliners and advancers in quite some time.
In fact, only 11 that we follow actually finished higher, which painted a much grimmer picture compared to the traditional breadth measurements That’s less than 10%.
Indeed, our list contains ETFs beyond domestic equities, but that’s why it’s so instructive: Stocks, bonds, commodities, currencies (outside of the dollar) and foreign ETFs all got hit hard.

If we had a 90% down day in the NYSE and SPX, the financial press would have been all over it and rightly so.
The obvious question now is whether this will result in anything more than another blip on the radar screen. With no live bullish or bearish formations, the pattern slate is clean and there for the taking.
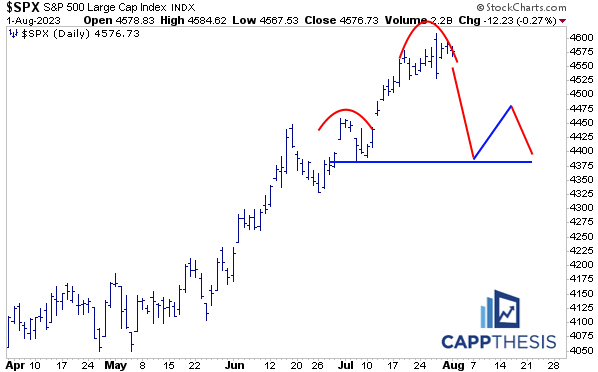
We’ve shown the potential path for both bullish and bearish patterns to develop from here. One side needs to take the reins. Given the consistent bid over the last four months, the onus remains squarely on the bears to change the narrative.
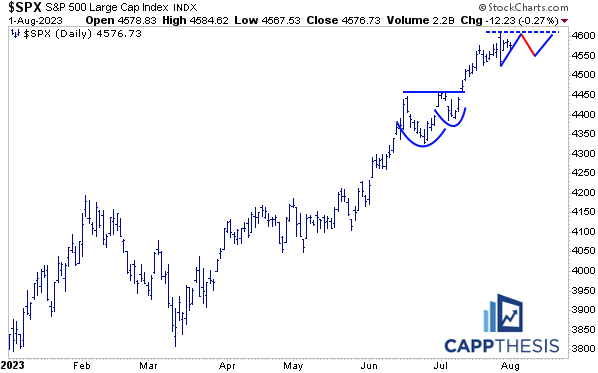
Potential Bullish Pattern
This is clear as can be. A rally back to the recent highs, followed by yet another higher low would complete the latest cup/handle-like pattern. A breakout would then get us to fresh 52-week highs… again.
Potential Bearish Patterns
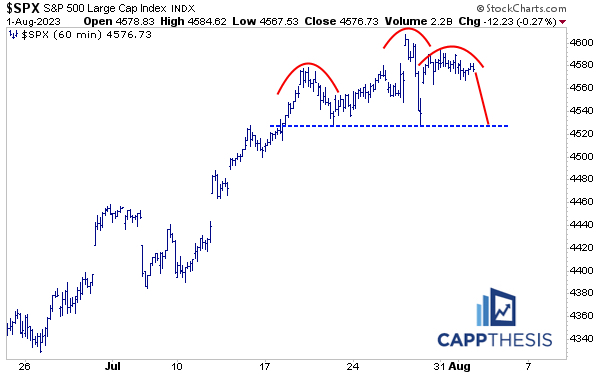
1-Hourly chart
This isn’t the prettiest or cleanest looking pattern, but the general shape is understood. The SPX’s bounce from last Thursday’s negative reversal has not been strong enough to help it reclaim recent highs.
The resultant lower high now could transform into the right shoulder of a short-term bearish head/shoulders pattern. For this to play out, we’d need to see more downside action soon.
2-Daily chart
It would take more time and a lot more weakness for the bigger bearish pattern to work. But the first step would be seeing a real move lower.
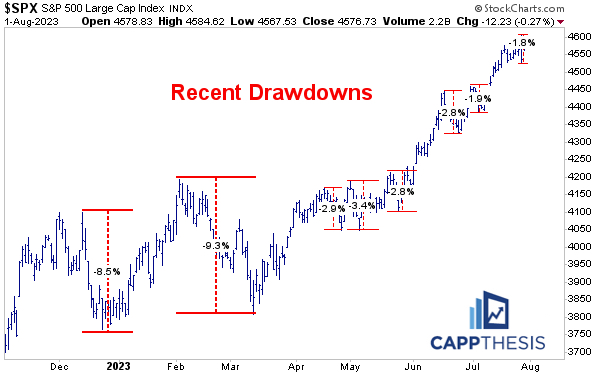
Drawdowns
The biggest drawdown we’ve had since the March lows remains the -3.4% drop from April – May. In fact, as the SPX’s price level has gotten higher, the pullbacks have gotten shallower. A change is inevitable at some point
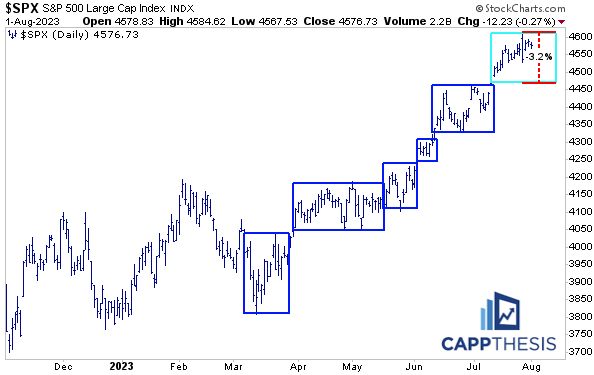
That doesn’t mean a crash is imminent: a simple drop back to the bottom of the recent trading box would equate to a 3.2% decline… and it also would do nothing to alter the behavior over the last few months: breakout, consolidate, breakout, consolidate…
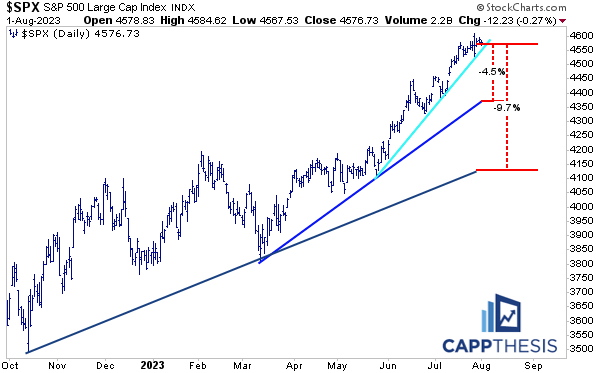
Looked at differently, the SPX continues to flirt with the steepest and shortest trendline we’ve been citing. Simply moving sideways would pull the index below this line. At the very least, then, this would confirm a short-term character change.
And here is how far the SPX would need to drop to reach the other two uptrend lines. Of course, with each line rising every day, these percent moves will lessen going forward, but we get the point.
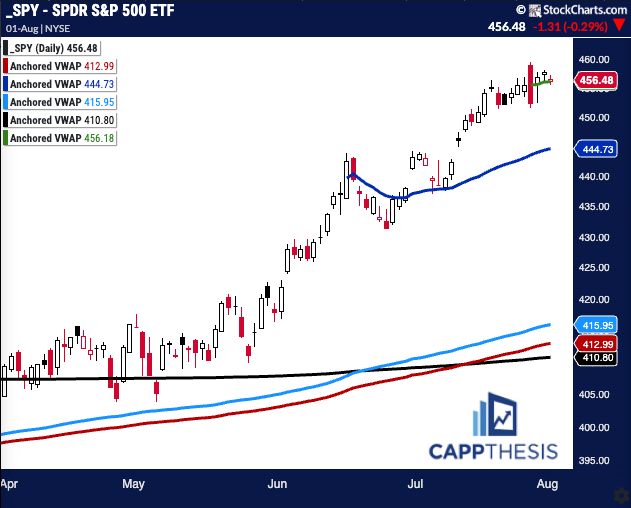
SPY AVWAP
SPY’s VWAP line anchored to last Thursday now is at 456 , and so far it remains key short-term resistance.
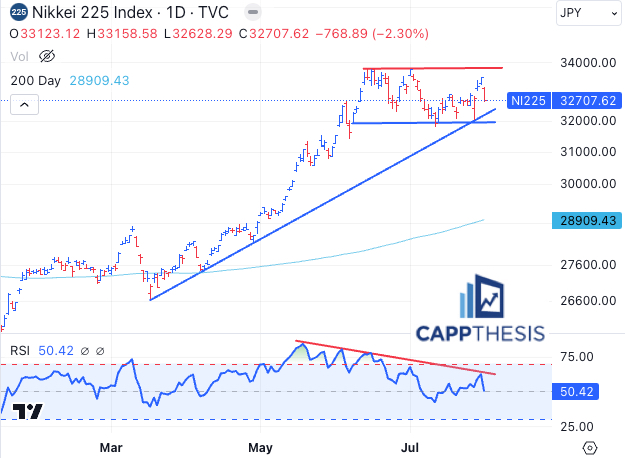
Japan
The Nikkei 225 continues to trade within a, now, 6-week trading range. We’ve highlighted both potential bearish and bullish patterns over the time, but there’s been no follow through to either side yet.
For now, the uptrend still is in play, but for that to remain in place, another bid will need to appear soon.
Also note the falling RSI indicator. So far, this hasn’t negatively affected price action, but we should keep on our screens if things worsen.