Key Points:
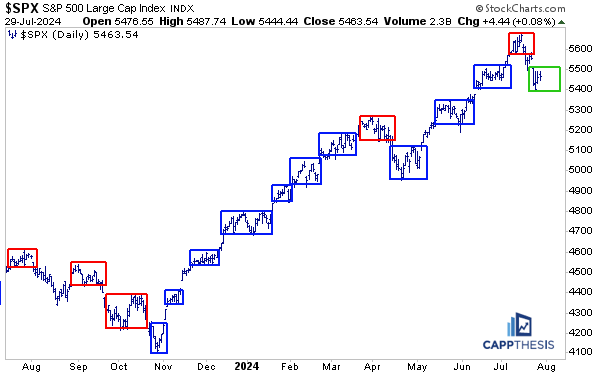
1- The last time the SPX had two straight trading box breakdowns was last August and September.
2- The SPX has traded below its 20-day moving average for four straight sessions, the second longest span since last October. In April, the SPX spent 17 days under the line before finally clearing it on May 3rd.
Topics Covered:
Market
-Trading boxes
-SPX vs. 20-dma
-Rallies & drawdowns
-Short-term
-Live patterns
-Potential patterns
-AVWAP
Daily Stats
-Daily price action
-Index breadth
-Sector performance
-Best & worst ETFs
Key Charts
-KIE
-XLRE
-KRE
Intra-day
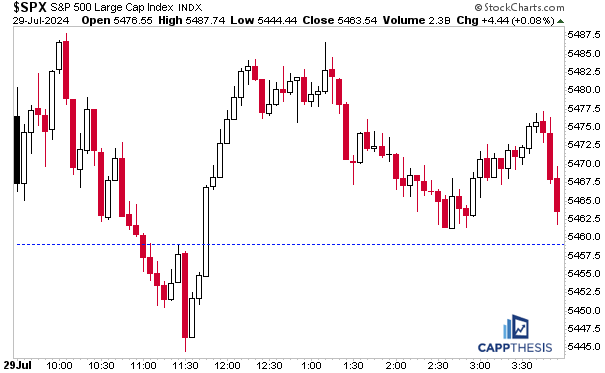
With four of the world’s biggest companies reporting in the next few days and the Fed decision tomorrow, yesterday’s tiny move didn’t shock anyone. So, with the needle not moving for the SPX on Monday, it’s a good time to review a few key charts that may look a lot different in the back half of the week.
Trading Boxes
As we know, the latest pullback created a trading box breakdown for the first time since April. Like then, another trading range now has formed. In hindsight, the May breakout looks like a layup.
But it wasn’t that easy (it never is). That initial bounce from the April lows was doubted by many, and it took that legitimate box breakout in May to negate what looked like a potentially nasty bearish head & shoulders pattern.
While we wait for the potential bearish and bullish patterns to mature (see the potential patterns section below), we could get a heads up on the market’s next direction by the next box break. As the chart clearly shows, the last time we had two straight trading box breakdowns was last August and September.
SPX vs. 20-DMA
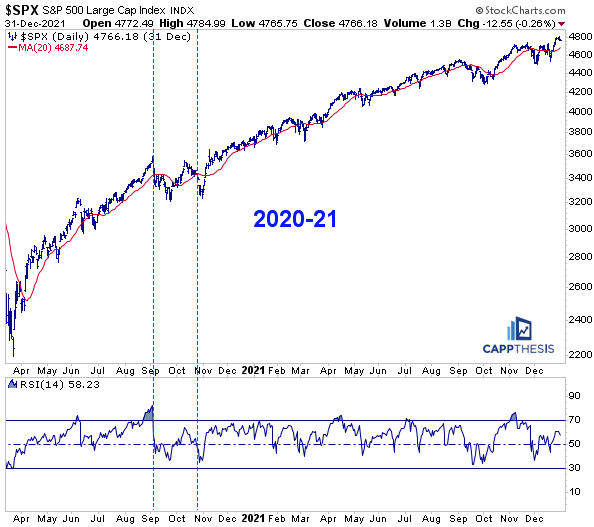
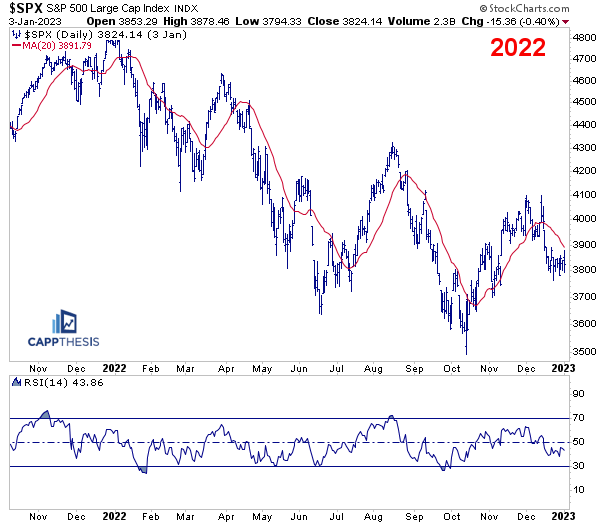
The SPX has traded below its 20-day moving average for four straight sessions now. That’s not a long time by any means, but it’s the second longest span since last October. In April, the SPX spent 17 days under the line before finally clearing it on May 3rd. This may not seem like a big deal but seeing how the SPX does vs. the 20-DMA has been quite telling the last few years…
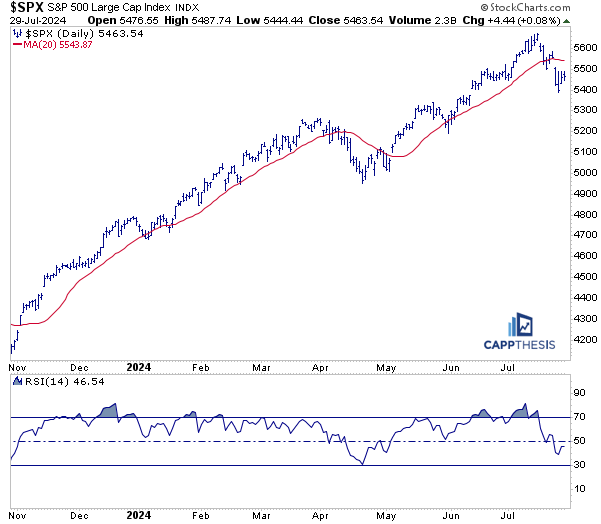
From 2020-21, the SPX rallied soon after undercutting the line nearly every time. The two biggest outliers were in September and October’20.
In 2022, however, it was a different story…
Rallies & Drawdowns
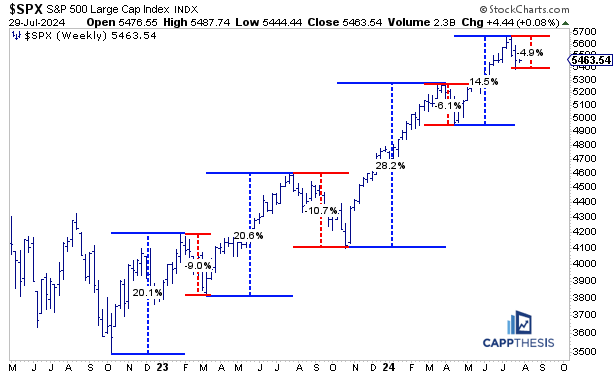
While the near-5% drawdown hasn’t been harsh, it has come after a 14.5% advance. In other words, the SPX has given back a third of the prior extension. By contrast, the prior 6.1% pullback happened after a 28% rally. That drawdown was a lot smaller by comparison, but the market deemed it enough to resume the long-term uptrend. Of course, the SPX is coming off a higher level now, but it’s something to consider if nothing else.
Short-term
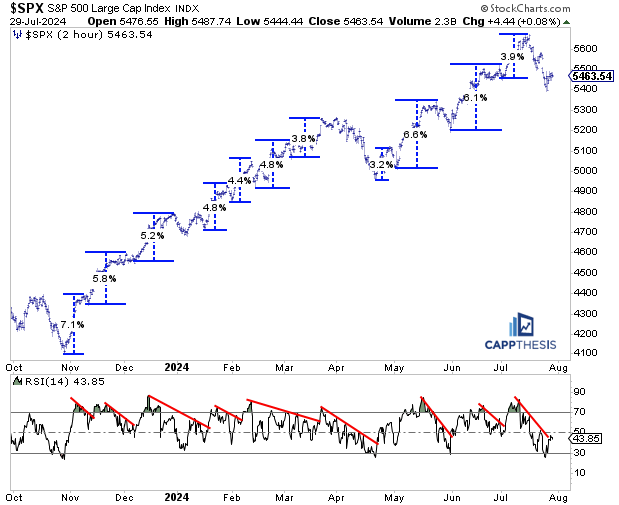
The quick drop has put the SPX’s short-term RSI back to oversold territory, which has spurred multi-week bounces in the past. As we often say, if that does NOT happen again this time, it will be telling.
Live Patterns
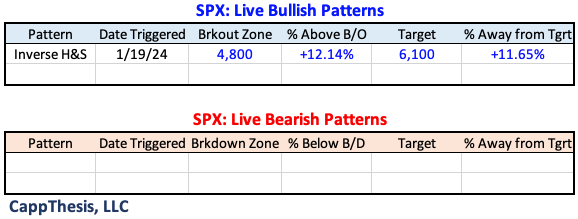
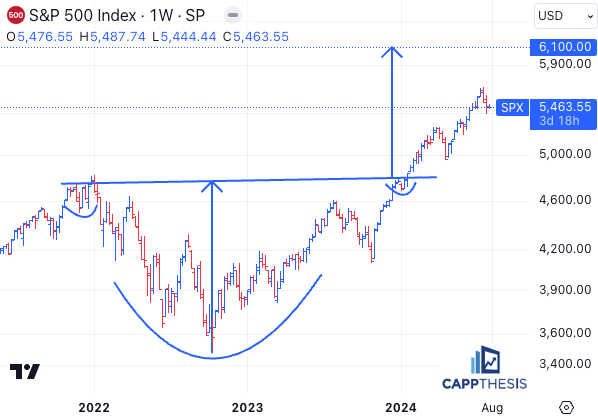
The only live pattern remains the big one… 6,100-target.
Potential Patterns
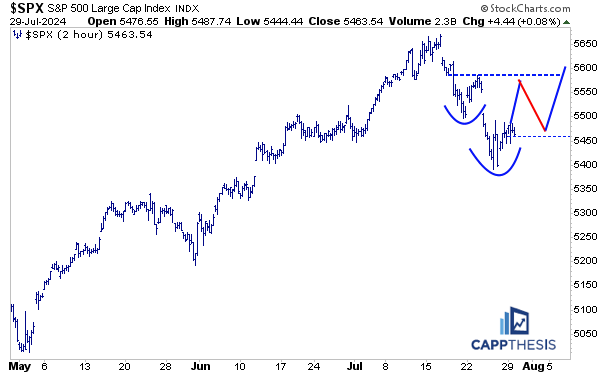
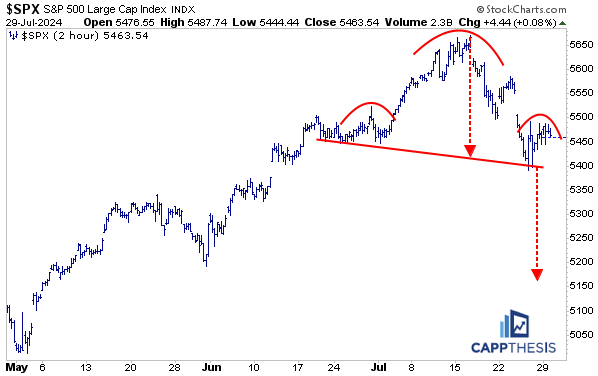
Both the potential bullish and bearish patterns remain viable.
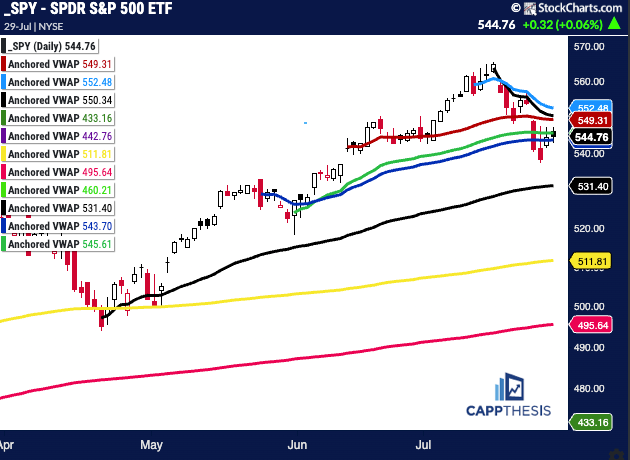
SPY AVWAP
SPY continues to battle various VWAP lines.
Black: 8/18/23 – August low
Light Blue: 7/11/24 – CPI/negative reversal
Red: 6/12/24 – CPI/FOMC
Green: 5/31/24 – Pivot low
SPY
Blue: 5/23/24 – Pivot high
Black: 4/19/24 low
Yellow: 1/2/24 – YTD VWAP
Pink: 10/27/23 – October’23 low
Light Green 3/13/23 – March Low
Purple: 1/4/22 – 2022 high
Green: 10/13/22 – 2022 low
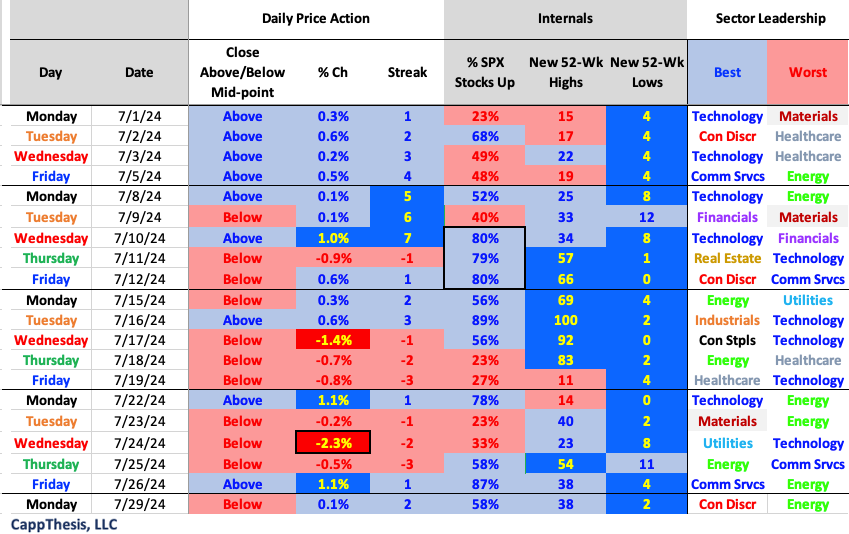
Daily Price Action
The SPX has logged three straight positive breadth days, rebounding from four negative ratios in the prior five.
Breadth
The R2k took a notable break yesterday and logged its second sub-30% day in the last four trading sessions.

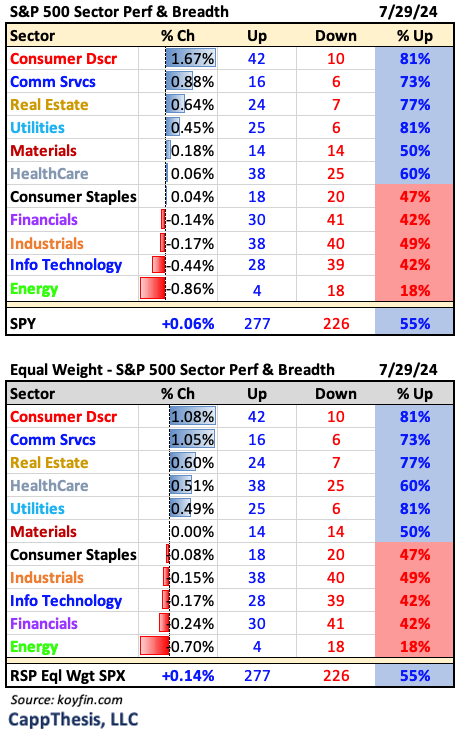
Sector ETFs
Consumer Discretionary and Utilities both had more than 80% stocks advance on Monday.
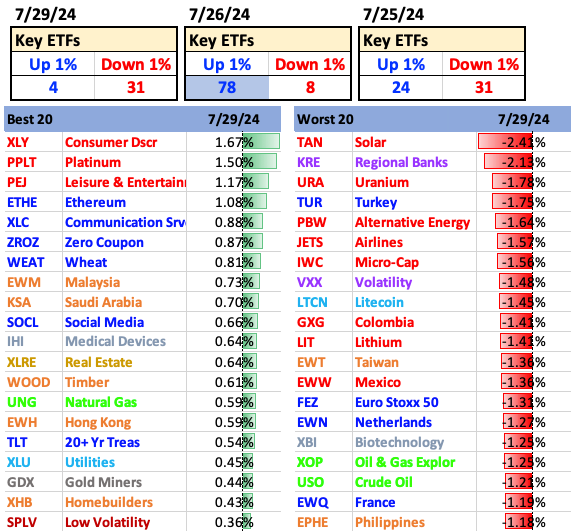
Best and Worst 20 ETFs
Under the surface, there were a lot more 1% declines vs. gains.
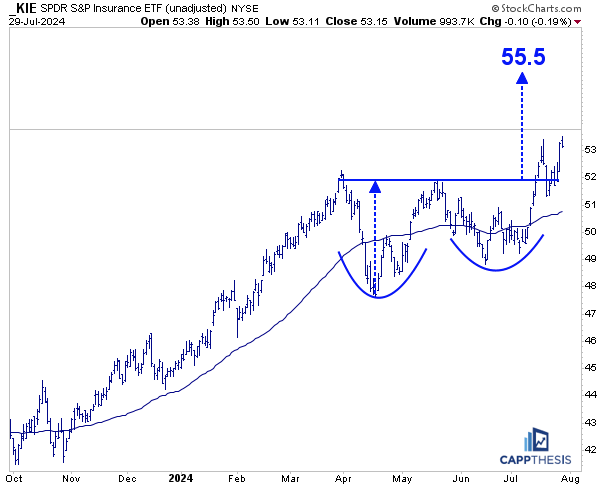
KIE Insurance
KIE made a marginal new all-time high on Monday before finishing lower on the day. The recent bounce helped re-trigger the bullish pattern breakout that yielded a target of 55.5.
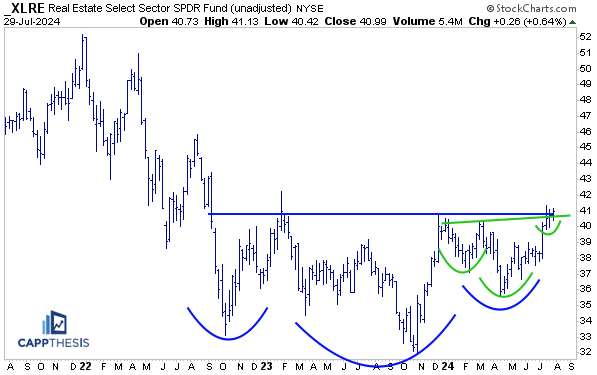
XLRE Real Estate
XLRE continues to hold near resistance from the last few years around the 40-41 zone and now is close to completing two bullish chart patterns.
KRE Regional Banks
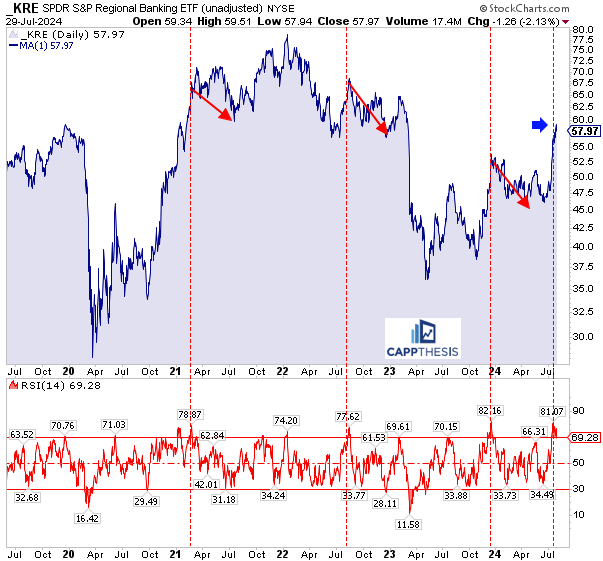
KRE turned lower yesterday after making another new 52-week high. It may not feel like it, but this was KRE’s third 1% loss since 7/17. So, while there’s been spotty profit-taking, the prior two big down days did not result in any downside follow through.
With the ETF now just barely under the 70-overbought threshold for the first time since 7/10, a longer pause clearly is due. Here’s the chart we showed a few days ago when the RSI hit 80 for the first time
