Key Points:
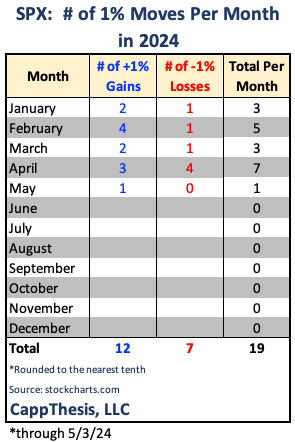
1- The SPX logged its first 1% gain of May on Friday, which makes it four +/-1% moves in the last nine days – a very high percentage of big moves in a short amount of time.
2- The SPX needs to accomplish three important steps to fully return to its uptrending ways. See below.
3- The MACD buy signal officially was triggered on Friday.
Topics Covered:
Market
-1% moves
-3 important next steps
-MACD buy signal triggered
-Live patterns
-Potential patterns
-AVWAP
Stats
-Daily price action
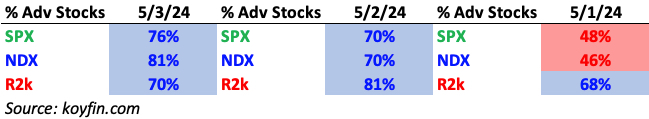
-Index breadth
-Sector performance
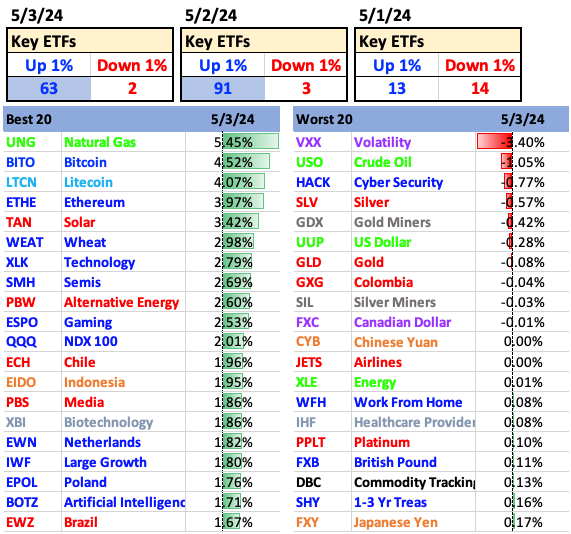
-Best & worst ETFs
Key Charts
-US Dollar
-Nikkei 225
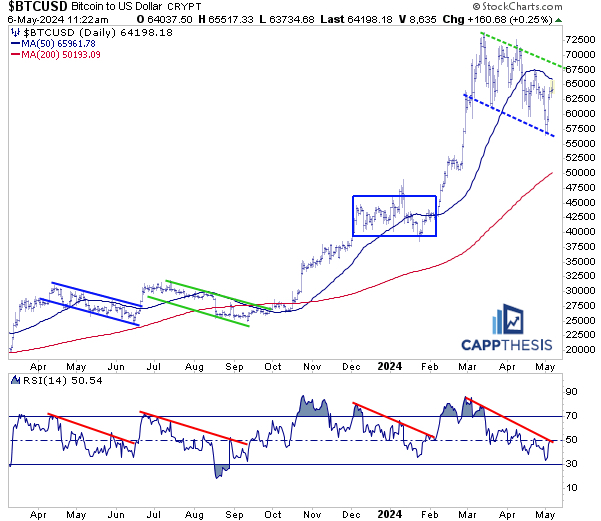
-Bitcoin
-Silver
SPX:
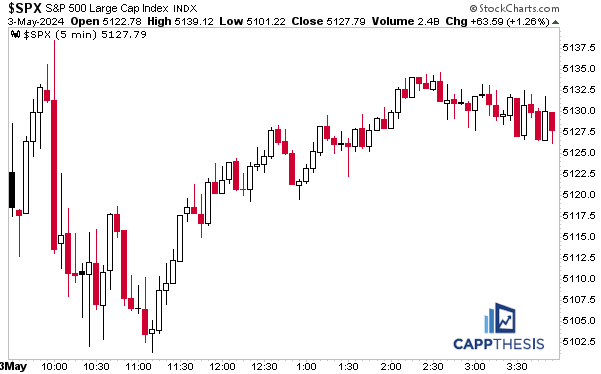
The SPX capped off last week’s data-packed five days with its best gain since February 22nd on Friday. The near 1.3% advance was, thus, also its first 1% gain of May.
1% Moves
We haven’t had two straight months of at least seven 1% absolute moves since the 15-straight from Jan’22 through March’23, which we talked about on Friday. And while the market didn’t decline that entire time, whipsaws were rampant, which made it difficult to trust breakout attempts.
The opposite happened from April-July’23 and from November’23 – March’24, when the number of 1% moves lessened. We talk about this a lot with good reason. If/when breakouts to start to appear again, we’d prefer to see them happen in a boring trading environment. Quite simply, that’s when they have the best chance of being successful.
Three Important Next Steps
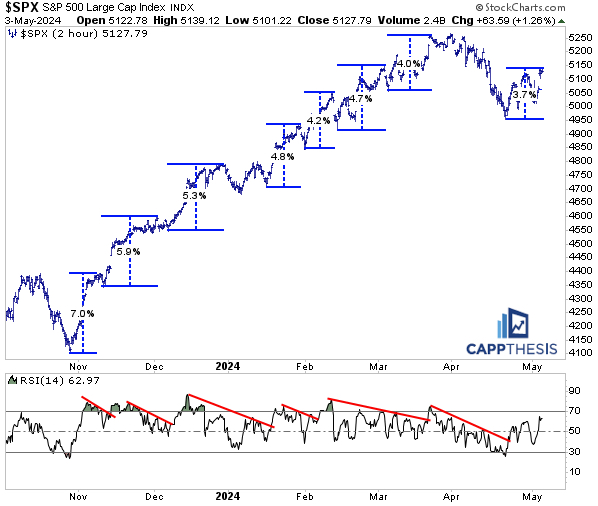
The SPX’s gain from the 4/26 low now stands at +3.8% – still less than any of the rallies from the prior multi-month extension. But it’s getting closer. Each of those previous bounces shared these three important characteristics:
1- Each one totaled at least +4%.
2- Each advance was strong enough to produce an overbought reading in the 14-period RSI on the two-hour chart.
3- The SPX made a higher high vs. its most recent short-term high.
So far, the current bounce has not accomplished any of these three. As we can tell, it won’t take much additional upside to achieve points one and two. But it will take a good amount of upside follow through to reclaim the March highs. Overall, the index would need to gain an ultimate +6.25% from its low.
This may not happen immediately from here, and more patterns may need to develop along the way. But any failure to get back above the March highs would be a lower high, which last happened during the corrective period from last fall.
MACD Buy Signal Triggered
The MACD buy signal that we anticipated after the SPX began to bounce officially was triggered on Friday. We’ve discussed this a few times already, but it’s clear how well MACD buy signals worked from March’22 through March’23. Over that time, six straight buy signals led to strong bounces in the weeks that followed – bear market rallies included.
As is shown by the red lines, the signals did not work in August and early October last year, though. And given that this is the first rally attempt off of the preceding 6% sell-off, we can’t ignore those recent failed attempts.
For now, though, it’s bullish that enough strong price action has taken place to at least produce the signal. The first real dip was bought. Now we need a better follow through effort than last fall.

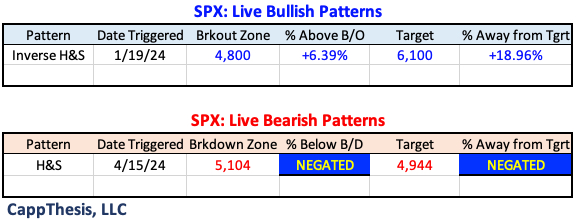
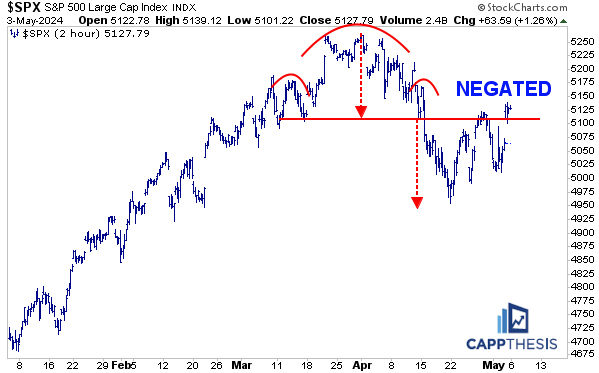
Live Patterns
The small bearish pattern officially was negated with Friday’s big advance. Like we saw in the fall, another one could materialize utilizing the same price action. We’ll be watching.
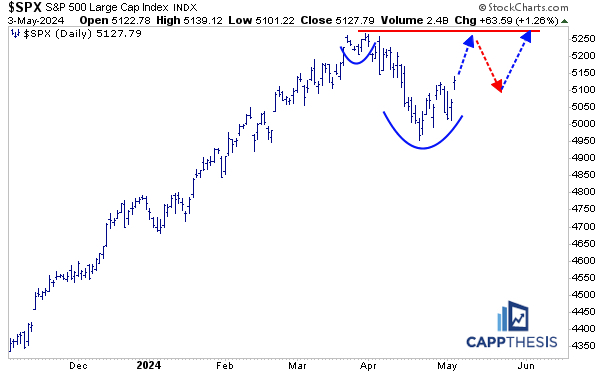
The big bullish pattern remains in play.

Potential Patterns
The potential multi-month top remains viable but pushing much higher above the 50-day moving average would severely challenge its structure. For the pattern to be triggered soon, we’ll need a close below the 4/19 low of 4,953.

Here’s an update on the potential bullish pattern. It remains in play.
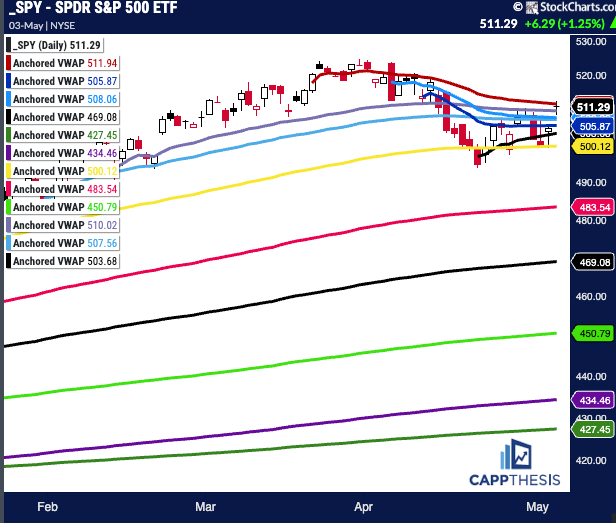
SPY AVWAP
SPY overtook each VWAP line except for the one tied to the 3/20/24 FOMC meeting with Friday’s strong advance.
Red: 3/20/24 – FOMC
SPY
Light Purple: 2/13/24 – CPI
Light Blue: 4/4/24 –negative reversal
Light Blue: 1/31/24 – FOMC
Blue: 4/10/24 – CPI
Black: 4/19/24 low
Yellow: 1/2/24 – YTD VWAP
Pink: 10/27/23 – October’23 low
Black: 8/18/23 – August low
Light Green 3/13/23 – March Low
Purple: 1/4/22 – 2022 high
Green: 10/13/22 – 2022 low
Daily Price Action
The 29 new 52-week highs from Friday were the most since 54 on 4/4/24.
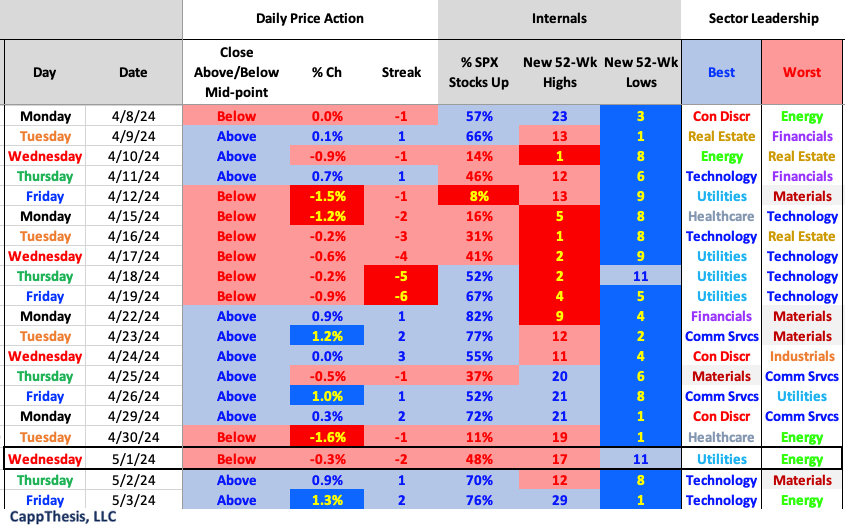
Breadth
Each of the major indices now have logged two straight days of 70% breadth.
Sector ETFs
Five S&P 500 sectors had at least 80% breadth readings on Friday, with Materials having the best ratio (89%). Performance-wise, Tech led for the second straight day.

Best and Worst 20 ETFs
As we know, Large Cap growth did the best overall.
US Dollar
The Dollar’s pullback last week was a tailwind for risky assets, but on Friday, it finished off its lows. That kept it above the critical 104.7 zone, which means the two bullish patterns remain alive.
Quite simply, eventually undercutting that area would negate both formations and produce a potentially major shift. It also would make the sell-off from last week appear like a true top. Not yet…

Nikkei 225
The Nikkei remains in a similar position as the SPX, having bounced from its recent point before hitting a downside target. It’s further away from its own 50-day moving average though, which is a necessary resistance line it needs to reclaim for any bounce to be trusted

Bitcoin
Here’s an updated daily chart for Bitcoin. Lower highs and lower lows continue despite the strong bounce over the last few days. That will need to change at some point if a visit (and breakout) to new highs is in the cards. However, the recent price action also can be perceived as a potential bullish falling wedge pattern.
Going back to last spring, BTC has undergone a series of explosive moves, but each of them was preceded and followed by multiple months of digestion. Those came in the form of either falling wedges or volatile sideways movement, as depicted below.
Indeed, the price swings have been more severe this time, but that’s what happens as it continues to advance – the price levels get bigger.
Also, each prior time, we saw overbought levels (sometimes VERY overbought) fade and get to close, or under, 30 before the next up leg took hold. That happened again this time.
The blueprint is there.
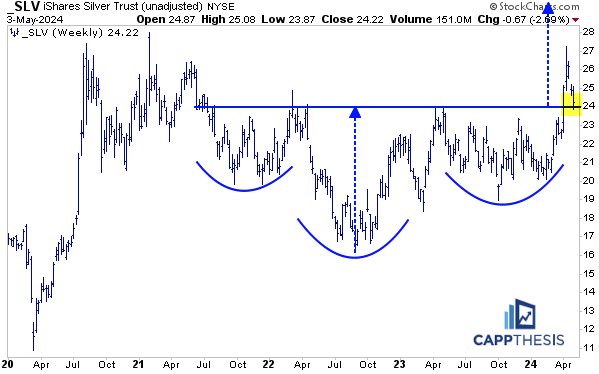
Silver
Silver pulled back to the breakout zone from a few weeks ago through last week, which makes this an opportune time and place to potentially see demand return.