The Underperformers

The Underperformers

The Underperformers

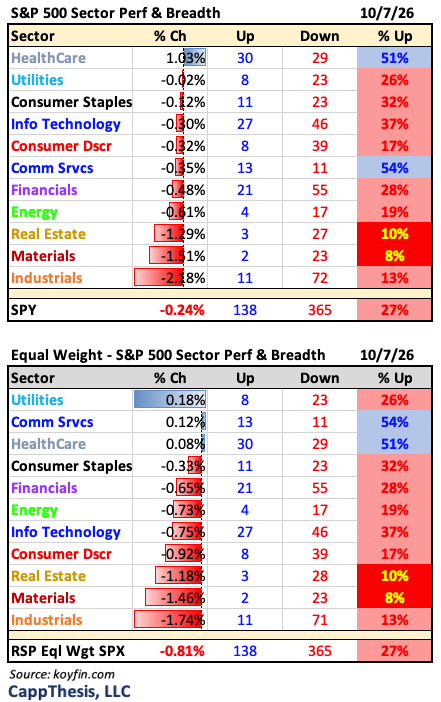
The SPX’s four-day winning streak ended yesterday with a marginal 22-basis-point decline. Its four-day streak of positive breadth also came to an end, as many of the market’s recent underperformers once again struggled. Today’s piece will examine a handful of these relative-weakness ETFs to help us gauge the broader market’s risk.

Daily Price Action
 

The 27% advancing stocks yesterday was among the lowest readings of the past month. While we would have liked to see the streak of positive internals continue beyond four, the key now is to avoid another prolonged period deterioration in participation, especially after the solid rebound in breadth we saw as October began.
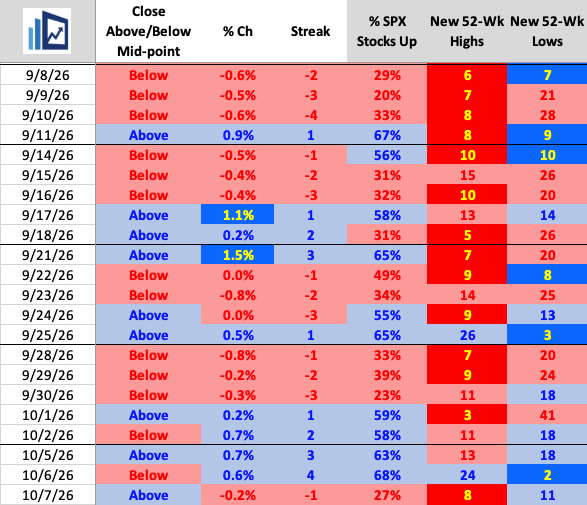

Healthcare was the only sector to advance yesterday, while it and Communication Services were the only two sectors to register positive breadth, with both readings just marginally above 50%.
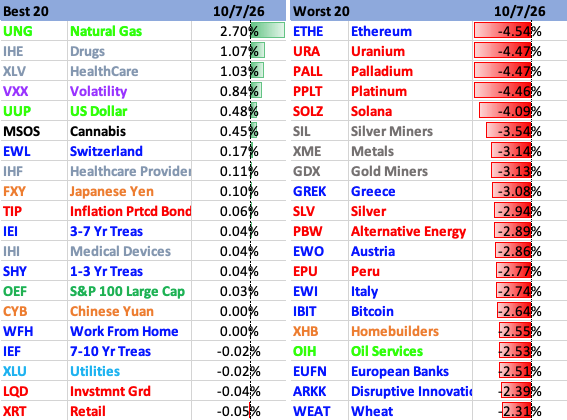
Although the SPX declined just 22 basis points, the damage was considerably more pronounced elsewhere. Looking at the top and bottom 20 ETFs in our universe, only one advanced more than 2%—Natural Gas—while roughly 25% of the decliners fell more than 2%. Metals were among the hardest hit, but the weakness was widespread, highlighting the deterioration outside the SPX itself.
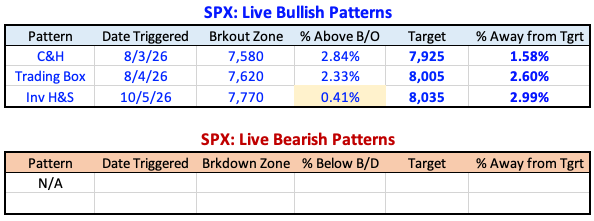
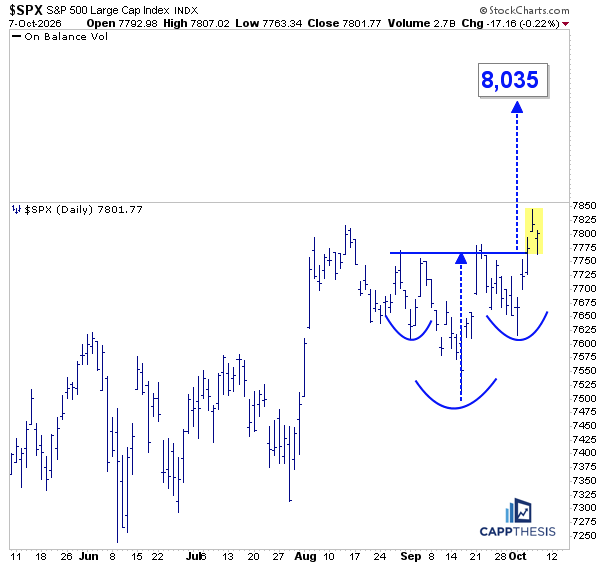
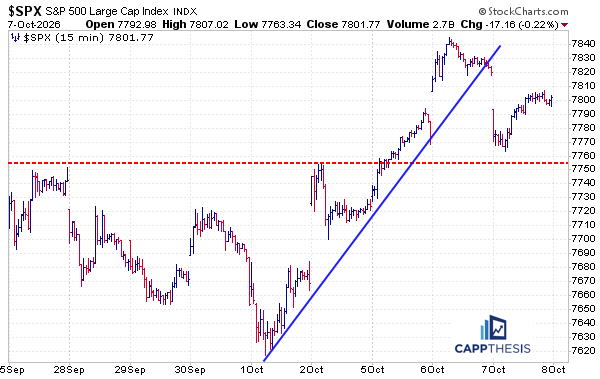
Despite the modest decline, none of the index’s bullish patterns were affected. We’re highlighting the most recent breakout here, as it remains the most vulnerable to being negated if yesterday’s weakness intensifies. So far, the SPX has closed above the breakout zone for three consecutive sessions, with yesterday’s intraday rebound preventing that area from being violated.


XLI Industrials

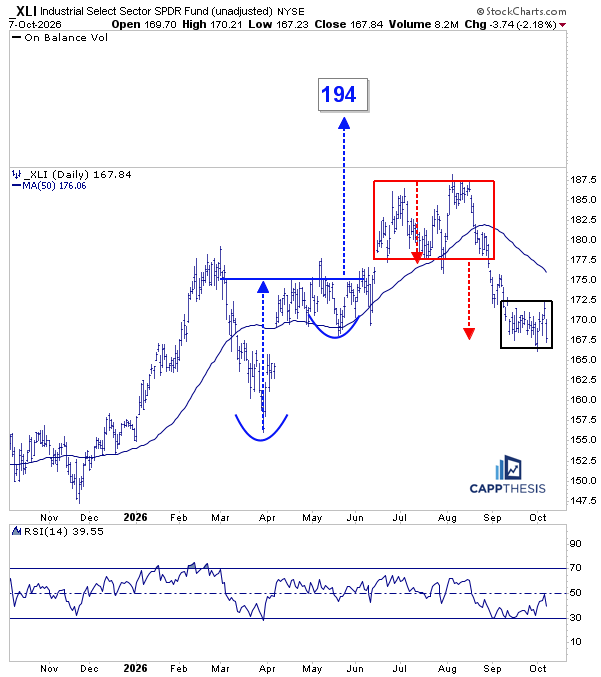
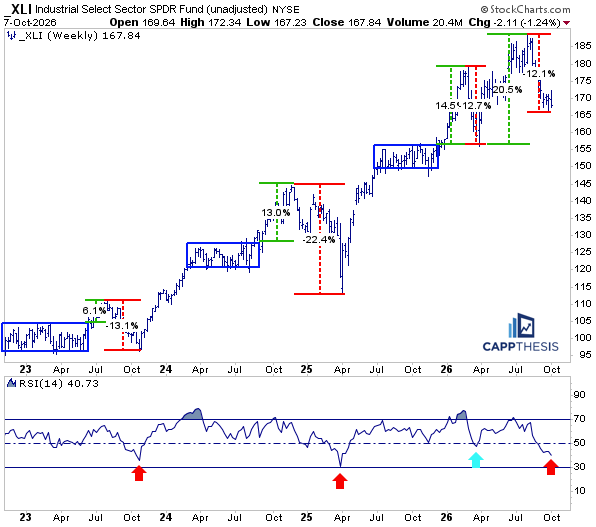
XLI was the worst-performing sector yesterday, declining 2%. As we know, this group has struggled since late July, when it broke out to new all-time highs and was among the areas helping keep the SPX afloat as Technology unwound.

Since then, XLI has broken down from one trading box and reached its measured move target, and is now testing the bottom of another range. With the ETF already in a downtrend over the past several weeks, seeing buyers return soon is important to avoid another pattern breakdown. Support below current levels is relatively limited, adding to the importance of holding this area.
 

XLI’s current pullback is now approximately 12%, and as this chart shows, substantial declines following strong rallies have been the norm since 2023. We’ve seen several impressive advances, many stemming from upside trading box breakouts, but most have eventually given way to sizable pullbacks. 

The key now is whether XLI can maintain its longer-term series of higher lows, which has remained intact throughout this period except for the tariff tantrum decline in early 2025.

XLI vs. XLK

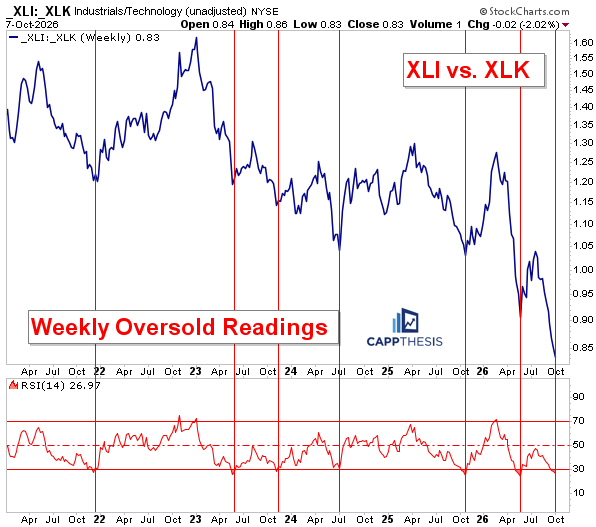
One relative ratio we’re watching is XLI vs. XLK, which has declined considerably over the past few weeks as XLI has rolled over and XLK has broken out. Although the longer-term, five-year trend in this ratio has been lower, there have been periods when XLI has outperformed XLK, typically following oversold conditions on the weekly chart, which have just been reached again.

The last such reading occurred at the beginning of the summer, as Technology was rolling over and other areas of the market began showing relative strength, accompanied by improving breadth. It has another chance now.

XLF Financials

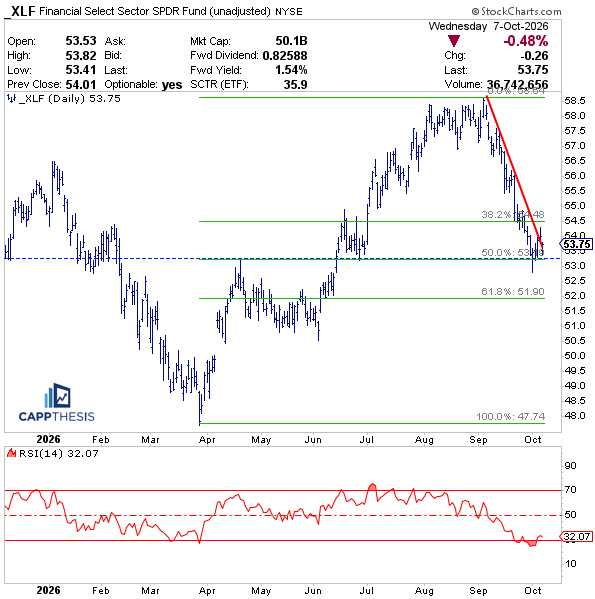
Another clear drag on the broader market has been Financials (XLF), the second-largest sector, which has been in a persistent downtrend since the beginning of September, as highlighted by the steep red downtrend line.
 

We discussed a few days ago how XLF was approaching a confluence of support, which it continues to try to respect. The 50% retracement of the entire rally coincides with support from June, making this an important area to hold.

If XLF cannot take advantage of these depressed conditions and, at the very least, break above its downtrend line, it would suggest that investors remain unconvinced. This uncertainty could persist into next week, when the largest financial companies begin reporting earnings.
 
XLF vs. SPX

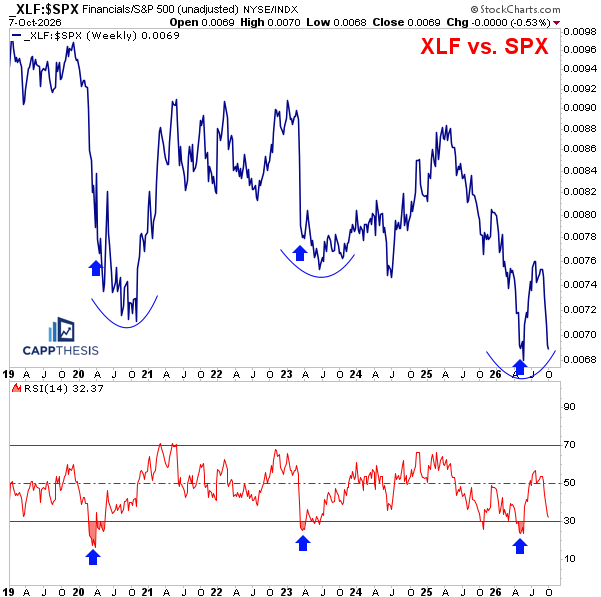
We identified the potential for XLF to outperform the SPX over the summer as the relative ratio became extremely oversold on a weekly basis. That played out, but the subsequent rally has since been completely reversed. With the ratio now approaching oversold territory once again, its ability to stabilize and potentially rebound will be telling.

GDX Gold Miners
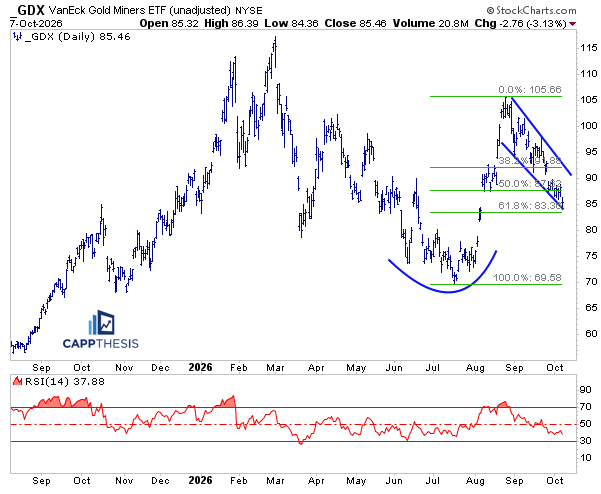
Another clear underperformer recently has been Precious Metals, with GDX trading in a downward-sloping channel since its summer rally faded in August. Given the extremely overbought conditions at the time, some consolidation wasn’t surprising. However, the decline has now taken GDX back to the 61.8% retracement of that entire rally, making it increasingly important for buyers to return.
 
Recently, GDX has been hugging the lower boundary of this channel, producing only modest bounces with little evidence yet of a momentum reversal. The best-case scenario clearly would be to see that change soon, ideally before the 14-day RSI reaches oversold territory again.


EWI Italy

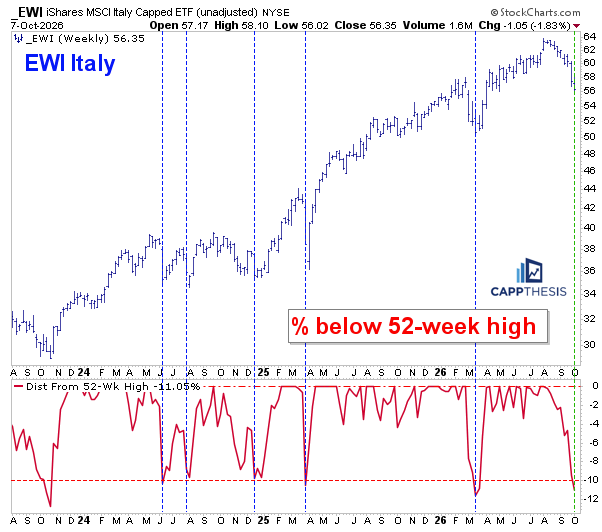
EWI has also been hit hard, as shown in the bottom panel, and now sits 11% below its recent 52-week high. This ranks among its largest pullbacks from a 52-week high since 2023, as highlighted by the blue vertical lines. Previous occurrences were followed by strong rebounds relatively soon thereafter, suggesting that declines of more than 10% from a 52-week high have generally presented better buying opportunities than reasons to sell into the weakness.


OIH Oil Services

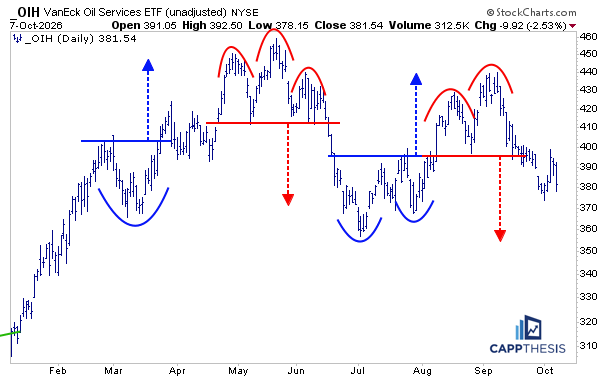
OIH was also hit hard yesterday, declining 2.5%, as the topping pattern we highlighted in September has now broken down, similar to what occurred in June. As we know, the ETF has been pushed around by Energy-related headlines for some time. Despite these swings, OIH remains essentially flat since mid-February, with smaller bullish and bearish formations continuing to play out without materially changing its longer-term direction…
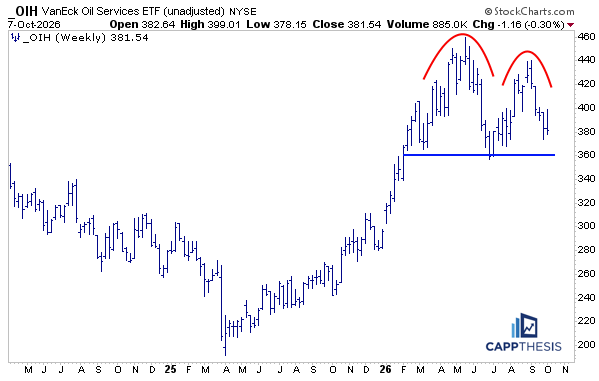
If we see additional downside follow-through, holding support near 360 will become increasingly important for OIH. As the chart shows, the price action throughout 2026 has been forming a potential double-top pattern, with the next move likely helping determine which formation ultimately takes shape.


TAN Solar

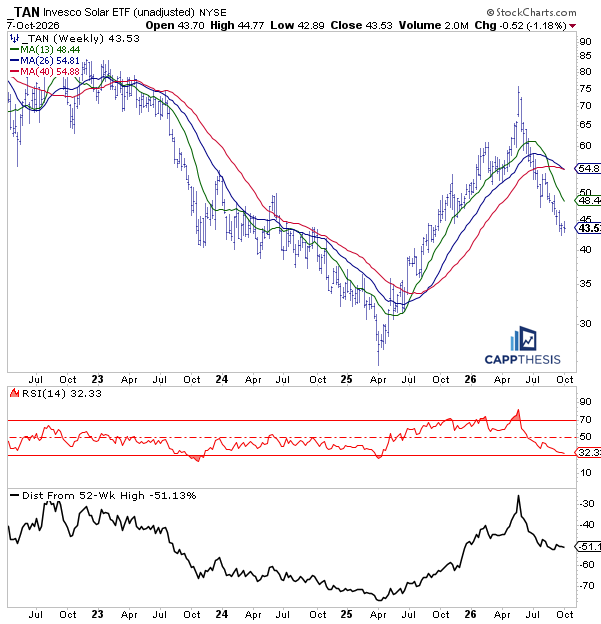
One of the worst-performing areas over the past several months, and among the biggest reversals, has been clean energy, as clearly illustrated by TAN. The ETF is now trading noticeably below its key weekly moving averages, similar to what occurred during the prolonged decline from 2023 through mid-2025. 
 
That downtrend eventually ended with a V-bottom reversal, producing a powerful rally that carried TAN back above those moving averages, which subsequently acted as support.
 

TAN’s current downtrend has been persistently steep, while its weekly RSI is also approaching oversold territory. As the bottom panel shows, the ETF has declined nearly 50% from its most recent 52-week high. While substantial, that drawdown remains well short of the extremes reached during the preceding multi-year decline.

For now, we’d rather see evidence of a sustained rally attempt rather than trying to catch a falling knife. That approach hasn’t worked over the past several months, nor did it during the multi-year downtrend that preceded the 2025 recovery.

ADMA (ADMA Biologics, Inc.)
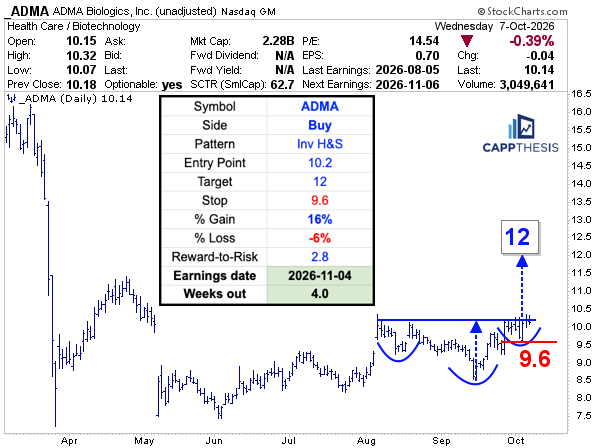
ADMA (Biotech) has a different look than XBI, which we’ve been highlighting as it continues to roll over. ADMA has been gradually recovering from a brutal spring sell-off, and a potential inverse head-and-shoulders formation is now taking shape. 
 
Although it’s a relatively low-priced stock, that also means even modest price moves can translate into sizable percentage changes. A breakout above current levels would produce a 12-upside target, with a potential initial stop-loss near 9.6.

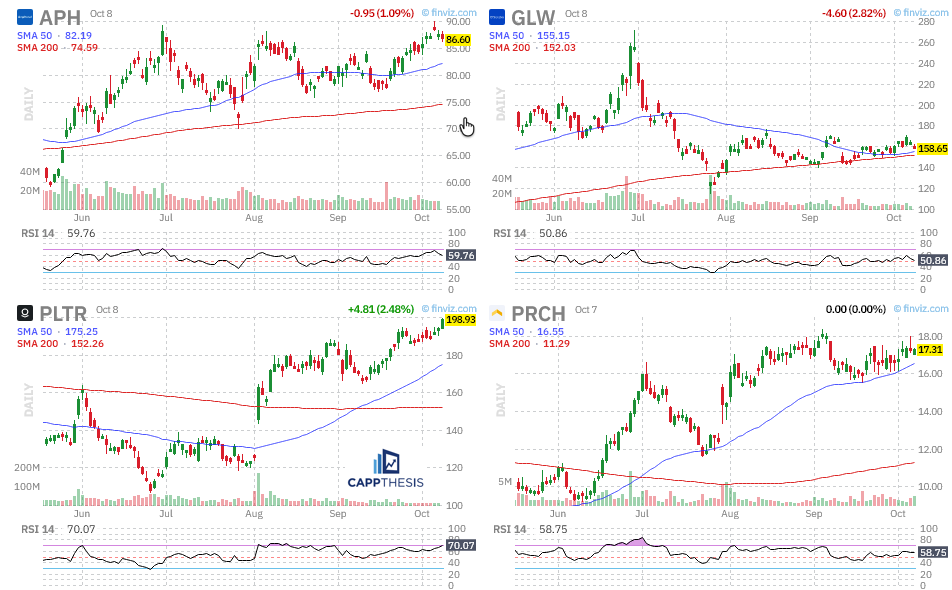
Watch list: APH, GLW, PLTR, PRCH

MORE LIKE THIS