Key Points:
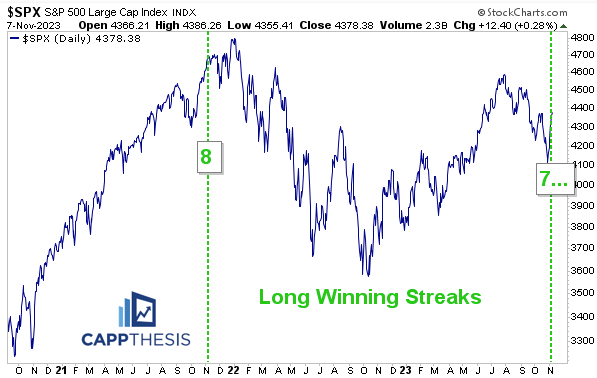
1- The SPX’s current 7-day winning streak is the longest since eight from November’21. From 2020-21, the index logged five different winning streaks of at least seven, with the November’21 edition being the fifth of five.
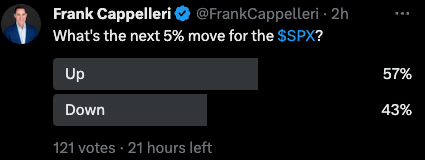
2- In a poll I ran on X this morning, nearly 60% of the respondents believe the next 5% move is higher for the SPX.
3- TLT is up 4/5 days and now is close to completing a 5-week basing pattern. It’s also approaching its 50-day MA, which it has routinely stayed below (or close to) since topping in 2020.
Topics Covered:
Market
-Seven-day winning streaks
-SPX Poll
-Fear & Greed
-Historic stat
-Pattern update
-AVWAP
Stats
-Daily price action
-Index Breadth
-Sector Perf & Breadth
-Best & Worst ETFs
Key Charts
-XBI Biotech
-IWF Large Cap Growth
-TLT
-XLE
SPX:
The SPX squeaked out its SEVENTH straight gain yesterday…
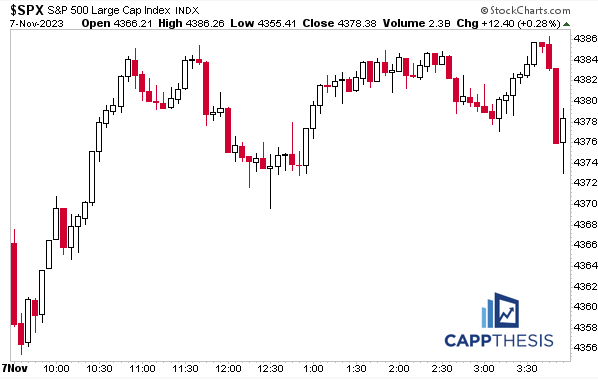
…which, of course, is now the longest streak of 2023. As noted yesterday, the last longer streak was eight back in November’21. Of course, that occurred at the tail end of the post-COVID rally, as bears gladly will point out.
That’s true, however…
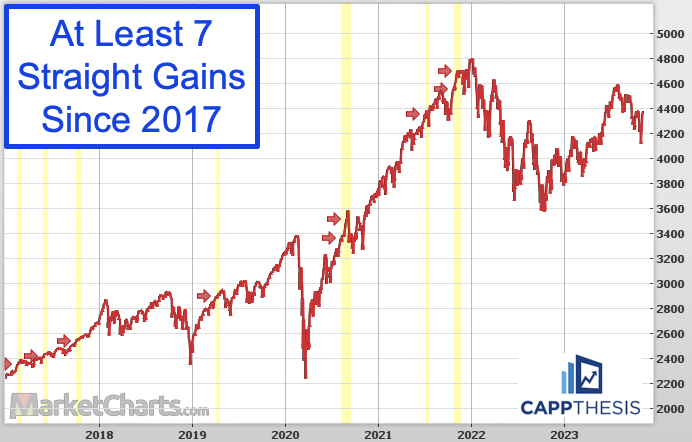
According to marketcharts.com, since the start of 2017, the SPX has had a total of nine prior non-overlapping winning streaks of at least seven. The index was higher 10 days later 78% of the time, with an average move of 30 bps. The best returns over those 10 days happened on day eight – again, on average.
Looking more closely at the 2020-21 period, there were five different winning streaks of at least seven, with the November’21 edition being the fifth of five. And while the SPX is notably above its 2022 lows now, the current uptrend is nowhere near as extended as it was two years ago.
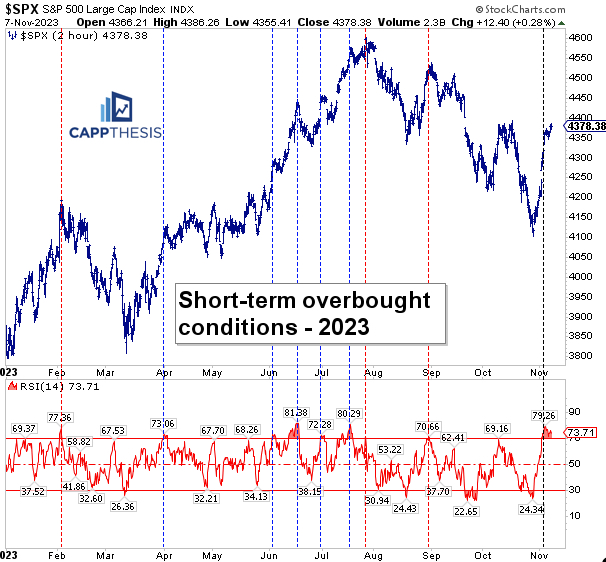
Short-Term
With the streak extending, the short-term overbought condition has remained. We know this can’t last, but, so far, the SPX is dealing with a stretched RSI better than it did the last two times in July and late August/early September.
The Next 5%
Earlier this morning, I asked X its collective opinion about the SPX’s next 5% move. As we can see, the bias is tilted to a 5% advance from here vs. a 5% decline (about three hours into the poll). Price action always influences sentiment, and this time is no different.
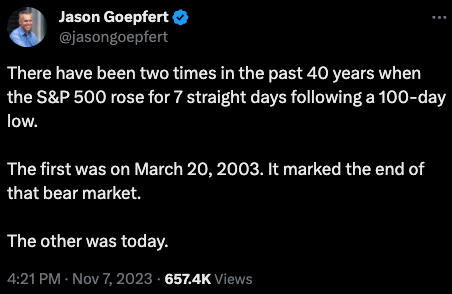
Throw in the well-known positive seasonality for this time of year, the Zweig Breadth Thrust and this factoid from Jason Goepfert of SentimenTrader, and we can understand why the mood is bullish. This post has gotten over 650k views since 4:20 PM last evening. Incredible.
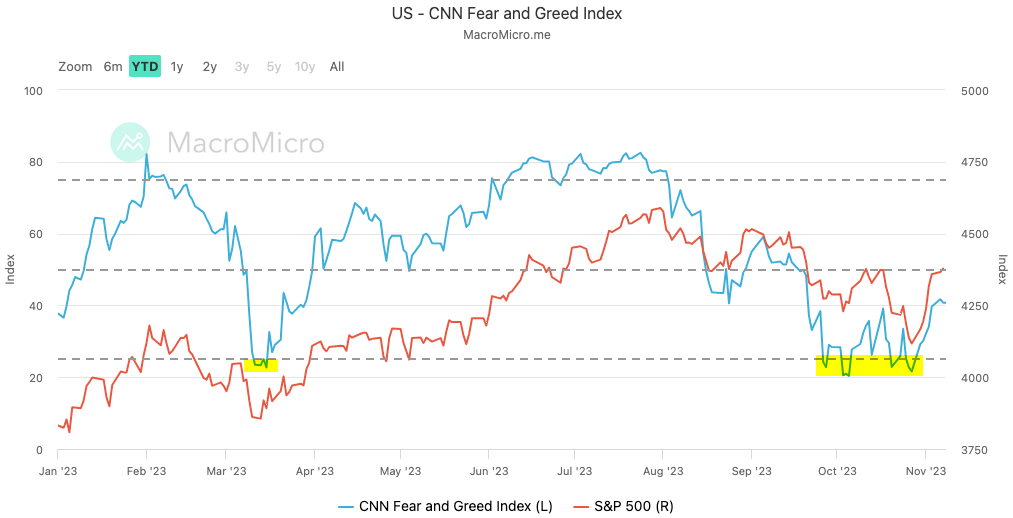
The giddy mood hasn’t been reflected in the CNN Business Fear & Greed Index yet though, which remains in the Fear Zone. Indeed, it’s off the Extreme Fear reading, which hit on 10/27/23 and nailed the SPX’s turning point. But it’s “trailing” the market during this comeback…
But we have to dig deeper to understand why.
As we know, this index is comprised of seven subjective “indicators.” Of the seven, just one has the “extreme fear” label right now: The number of new 52-week highs on the NYSE.
Given that most stocks still are noticeably below their 2023 peaks, this particular input won’t materially change for a while. It never does. It’s a lagging indicator, which will continue to lag, especially if large cap growth continues to lead.
Patterns
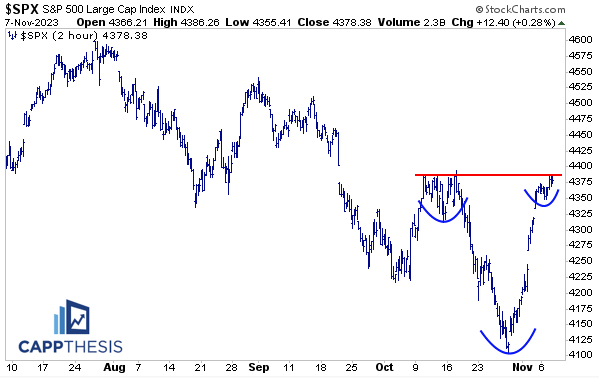
The potential bullish formation continues to build.
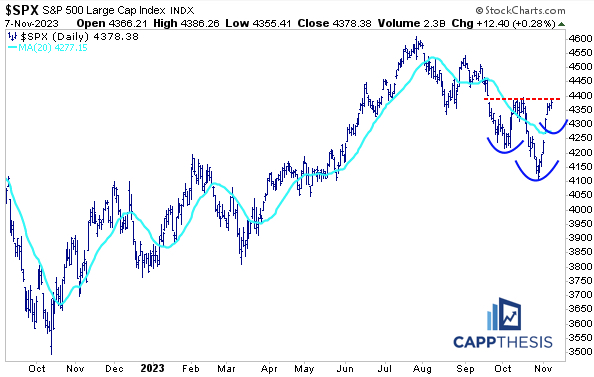
If the next pullback is shallower than the scenario pictured above, then this version of a bullish formation may work instead.
SPY AVWAP
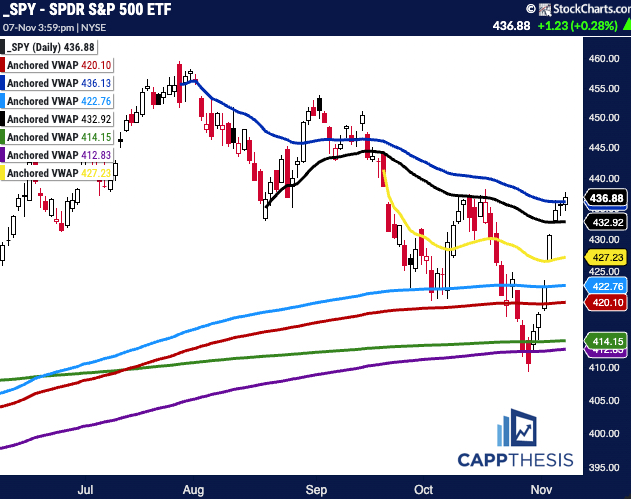
SPY has reclaimed SIX VWAP resistance lines over the last seven trading days. The last one is the line anchored to the 7/27/23 intra-day high, which it continues to flirt with now.
Purple: 1/4/22 – 2022 high
Green: 10/13/22 – 2022 low
Red: 1/2/23 – YTD VWAP
Light Blue: 2/3 – Former high point
Yellow: 9/20 – FOMC Meeting
Black: 8/18 – August low
Blue: 6/15 – FOMC negative reversal
Daily Price Action
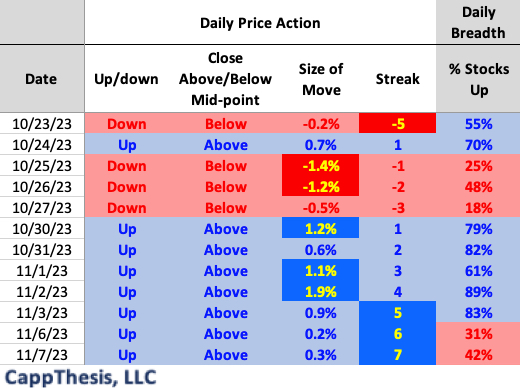
The last two days have been positive, but just barely, and breadth has been negative. That’s evidence of the big, more influential names continuing to lead. Just as important as the seven straight up days, though, is that the index has closed above its mid-point all seven sessions, as well.
Breadth
The NDX led again in terms of breadth yesterday, but this time, it had a positive ratio.

Sector ETFs
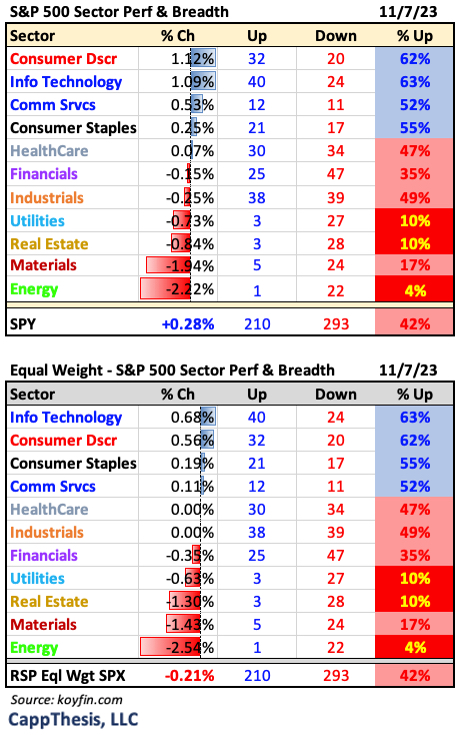
5/11 sector ETFs advanced on Tuesday, but more sectors had positive breadth compared to Monday, led by Tech and Consumer Discretionary.
Best and Worst 20 ETFs
Tech continued to lead, with lower yields helping.

XBI Biotech
By bouncing back from Monday’s decline, XBI is close to completing a 4-week bottoming formation. This would be a big step given that the last two potential bullish patterns failed to see upside follow through.

IWF Large Cap Growth
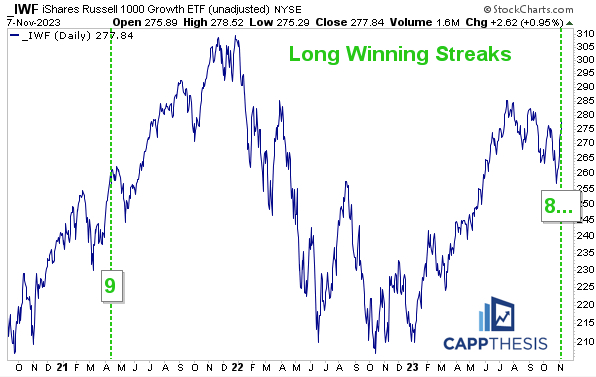
IWF logged its eighth straight gain yesterday, which is the longest since nine straight during the period ending 4/13/21. A multi-week pullback soon resulted back then, but the dip was bought and the uptrend persisted through year-end.
TLT
TLT is up 4/5 days and now is close to completing a 5-week basing pattern. It’s also approaching its 50-day MA, which it has routinely stayed below (or close to) since topping in 2020.

XLE Energy
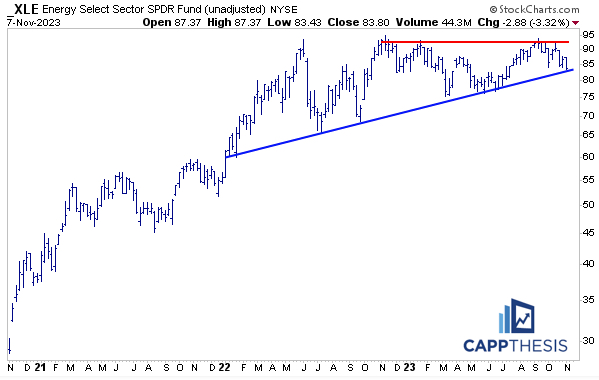
This is a very key spot for XLE on the weekly chart. It failed to break out of the potentially big bullish pattern over the last few months and now is back to the uptrend line that has encouraged demand every time since the start of 2022.
