Key Points:
1- So far, the SPX has logged just three 1% moves in March (2 up and 1 down). This has continued a trend that started in April’23. See more below.
2– While rotation in leadership has helped the market extend higher, it has been just as important to see a rotation among breakouts. We look at more potential breakouts in the Key Charts section.
3– The SPX logged its second straight day of negative internals on Monday. It’s only had ONE longer streak the entire time: 11/6 – 11/9/23 (four in a row).
Topics Covered:
Market
-Recent bad closes
-Bullish traits
-Low two-way vol
-Patterns
-AVWAP
Stats
-Daily price action
-Index breadth
-Sector performance
-Best & worst ETFs
Key Charts
-COWZ
-CALF
-HYG
-KBE
-ARKK
-Bitcoin
SPX:
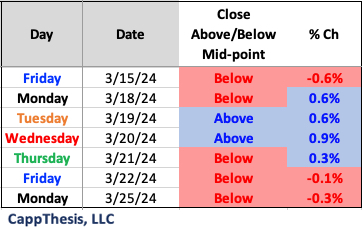
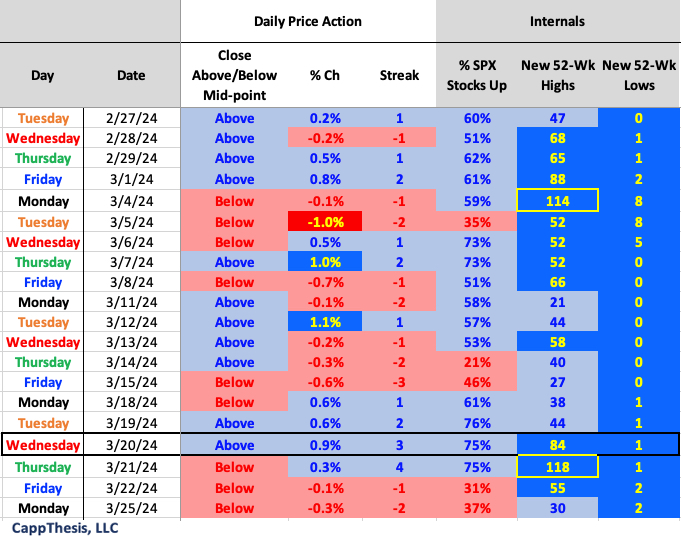
The SPX endured another sub-par close on Monday and now has finished beneath its intra-day mid-point in five of the last seven trading days. If a cluster like this continues, it would raise some red flags, especially since the index has closed above its mid-point 75% of the time since the October market low.
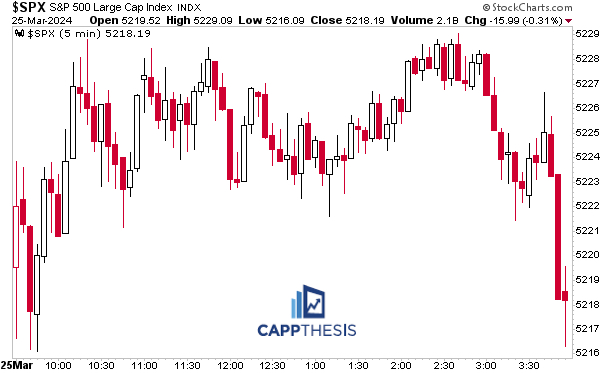
The silver lining is that despite not closing well over the last week and a half of trading, the daily movement has remained subdued. The biggest single day decline over the last seven trading days has been -0.6% on 3/15.
And with three trading sessions left in the week, month and quarter, the SPX has continued to be boring. This isn’t bad. In fact:
Boredom is the most bullish trait for the market.
A boring trading environment means a small number of big moves, low two-way volatility, clean breakouts, successful bullish patterns and failed bearish patterns. All of those have created the current five-month uptrend, which has held despite a few tests lately.
Low Two-Way Volatility
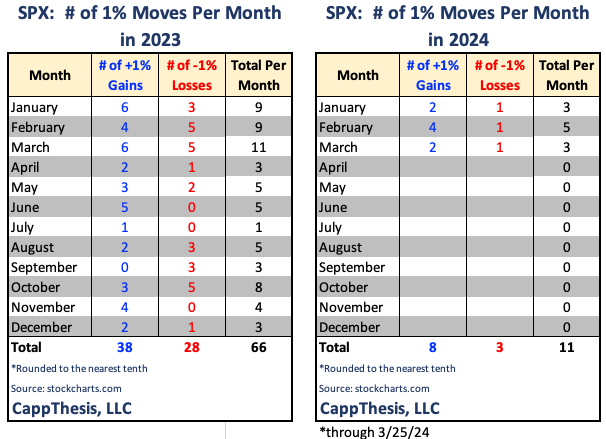
As long-term readers know, one of the most important market stats we track is the number of +/-1% moves per month. The best-case scenario is this:
-Low amount of 1% absolute moves.
-More 1% gains vs. 1% losses
This extremely simple, yet powerful, formula has played out in nine of the last 12 months, starting in April 2023. And, really, the SPX’s daily movement has remained relatively calm in each month except for October’23 (eight 1% moves – three up, five down).
A small amount of big moves has kept emotion in check, despite the recent labels of this advance having excessive exuberance. Consistent, yes. Parabolic, no – at least within the S&P 500.
Breakout Rotation
A key aspect of this advance has been rotation. We hear it all the time, but it’s important to track how this has transpired. It’s not just about a rotation of leadership, though.
We’ve seen a rotation of breakouts, as well. Some indices, ETFs and stocks already have achieved lofty targets, mostly large cap growth. Select value and small caps, and even speculative growth areas, now own some of the most interesting chart patterns – some of which we talk about in the Key Charts section below…
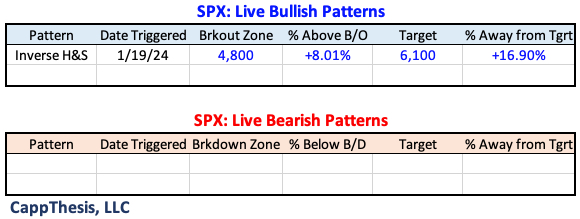
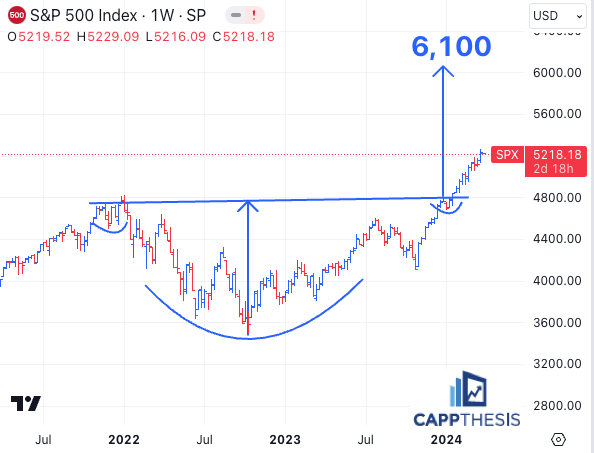
Patterns
We’re still waiting for the next short-term bullish pattern to form. The 6,100 target remains in play.
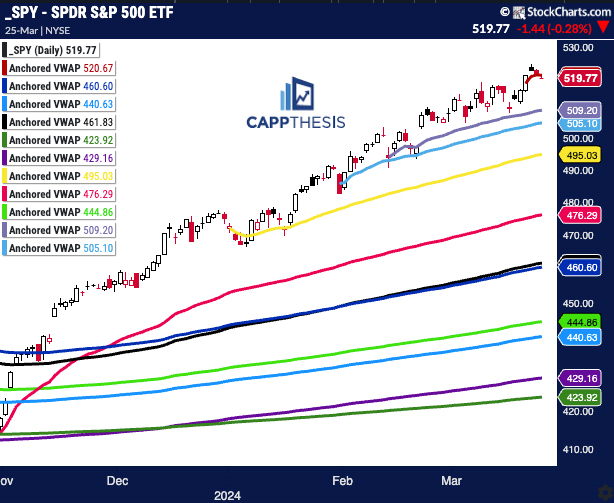
SPY AVWAP
We’re keeping the most recent VWAP line anchored to last Wednesday’s FOMC meeting. The SPX ended yesterday just below it.
Red: 3/20/24 – FOMC
SPY
Light Purple: 2/13/24 – CPI
Light Blue: 1/31/24 – FOMC
Yellow: 1/2/24 – YTD VWAP
Pink: 10/27/23 – October’23 low
Blue: 6/15/23 – FOMC negative reversal
Black: 8/18/23 – August low
Light Green 3/13/23 – March Low
Light Blue: 2/3/23 – Former high point
Purple: 1/4/22 – 2022 high
Green: 10/13/22 – 2022 low
Daily Price Action
The SPX logged its second straight day of negative internals on Monday. It’s only had ONE longer streak the entire time: 11/6 – 11/9/23 (four in a row).
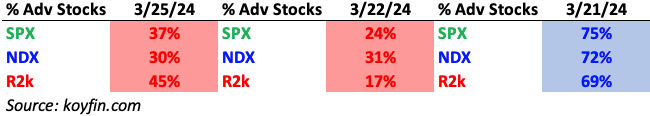
Breadth
Small Caps outperformed yesterday but still finished with more stocks down vs. up.
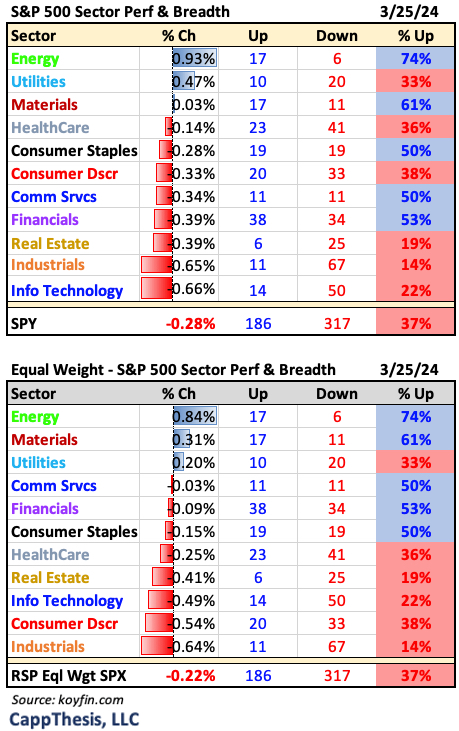
Sector ETFs
Despite the sub-40% breadth yesterday, five sectors had positive internals – led by Energy.
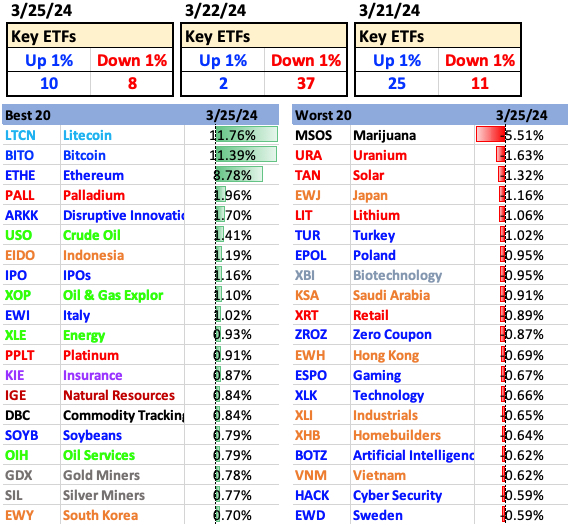
Best and Worst 20 ETFs
The Crypto spike dwarfed all other moves yesterday.
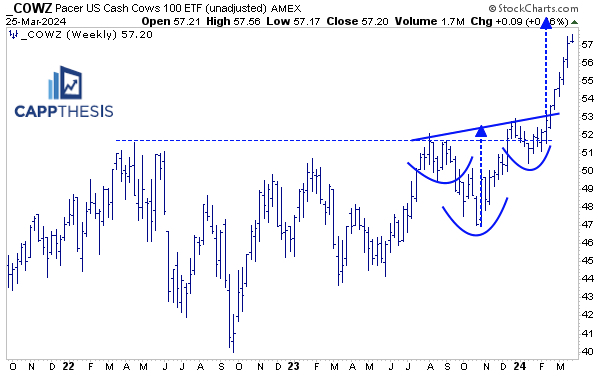
COWZ US Cash Cows
The COWZ US Cash Cows ETF has become a popular ETF to track for two main reason – its catchy ticker symbol and it’s continued new all-time highs. We profiled this bullish pattern, which COWZ broke out from in late February and has followed through on in March. It’s nearly at the upside target.
As described on the Pacer website, COWZ starts with the Russell 1k universe to eventually get to the “top 100 large-cap companies with the highest free cash flow yield.” While no one holding is more than 2% of the ETF, two sectors account for a 41% weighting: Energy 23% & Consumer Discretionary 18%.
We bring this up since another Pacer ETF is getting close to its own breakout…
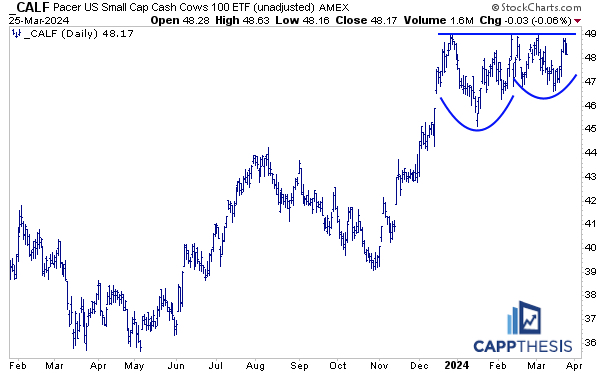
CALF US Small Cap Cash Cows
The CALF ETF uses the S&P Small Cap 600 and holds the “top 100 small-cap companies with the highest free cash flow yield.” It also has two sectors with a lot of influence: Consumer Discretionary 31% & Industrials 23%, which make up 54% of the ETF.
It had a good run through late December and has been backing and filling since then. All of that has created this potential three-month cup/handle pattern. If small caps and value are going to work, CALF will benefit.
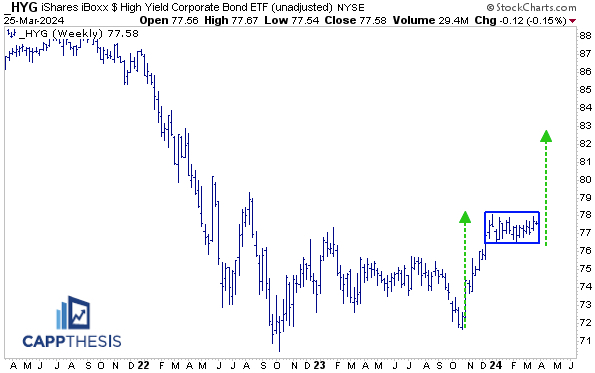
HYG High Yield Bonds
While we don’t comment on HYG a lot, with credit holding in there, HYG held, as well. And on the weekly chart, it now has formed a potential bull flag pattern. A breakout would target the 83 zone.
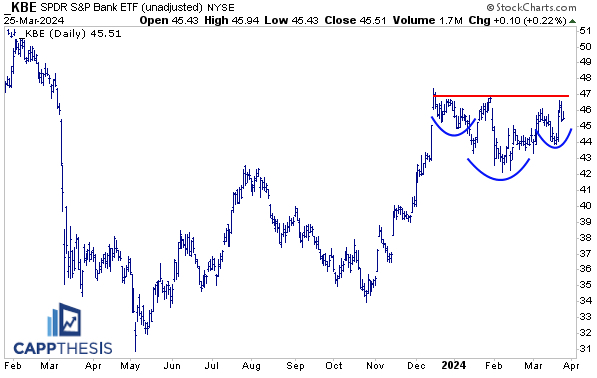
KBE Banks
KBE has had a disjointed ride the last few months, but it now has formed this potential bullish inverse H&S pattern. It still has some work to do from here but punching through the 47 level would yield a breakout target near 52.
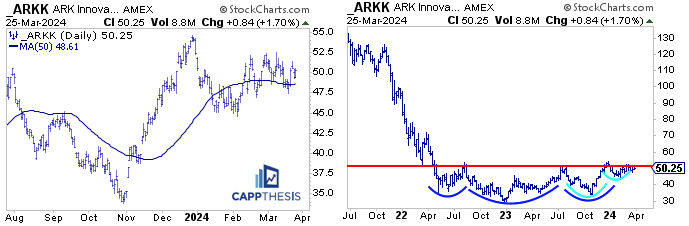
ARKK
ARKK has stayed near its 50-day moving average for most of 2024, with false starts both above and below the line. But by holding, it has kept the potentially very large base in play – seen here on the weekly chart. This could play a big role in the coming months should it be triggered.
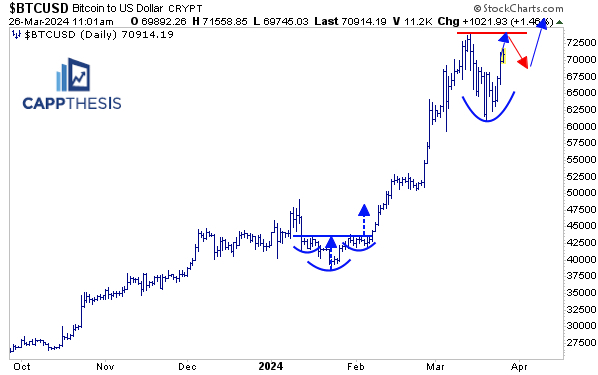
Bitcoin
Here’s a potential path for Bitcoin after yesterday’s big up-move. A higher low under the most recent high could help form a potential bullish pattern before the halving on 4/20/24.