Key Points
The S&P 500 starts Tuesday after logging a second straight small move — a minor gain. Follow-through on both sides has been limited in July; so far, we haven’t seen a winning or losing streak extend beyond two sessions all month. Thus, the onus remains on the bears to do something more substantial with the market’s extended state.
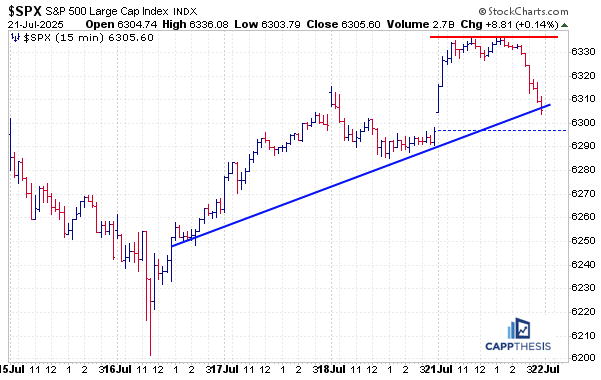
On a very short-term basis, the S&P will be trying to hold the multi-day uptrend line.
Last Five Trading Days
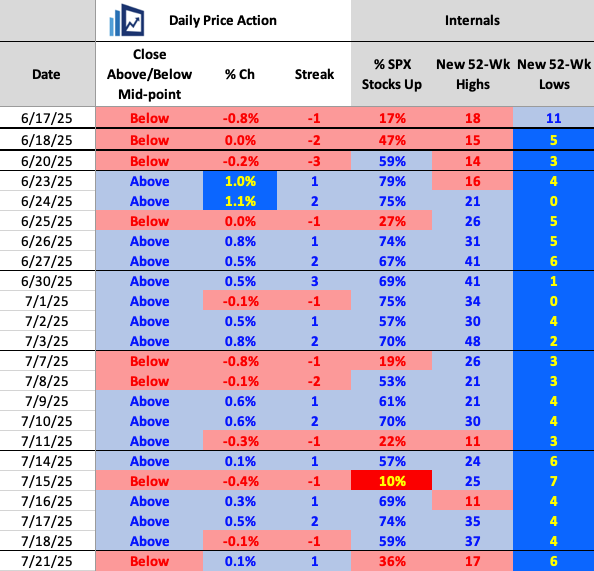
Daily Price Action
The obvious negative theme on Monday was weak breadth, with fewer than 40% of S&P 500 stocks moving higher. We haven’t seen two consecutive negative breadth days since June 17–18. For the sellers to gain any real momentum, that clearly needs to change.
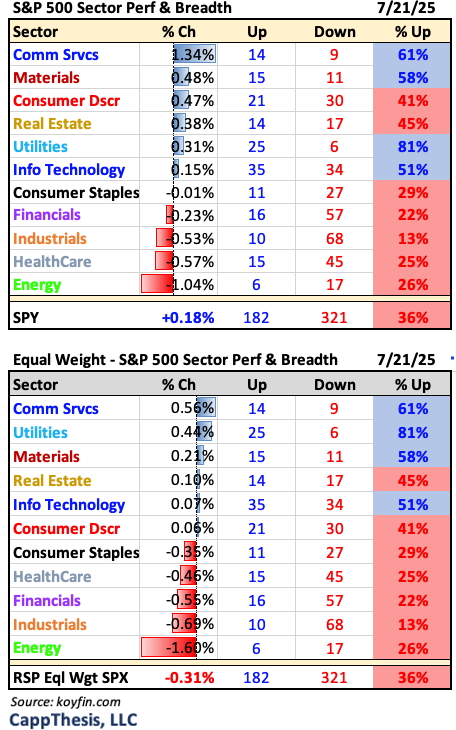
Sectors
Only four of the S&P 500’s 11 sectors had positive breadth yesterday, including Communication Services and Technology. That clearly helped the market-cap-weighted index outperform the equal-weighted RSP ETF.
Industrials fared the worst by far, with only 13% advancing stocks.
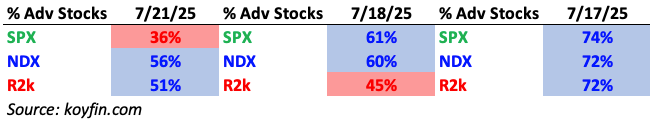
Breadth
Both the NDX and Russell 2000 outperformed the S&P 500 from a market internals perspective, but their relative strength ratios were only marginally positive.
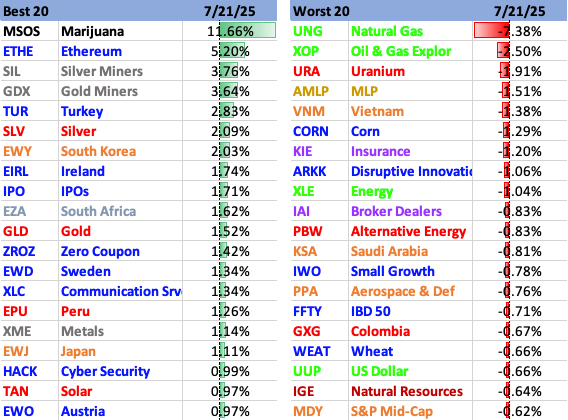
Best & Worst 20 ETFs
Crypto — mainly Ethereum — outperformed again on Monday, along with miners and select growth stocks. On the downside, natural gas, energy, and non-bank financials were among the weakest groups.
The Missing July Volatility
After two straight much-better-than-usual monthly showings in May and June, the general expectation for July was a shake-up, or at least some additional back and forth movement. The 90-day tariff reprieve was set to expire, the first earnings season since the market snapback was upon us and the latest FOMC meeting was scheduled to conclude the month (not to mention the typical, highly watched economic reports we see every month).
While we’re still waiting for the biggest names to report and the FOMC’s decision (taking place in the month’s second-to-last day of trading), we’ve now gone through about three quarters of July, and volatility still is nowhere to be found.
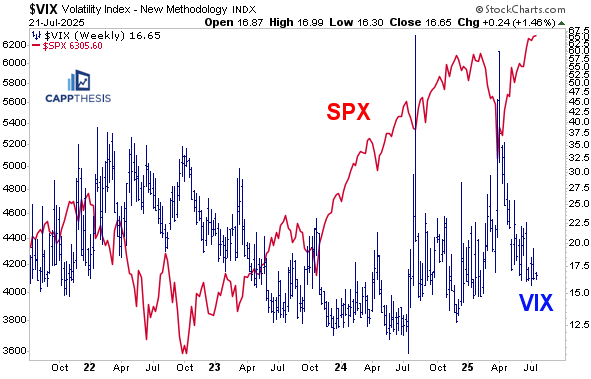
First, as we know, the VIX continues to trade near 16: Bears will point out that the index has yet to undercut its February lows and remains noticeably above its July’24 low point. This is true…
… however, another measure is flashing the calmest reading we’ve seen in years…
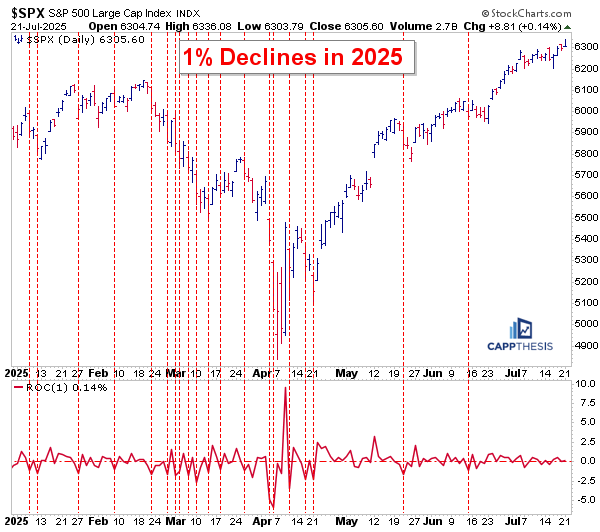
So far, the SPX has yet to log a 1% GAIN OR LOSS in July.
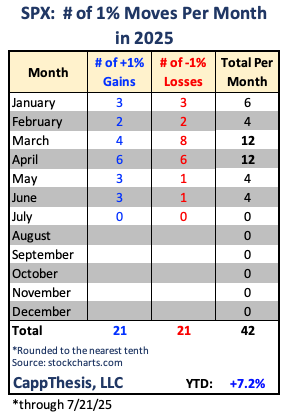
For some context, going back to 2022, here are the months when the when the SPX has had ZERO ABSOLUTE 1% moves:
NONE.
The index had zero 1% losses in a calendar month a handful of times since 2022:
2023: June, July and November
2024: May, June
Over that same time frame, there was just one month with zero 1% gains: September’23.
In fact, we have to go all the way back to December 2019 to find the last time this happened.
Even more telling, zooming all the way out to 2005, the SPX has at least one calendar month with no 1% moves in just six of the past 20 years through 2024.
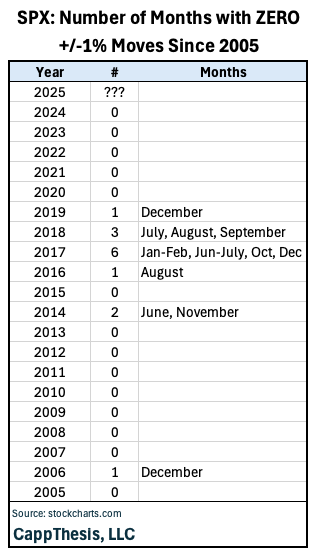
As the table above shows, they’ve only occurred in 2006, 2014 and then from 2016-2019. The most, by far, happened in 2017 – when the SPX logged only EIGHT +/-1% moves all year (four up and four down).
Now, it’s not like seeing July’25 finish with no 1% moves is a bullish signal in and of itself. It’s clear that three straight months of no 1% gains or losses happened from July – September 201, right before the bottom fell out in the fourth quarter.
The bottom line is that if two-way volatility remains low, it will help breakouts continue to work. We need both to exist for the market to maintain its uptrend.
Market Breadth… Continued
This past Friday, we devoted an entire issue to market breadth, noting how the major indices were making new highs, along with the cumulative adv-dec lines. The caveat was that the equal weight indices (RSP S&P 500 ETF and NDXE NDX 100) were lagging. The takeaway was that this was a natural ebb and flow of the bull market.
Following up on that, the following is from Charlie Kirk of the famous Kirk Report, who said it best here in his weekend report:
“Uneven recoveries are common. Poor breadth is a condition, not a signal. If we reacted by selling or shorting every breakout with weak breadth, we would have been out of business a long time ago!
Additionally, the reason why we can’t find price action studies justifying aggressive selling/shorting based on breadth divergences is 1) the condition can be present for long periods of time, and 2) markets have shown a tendency to rotate and correct these imbalances during periods of short-term, overbought consolidation.
When active investors and traders start complaining about breadth, it is a signal they are significantly underperforming due to poor positioning with too much cash and/or stocks/etfs performing poorly and need/hope breadth to improve to get them back on track.”
Another RSI Divergence
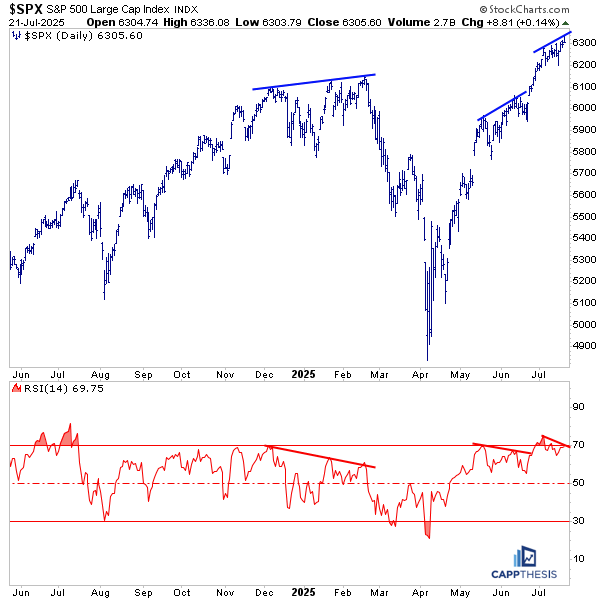
The same argument can be said in regard to indicators. We talked about the negative divergence in the 14-day RSI in June, noting that seeing the SPX continue to advance in face the softening momentum would be a clear positive sign. Of course that has happened…
It’s now occurring again: indeed, the SPX’s RSI now is near 70 but it is making lower highs while the index, itself, has pushed to new highs.
At any point, the market will have to take an extended (and/or deeper) breather, but weakening momentum alone won’t be the reason for the next pullback. It will just be time for the market’s character to change. And in the best-case scenario, that would allow additional bullish patterns to take shape.
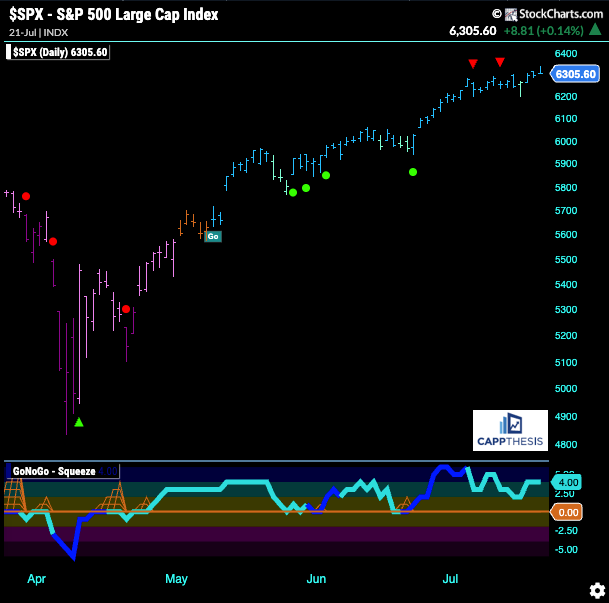
GoNoGo Trend – Daily
The GoNoGo Trend remains in bullish mode, with the recent countertrend signals having yet to trigger a greater pullback.
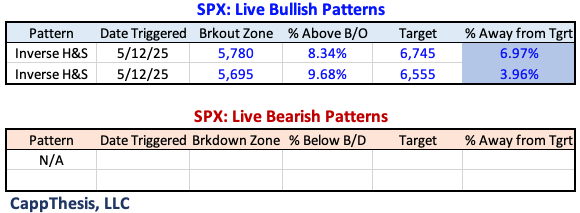
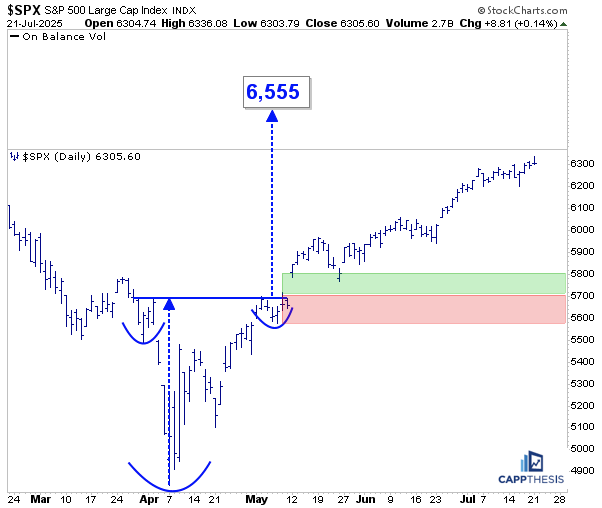
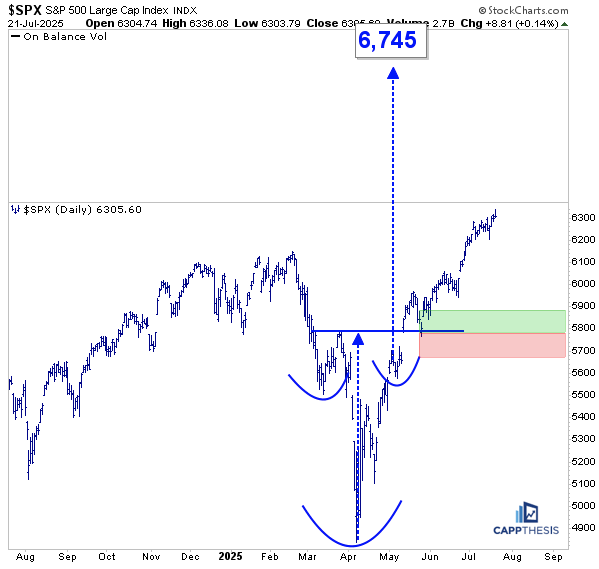
Live Patterns
Our two live bullish patterns remain – targets of 6,555 and 6,745, which could be with us for a while going forward. For those to eventually get achieved, though, new, smaller versions will need to be constructed.
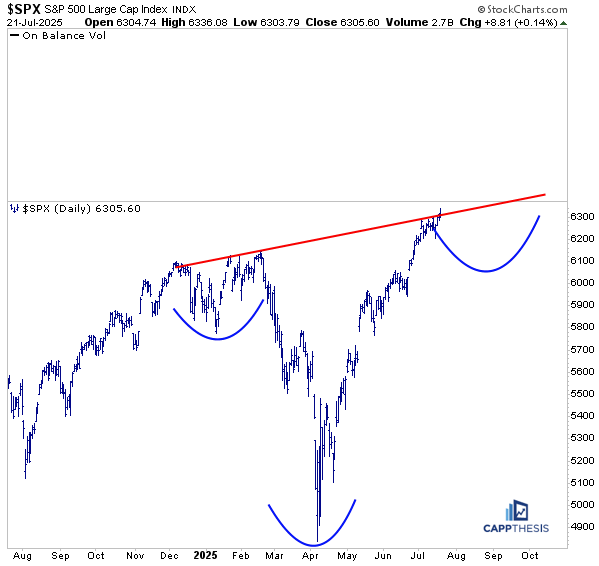
Potential Big Bullish Pattern
Here’s the adjusted potential bullish pattern. If this works out in the coming weeks/months, it will have this upward sloping neckline to potentially punch through.
GLD Gold
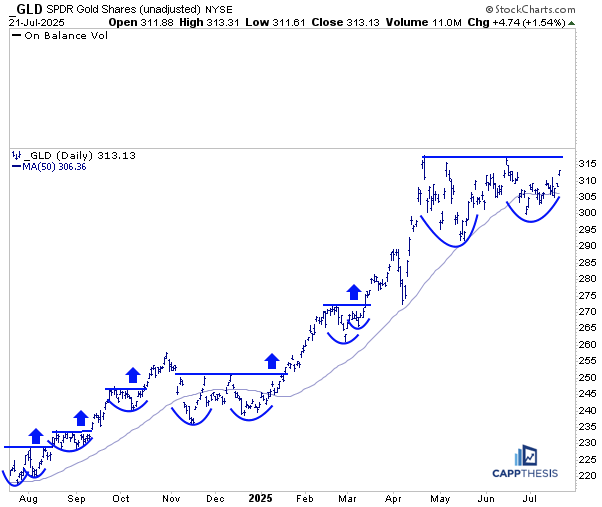
While Gold has been largely absent from the risky asset explosion the last few months, it hasn’t rolled over. In fact, it’s slowly been forming this potential three-month cup and handle formation while staying close to its upward sloping 50-day moving average.
We’ll know if this long uptrend will remain feasible by how well GLD leverages this latest formation. As is clear, every other digestive period over the last 12 months has been broken out of, which, of course, has led to higher prices.
ETHE Ethereum
ETHE has clearly followed through on the big bullish pattern breakout we highlighted two weeks ago. Yesterday’s high got to within one point of the initial target — that’s obviously bullish and the best we could’ve hoped for at this stage.
The obvious question now: does it finally need to take a break?
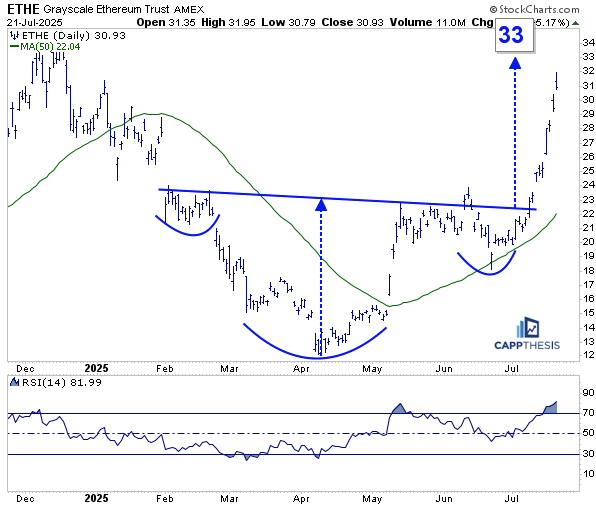
The spike has now produced a 14-day RSI reading of 82, which is, of course, extremely high. On a very short-term basis, the risk/reward clearly isn’t as attractive as it was when the ETF first broke out.
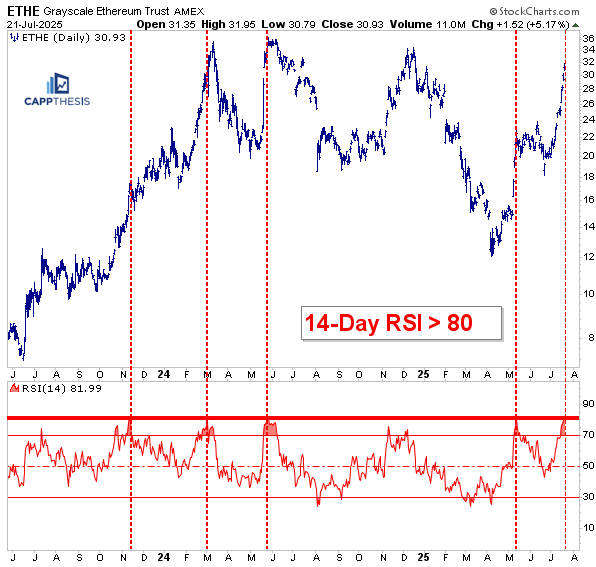
As we can see from this chart going back to late 2023, previous RSI 80+ readings have led to — at best — pauses, and at worst, key trading tops. So, at the very least, it’s worth being patient in the near term to see how this latest stretched reading is dealt with.
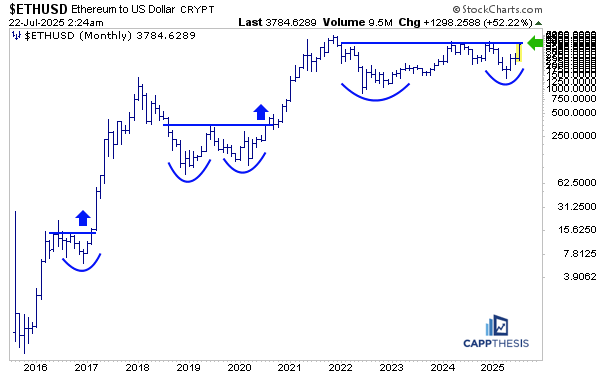
The big picture for Ethereum shows just how substantial it would be to eventually break through the recent highs. That potential bullish pattern on a log scale, which we’ve been highlighting, is now very close to completion.
So, the best-case scenario at this point would be to see both Ethereum and ETHE take a pause, regroup, and then — of course — challenge and eventually make new highs.
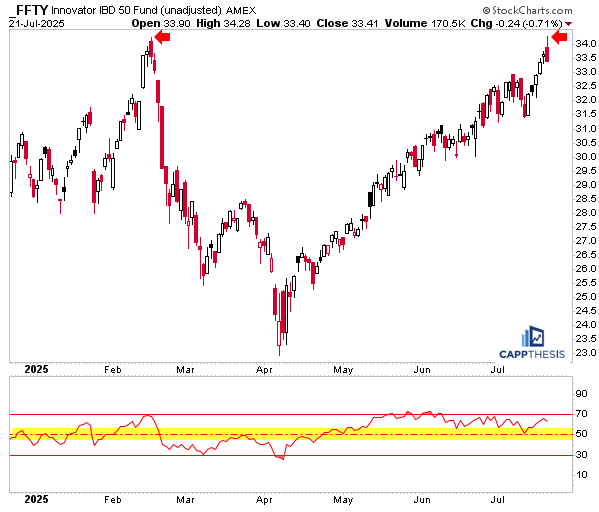
FFTY – IBD 50
ETHE has The FFTY ETF has had a huge run off the April lows, and yesterday it marginally made a new high versus its February peak. Like many other areas, it ended the day with a negative reversal, which can also be labeled a bearish engulfing pattern. That same scenario played out at the February highs, which, of course, is a concern. If momentum completely rolls over like it did back then, it could spell trouble — though the backdrop is notably different now. This is all about follow-through from here.
One major difference: RSI has been hovering between overbought and the midpoint since the end of April, so it’s natural to see the indicator pull back toward the 70 area. The next key step would be seeing RSI bounce near the 50 level — something it failed to do in February.