Key Points:
1- The SPX has altered gains and losses two weeks post the CPI report the last six times, starting with the release from last November. It dropped two weeks after the last report before bouncing back.
2- This is the first time that the SPX has been net-flat since a prior month’s report over the last year.
3– The SPX continues to sport both potential bearish and bullish setups. If the bearish pattern fails, then the bigger potential bullish formation would be completed… and vice-versa. The odds are low of both remaining in play for much longer…
Topics Covered:
-SPX & CPI
-SPX, 10-Year Yield & USD
-Pattern Update
-Drawdowns
-AVWAP
-Sentiment
CPI
With the CPI report out, the question is whether the market has enough fresh data to finally exit its nearly six-week trading range – one way or the other.
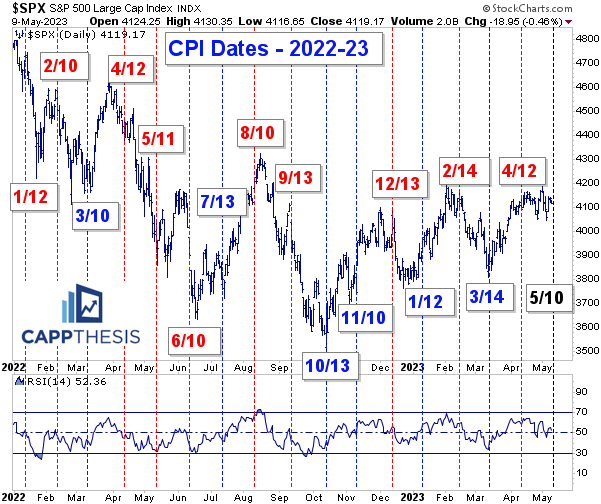
Below is the chart that overlays all the CPI dates on the SPX going back to the start of 2022. Specifically, this depicts how the index fared in the two weeks that followed the report (red: down two weeks later; blue: up two weeks later).
Looking closely, it’s clear that the SPX has altered gains and losses two weeks post the report the last six times, starting with the release from last November.
Also obvious: the red dates have tended to happen after preceding strong multi-week price action; the blue dates after prior downturns.
Interestingly, this is the first time that the SPX has been net-flat since a prior month’s report. It bounced the last two weeks but has been unable to punch through the same resistance zone we’ve been staring at since April started.
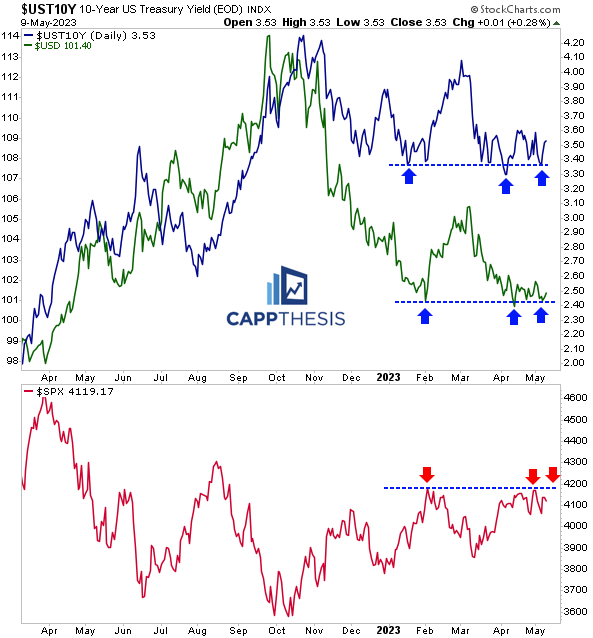
As is always the case, a lot is riding on how the market perceives the numbers. From a technical standpoint, the SPX, 10-Year Yield and US Dollar have been parked at major resistance (for the SPX) and support lines (for the 10-Y and USD). Said lines represent boundaries of significant chart patterns, as well.
Each of these either will continue to hold or break, and the cards will fall as we’d expect.
SPX
For the SPX, the lone live bullish pattern has been tested twice and has held twice.
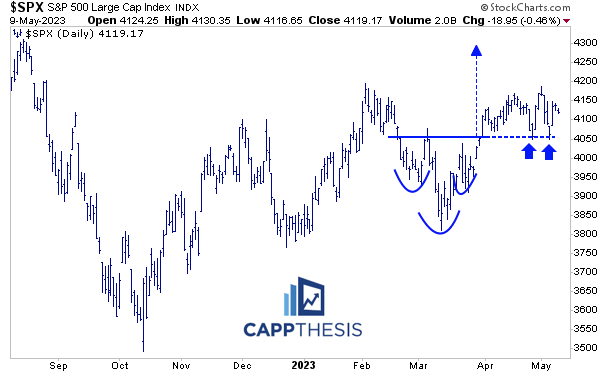
That breakout zone also has become the low point of the SPX’s six-week trading range, which began as April and the second quarter started.
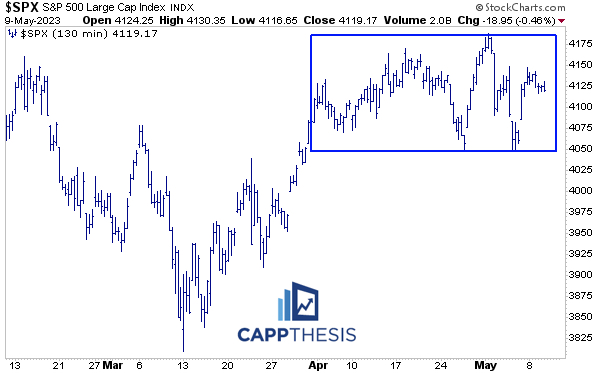
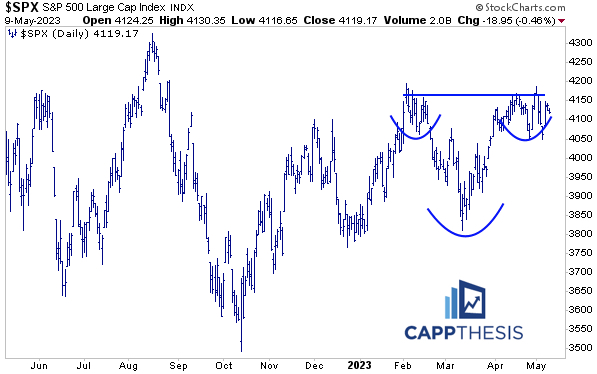
The lower highs within the above range have created this potential bearish formation, which continues to linger.
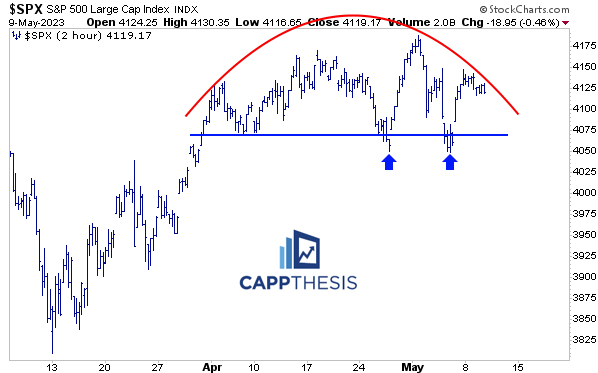
If the bearish pattern fails, then this bigger potential bullish pattern will be completed… and vice-versa. The odds are low of both remaining in play for much longer…
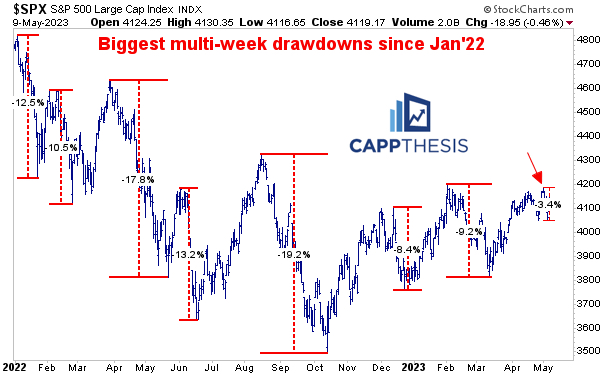
The biggest drawdown we’ve seen since the March lows only has amounted to 3.4%. Bulls will say this shows new-found fortitude; bears will contend we’re overdue for a larger drawdown.
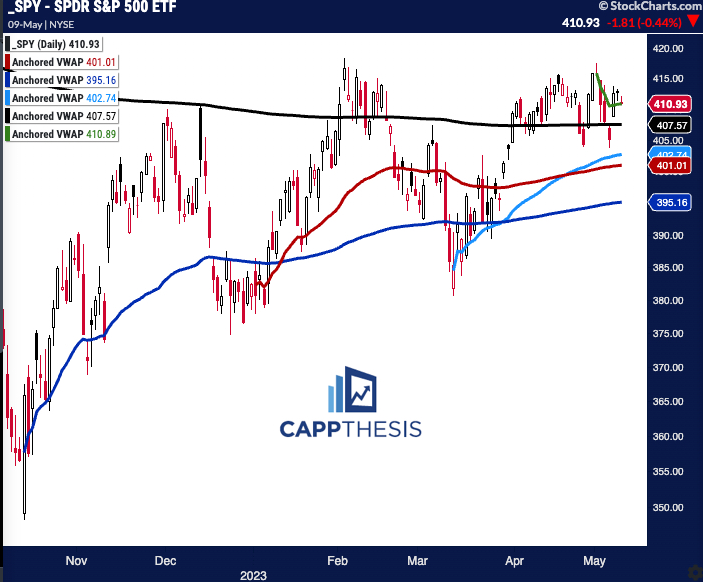
SPY Anchored VWAP
Yesterday, the SPY ETF closed directly on the VWAP anchored to last Friday’s big move.
So far, SPY has stayed close to the VWAP line tied to the ETF’s all time high (in black). Again, each prior attempt near this line eventually failed to hold.
VWAP Lines:
Green: 5/1/23 – the most recent intra-day high and negative reversal
Black: 1/4/22 – the all-time high
Red: YTD AVWAP
Light Blue: 2023 low
Dark Blue: 2022 Low
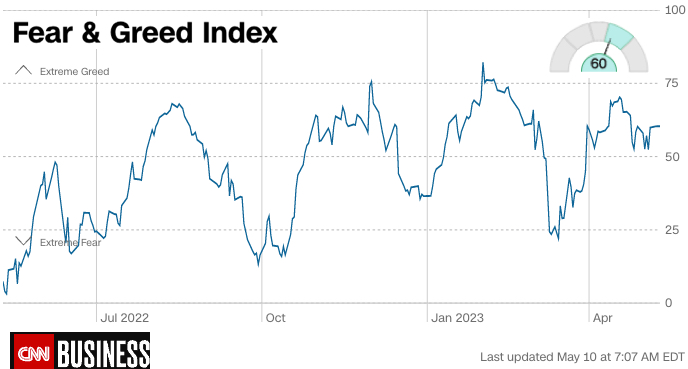
Sentiment
The CNN Money Fear & Greed Index is back to the Greed zone, but it is still below the April peak. This continues to mirror the SPX, but not exactly. With it making lower highs lately, it has behaved more like the RSP Equal Weight S&P500 ETF we discussed yesterday.
The question, of course, is “Who is leading whom?” In fact, I asked Twitter users that yesterday, and people are still arguing about it. That accurately depicts the tug of war we’ve been in recently.