Key Points:
1- The most bullish thing we can say about the recent price action is that over the last seven days, the SPX has closed near its highs five times. So far, this has not been leveraged.
2- Currently, 35% of the S&P 500 are trading above their respective 200-Day MA, which it’s the lowest level since early November’22.
This is considered oversold for a market that’s in an uptrend. A free-falling market, however, could force the % to plummet further like we saw last year.
Topics Covered:
Market
-The last seven days
-Key support
-% S&P 500 stocks > 50 & 200-DMAs
-MACD
-Pattern update
-AVWAP
Stats
-Index Breadth
-Sector Perf & Breadth
-Best & Worst 20 ETFs
Key Charts
-XBI
-EWW
-XLP
-CORN
SPX:
With the non-farm data out, the SPX is at risk at extending its weekly losing streak. As noted yesterday, it’s already the longest since four in December. Hitting five would be the worst since last April-May’s seven week roll over.
While the index needs only a modest gain today to break the streak, a more convincing effort would be welcome, of course. That will take a strong comeback if this negative reaction persists.
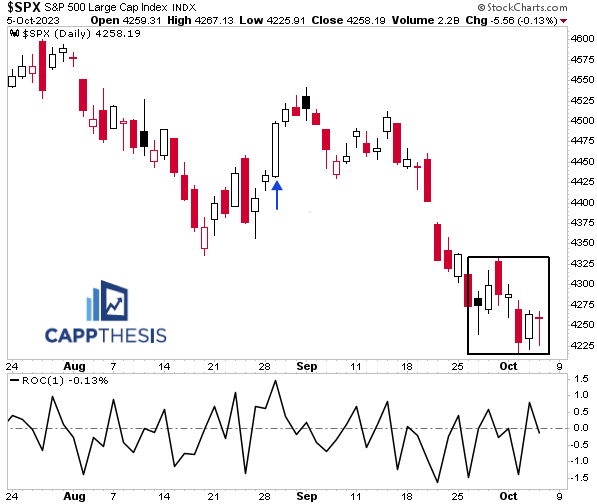
The below chart captures all the action since a few days before the July 27th top. One thing is clear: it’s dominated by big red candles. The only 1% gain over this entire time frame, of course, happened on 8/29 (blue arrow).
That simply needs to change.
Here’s the most bullish thing we can say about the recent price action: over the last seven days, the SPX has closed near its highs five times. That includes yesterday, even though the index still finished on the lower day. The SPX also has alternated between gains and losses now for six days.
In other words, the index has shown flashes this week, but nothing has been enticing enough for buyers to aggressively support any effort up to this point.
The big question is whether it’s just a matter of time given this budding change of character has been taking place near the clear support area.
There are other factors to consider, as well.
% S&P 500 stocks > 50 & 200-DMAs
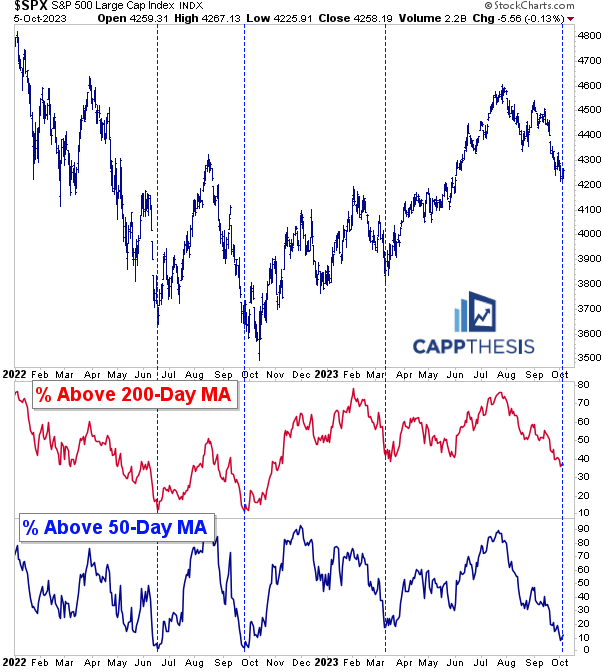
The % of S&P 500 stocks trading above their 50-Day MAs just hit the 10% mark, which is near the extreme low end going back to 2022.
The same is NOT true for the % of S&P 500 stocks trading above their 200-Day MAs; this isn’t a shock since in 2022 most stocks were below their long-term lines until November. That said, at just 35%, it’s the lowest level since early November.
That’s considered oversold from this perspective… for a market that’s in an uptrend. A free-falling market, however, could force the % to plummet further like we saw last year.
Said differently, this another reason why seeing a rally effort soon is important.
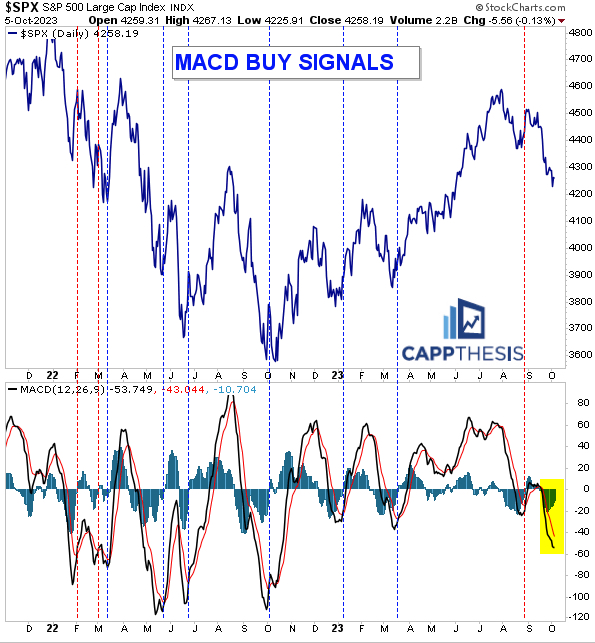
MACD
The last MACD buy signal in late August did not work out too well. Only a few additional days of upside price action occurred after it was triggered.
Without getting into how the indicator is calculated, in general terms, buy signals that get triggered from a deeper oversold condition tend to work better. The last one materialized from a relatively shallow spot.
We’re not about to get another buy signal now, but the indicator’s two lines below are getting narrower. That’s a necessary component of an eventual signal going live. Again, we’ll need to see some positive action for this happen, but it’s one we’ll be watching closely.
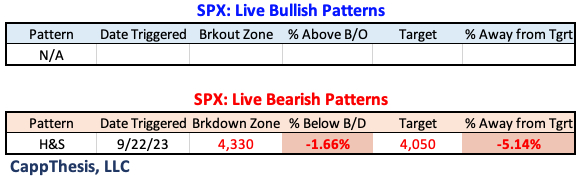
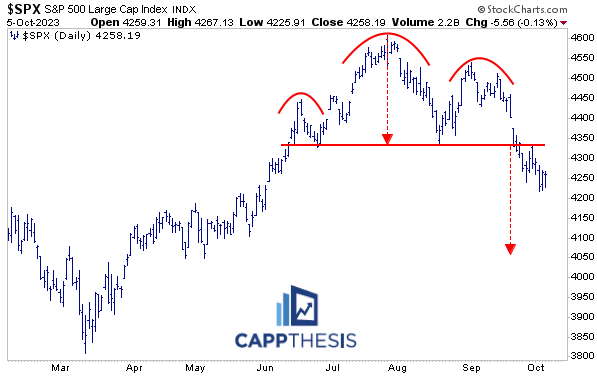
Patterns
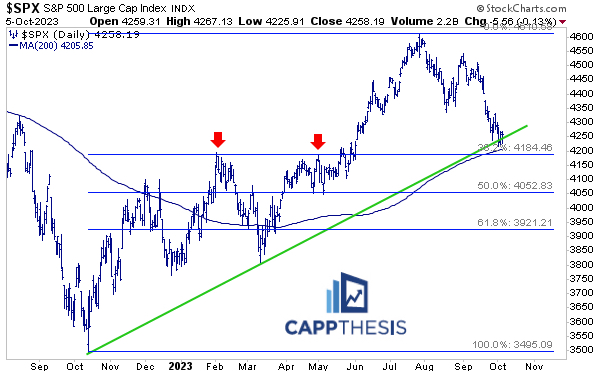
The 4,050-downside target still is in play.
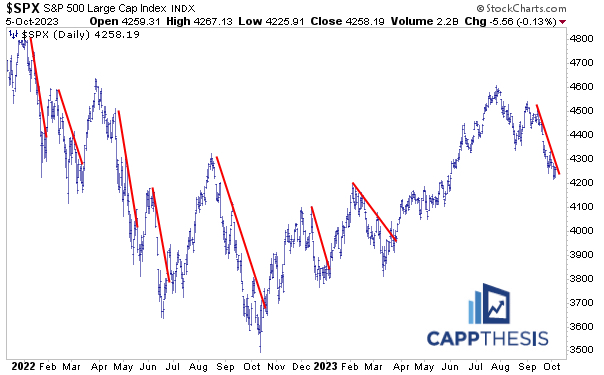
Here’s one truth: Since the start of 2022, the best multi-week bounces all started after the SPX broke above steep downtrend lines. The index continues to flirt with breaking the most recent line now.
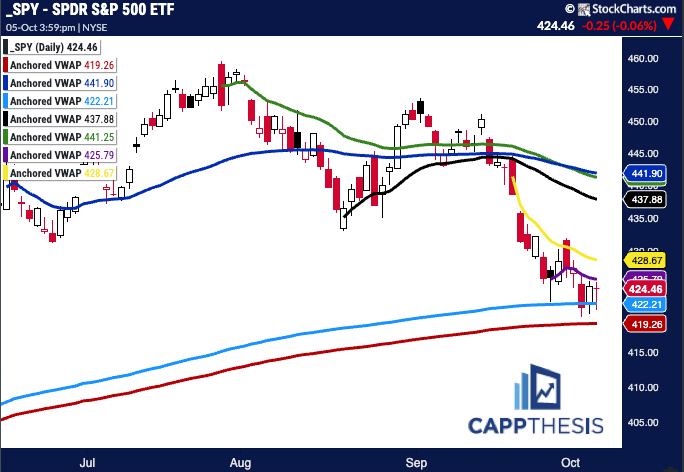
SPY AVWAP
SPY remains below the 9/27 Anchored VWAP (purple), but it again bounced at the line tied to the 2/3/23 high (light blue). This is important to hold, as it lines up with the 4,200 zone for the SPX.
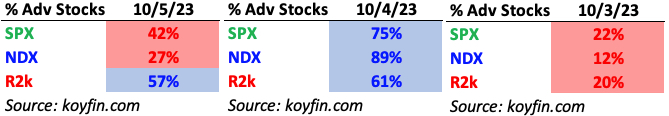
Breadth
Breadth pulled back yesterday, but Small Caps outperformed.
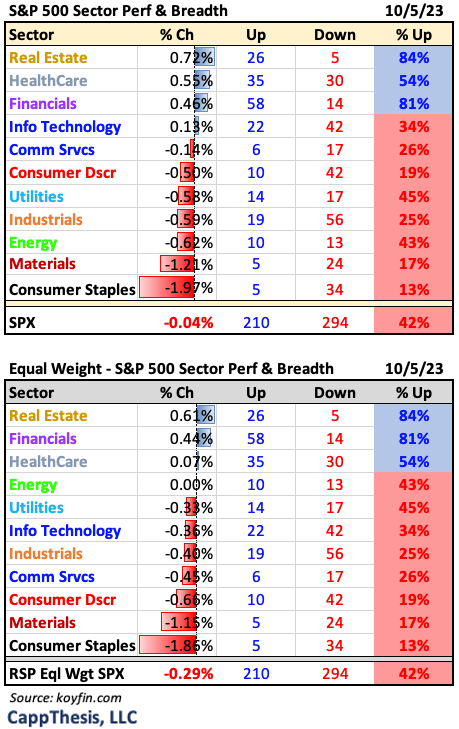
Sector ETFs
Just three sector ETFs had positive breadth yesterday.
Best and Worst 20 ETFs
A lot more ETFs we track lost 1% than gain 1% on Thursday.

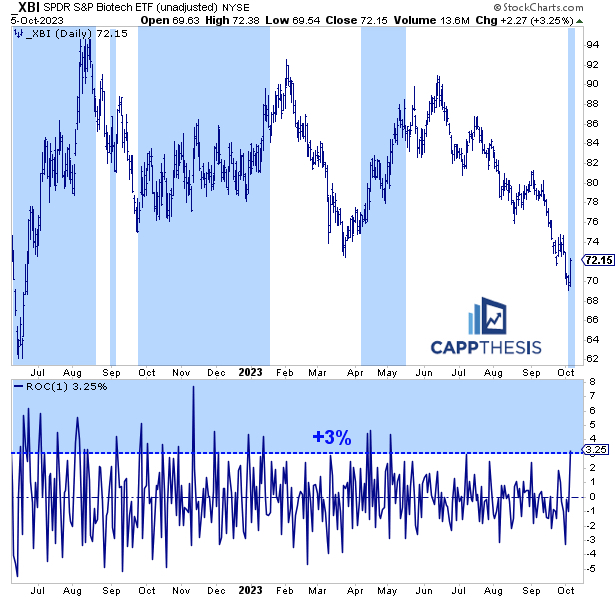
XBI Biotech
XBI logged its biggest advance since May 3rd yesterday. This could be important: Highlighted below are the periods when XBI logged its first 3% gain through its last 3% gain since June’22. The majority of the time, 3% advances occurred in clusters and XBI rallied for an extended period. A 3% gain only happened during a downturn once (September’22.).
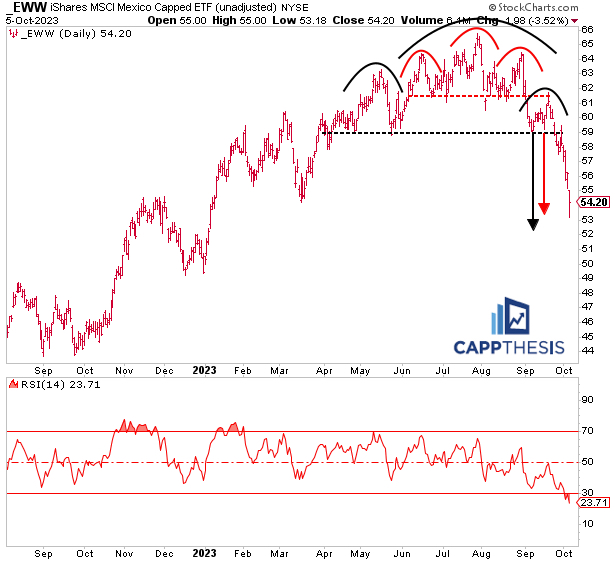
EWW Mexico
EWW got hit hard yesterday and hit a downside target from one of the TWO bearish patterns we referenced over the last few weeks. The other one is close to being attained, too. Its RSI now is the lowest since 11/26/21 – which marked a key low. In other words, it’s getting washed out short-term. It’s all about how the next rebound effort is treated now.
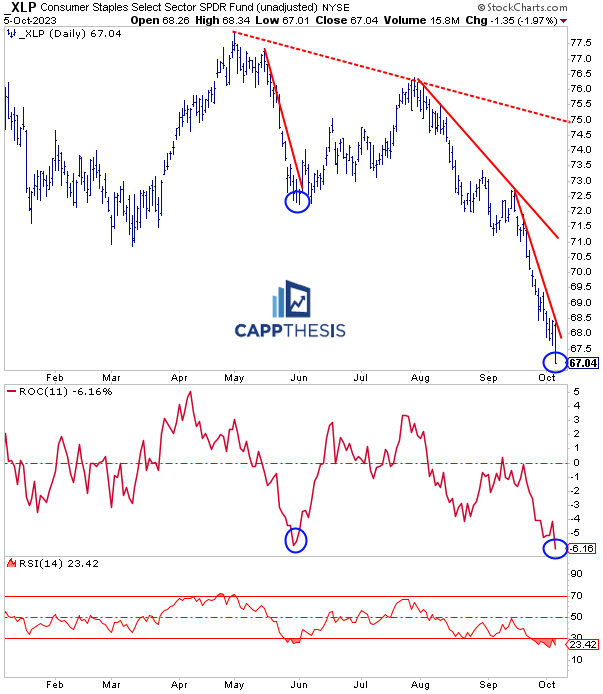
XLP Consumer Staples
XLP was down nearly 2% on Thursday, which continued its bearish run. It’s now down 9/11 days and has declined 6.2% over those 11 days, which lines up with a similar 11-day run from the period ending 5/30.
As is clear below, that marked a key trading low, as the XLOP broke a steep downtrend lien soon thereafter. It’s in a similar set up again now and potentially could see a snap back effort soon.
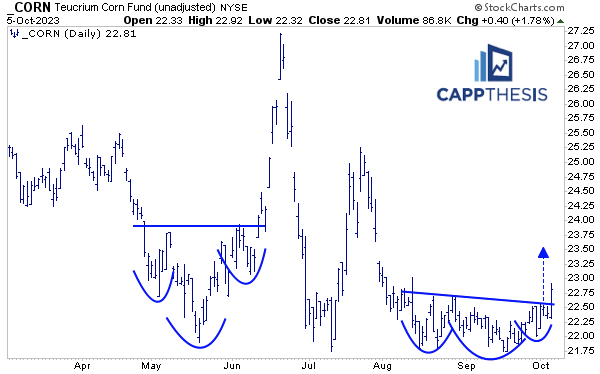
CORN
The Corn ETF broke out of the bullish pattern we profiled in Tuesday’s Opening Look. It was the highest close in over two months, and its upside target is near 23.50. That’s not a big move, however, hitting the target could kick start more positive momentum. This happened in June in an exaggerated way. We don’t expect a repeat of that, but CORN has proven to be volatile in 2023.