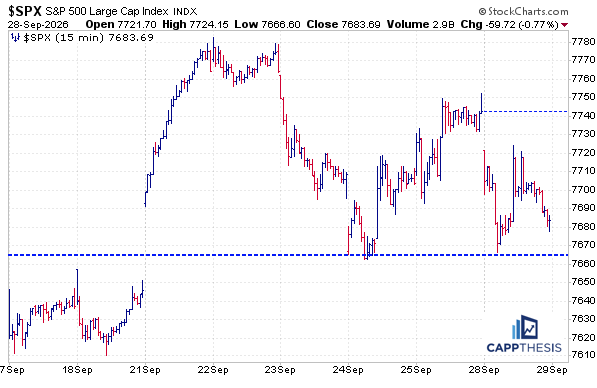
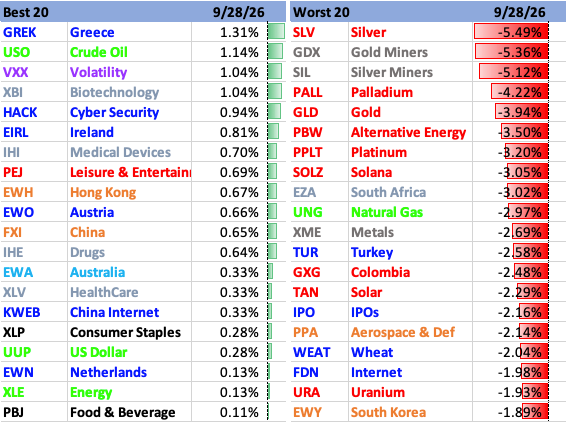
The SPX endured its second-worst decline of September yesterday, falling nearly 80 basis points. However, it once again avoided a 1% decline, extending its streak without one to 42 consecutive sessions, with the last occurring on July 29.
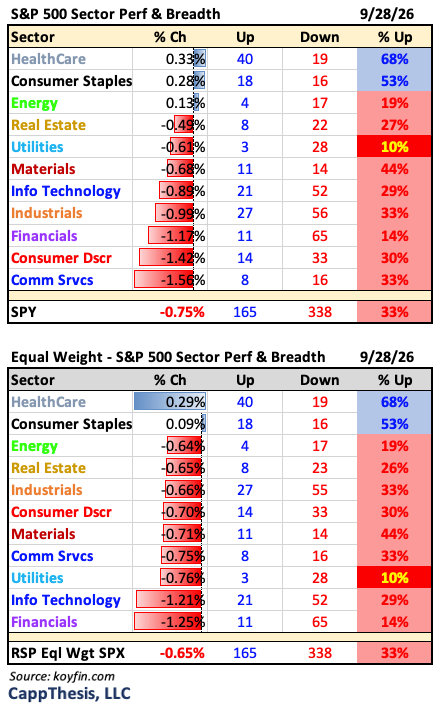
While conditions have remained relatively calm on the index surface, breadth has continued to deteriorate. In fact, the relative performance of the SPX versus RSP, the equal-weight ETF, now has reached overbought territory. We’ll focus on what that widening divergence could mean today, among other key topics.
Daily Price Action
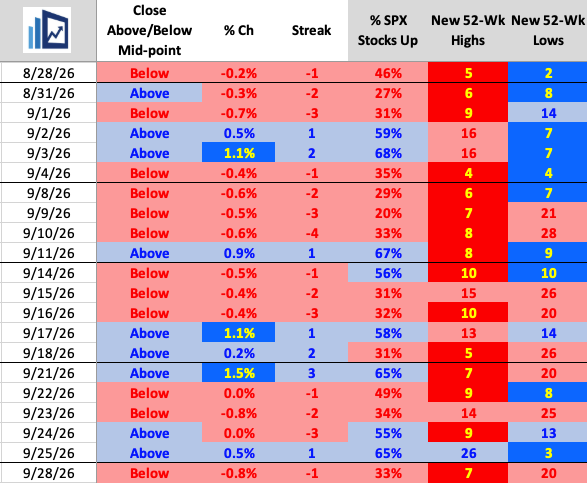
The SPX has endured losses in four of the last five sessions and still has yet to string together three consecutive days of positive breadth since August.
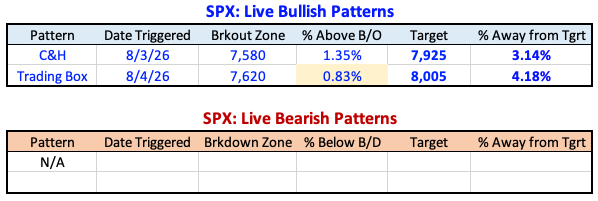
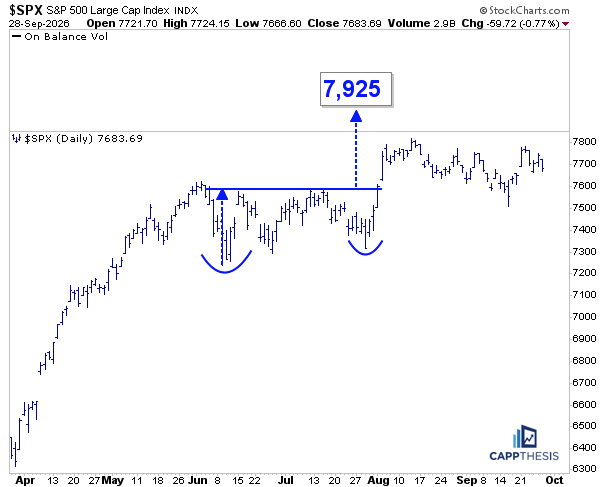
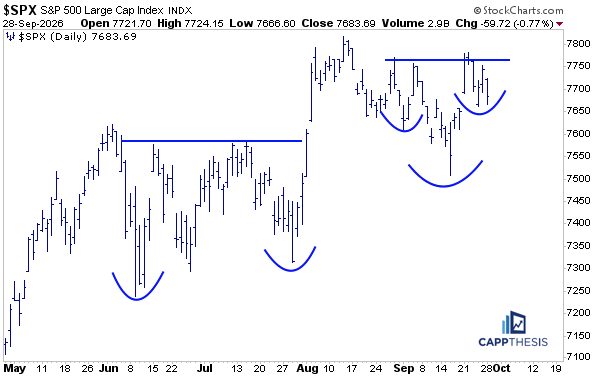
Despite the recent decline, both bullish pattern breakouts remain intact, along with their respective upside targets.
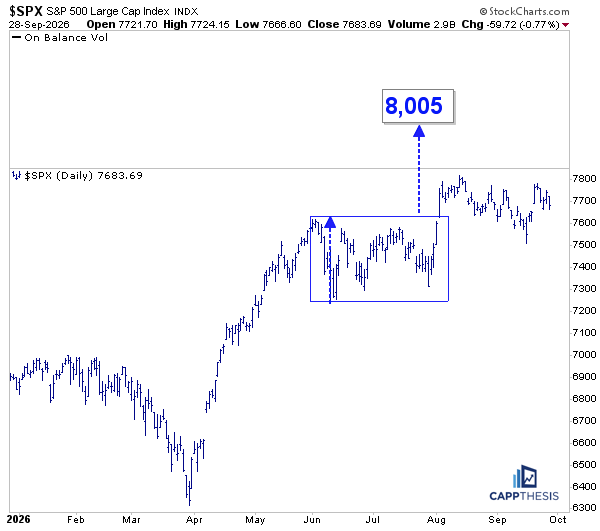
The potential bullish pattern also remains in play.
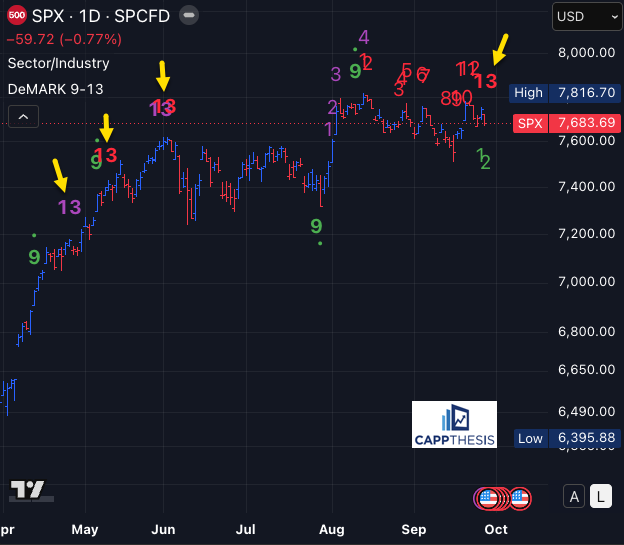
DeMark Sell 13
One notable change came from the DeMark indicators. As we’ve been discussing, the TD Sequential count finally triggered a Sell 13 yesterday, as shown on the chart.
This marks the fifth Sell 13 since the market began recovering in the spring. Two triggered simultaneously in late May, and those were the only signals that preceded a meaningful change of character, with the SPX declining over the following week before consolidating for the ensuing two months.
What makes this particular Sell 13 interesting is that the entire count developed while the SPX generally has been trending lower. In other words, it didn’t follow a major upside extension that created an obviously stretched condition, as was the case from late March through late May.
We won’t get into the complexities of the indicator, but the count tells us there have been enough strong short-term price moves, with relatively limited intraday pullbacks, to trigger a potential exhaustion signal. At the same time, breadth already has been deteriorating for several weeks, as many areas of the market already have been hit relatively hard.
Thus, this potentially says more about the remaining leaders—particularly large-cap Technology—becoming short-term stretched than it does about the broader market. Regardless, we always treat a Sell 13 as a potential warning sign, not a sell signal, with the pattern work remaining our primary guide.
SPX vs. RSP
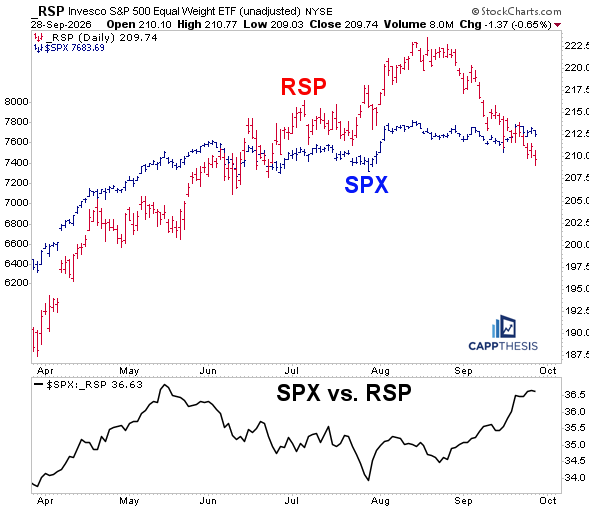
In this light, we can see how RSP, the SPX equal-weight ETF, topped in mid-August and has been rolling over ever since. It now is teetering on the potential topping pattern we reviewed last week.
At the same time, the SPX remains noticeably above where it traded in late July, pushing the SPX/RSP relative-strength line (bottom panel) into a distinct uptrend over the last two months.
That followed roughly two months of underperformance, when Technology rolled over and non-Growth areas stepped up to support the broader market. The question now is whether this ratio is due to reverse lower once again, which would indicate renewed relative strength outside of large-cap Growth…
SPX/ RSP Now is Overbought
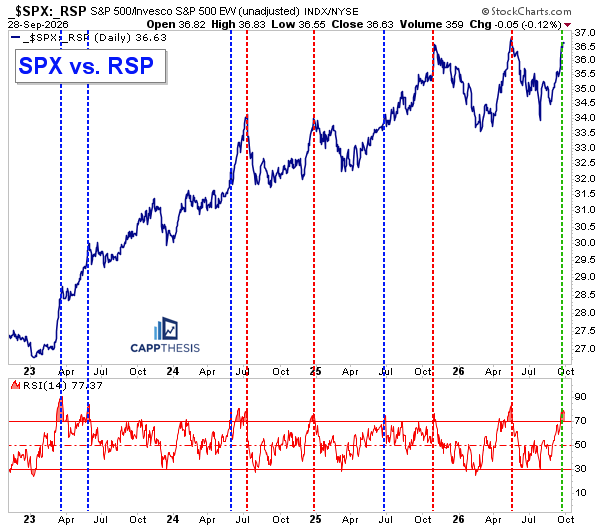
This is the same SPX/RSP relative-strength ratio, going back to the beginning of 2023. As highlighted on the chart, we’ve identified each time the 14-day RSI pushed noticeably above the overbought 70 threshold.
In most cases, a rollover in the ratio followed relatively soon afterward, as depicted by the red vertical lines. Most recently, this occurred in October of last year and again in late May/early June of this year.
That’s particularly noteworthy with the ratio itself now returning to the same area where it peaked twice over the last 13 months. However, an overbought reading hasn’t always resulted in an immediate reversal. The blue vertical lines highlight periods when the SPX/RSP ratio simply continued higher, as large-cap Technology’s relative outperformance persisted. We saw this from 2023 into 2024 and again in the middle of 2025.
With September ending tomorrow, the fourth quarter starting and another earnings season about to begin, this relationship will be an important focal point going forward.
Does large-cap Technology begin to roll over again, allowing relative strength to shift elsewhere?
Or do the numerous bullish patterns we’ve been profiling within large-cap Technology continue to gain traction? Many already have broken out, potentially setting the stage for additional upside despite the SPX/RSP ratio reaching an overbought condition.
The best-case scenario would be large-cap Technology continuing to lead while buying interest finally returns to the areas that recently have been rolling over.
That would create a much broader and more constructive trading environment heading into the fourth quarter, potentially setting the stage for a year-end chase. We’re not there yet, but this will be one of the most significant relationships to monitor as the fourth quarter begins.
IHI Medical Devices
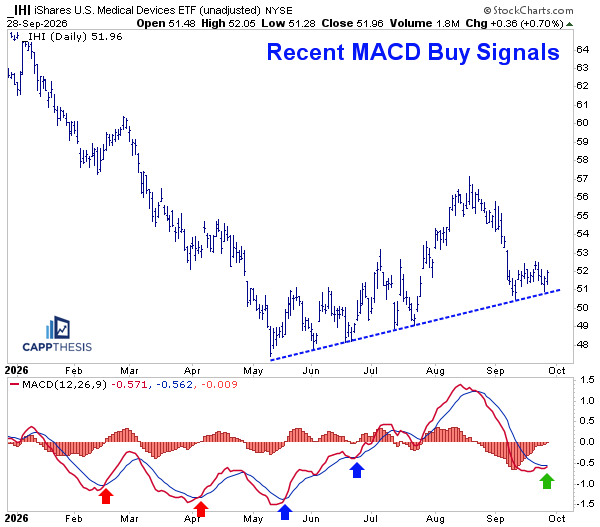
We haven’t touched on IHI, the Medical Devices ETF, in a while. This was one of the key areas within Healthcare that we identified as a potential reversal candidate when its chart began to improve in the spring.
One of the early signals was a MACD Buy signal, which eventually was leveraged as IHI began making higher lows. Bullish patterns formed, breakouts followed, and the advance continued until IHI rolled over in August.
It has been searching for a bottom ever since and now is attempting to hold above the same uptrend line it has respected for the last several months. At the same time, another potential MACD Buy signal is close to triggering, with just another day or two of upside follow-through likely needed to make it official.
The best-case scenario from here would be seeing that follow-through push IHI back above its recent trading range near 52–53, which could help generate renewed upside momentum.
GLD Gold
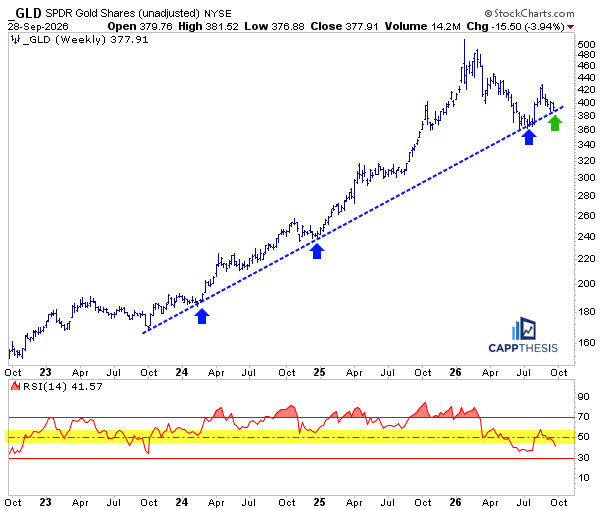
Precious Metals were hit hardest among the areas we tracked yesterday, making this an important spot for Gold and the broader group to see buying interest return. This is best seen on the weekly chart, with GLD now pulling back to the same uptrend line that has produced several major buying opportunities over the last two-plus years.
The difference this time is that the 14-week RSI has struggled to remain in the upper half of its range, something we ultimately would expect to see in a sustained uptrend. For now, seeing RSI form a higher low and avoid falling much further below its current level in the low 40s would be a constructive development.
10-Year Yield
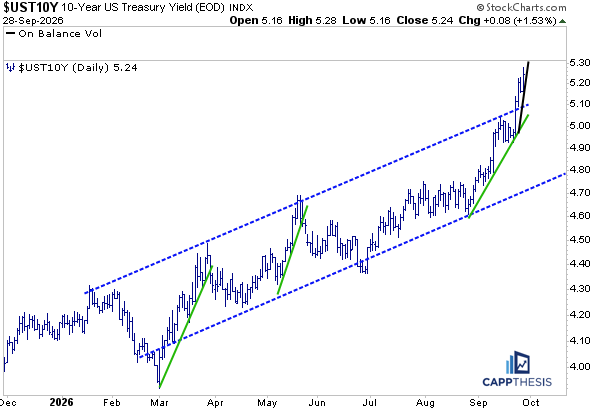
As we know, one of the bigger reasons for yesterday’s pullback was another sharp spike in rates, with the 10-year yield reaching nearly 5.3%. At this point, the move has become increasingly extended following its surge over the last several weeks.
Recall that in September, we were watching the yield approach the upper boundary of the upward-sloping channel that had contained it throughout the year. Similar multi-week surges in March and May ended with the yield reaching that upper boundary and subsequently pulling back.
This time has been different. In early September, rather than rolling over and breaking the smaller uptrend line shown in green, the 10-year yield bounced following the Fed meeting and has since pushed decisively above the channel’s upper boundary. Over the last week alone, the short-term advance has become nearly vertical.
We know that this type of move is unlikely to be sustainable indefinitely. Thus, we’ll continue watching for a break of the shorter-term uptrend line, which would provide the first indication that a more meaningful pullback in yields could be developing.
US Dollar
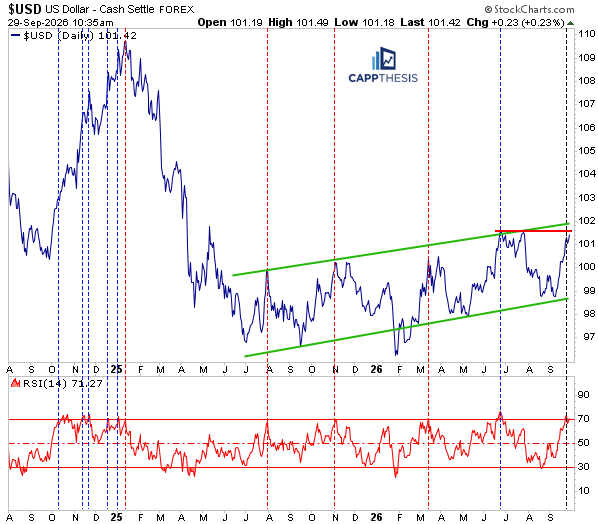
One reason many areas outside of Technology have been selling off is that the U.S. dollar has been moving sharply higher alongside yields in recent weeks, pushing decisively above 100. The move also has produced the dollar’s first overbought reading since June.
The dollar now is at an important technical juncture. Yesterday’s close was near the same area where it topped in June and again in July, while also approaching the upper boundary of its own upward-sloping channel.
Thus, there is a confluence of resistance developing just as the dollar becomes overbought. Similar setups have preceded pullbacks several times since August 2025, as highlighted by the red lines.
The notable exception occurred in late 2024, when persistent dollar strength produced multiple overbought readings that did little to slow the advance. That remains the risk today.
If the recent surge in yields continues and is accompanied by similar momentum in the dollar, the combination could remain a significant headwind for equities, as we’ve seen during prior periods, most notably in 2022.
For now, we’ll respect the dollar’s strength while recognizing that similar rallies have stalled or reversed four times over the last year-plus.
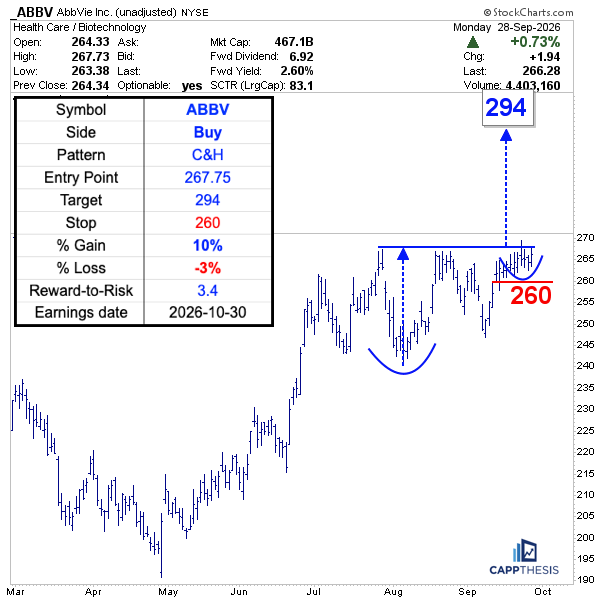
ABBV (AbbVie Inc.)
We continue to see compelling setups emerge within Healthcare. We’ve profiled ABBV several times on the watch list, and its ability to hold within the 260–270 area recently is enough for us to elevate it to a Chart Trades idea.
There are several ways we could construct the bullish formation, but we’ve chosen the larger version, which resembles a clear potential cup-and-handle pattern.
A breakout above the recent resistance area near 275.75 would trigger the formation and produce a 294-upside target. While that isn’t a huge move, it would take ABBV decisively above its recent highs.
We’ll use a relatively tight 260 stop-loss, which sits below the clear handle of the pattern. ABBV reports earnings on October 30, giving the setup roughly a month to potentially play out.
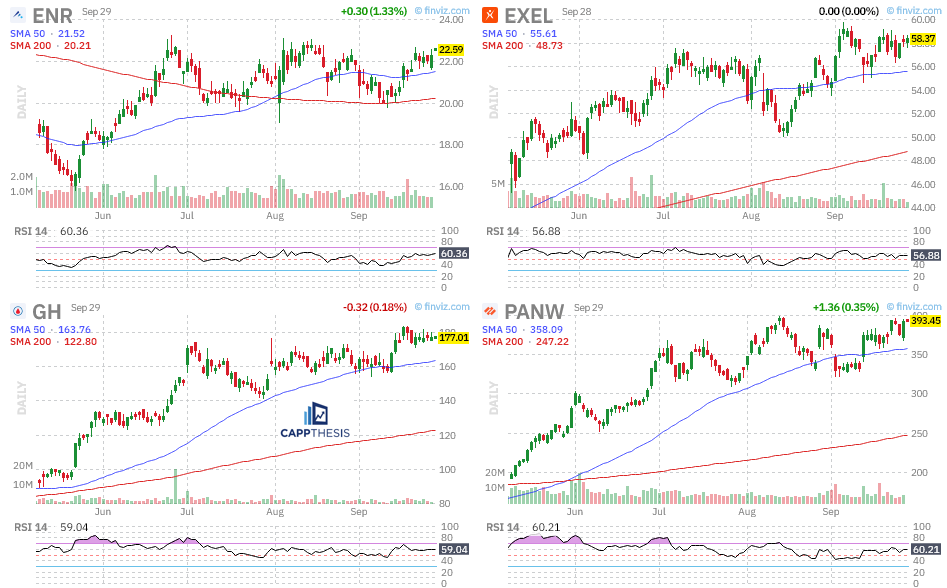
Watch list: ENR, EXEL, GH, PANW