


Shakeup

Shakeup

Shakeup


A 1% Decline
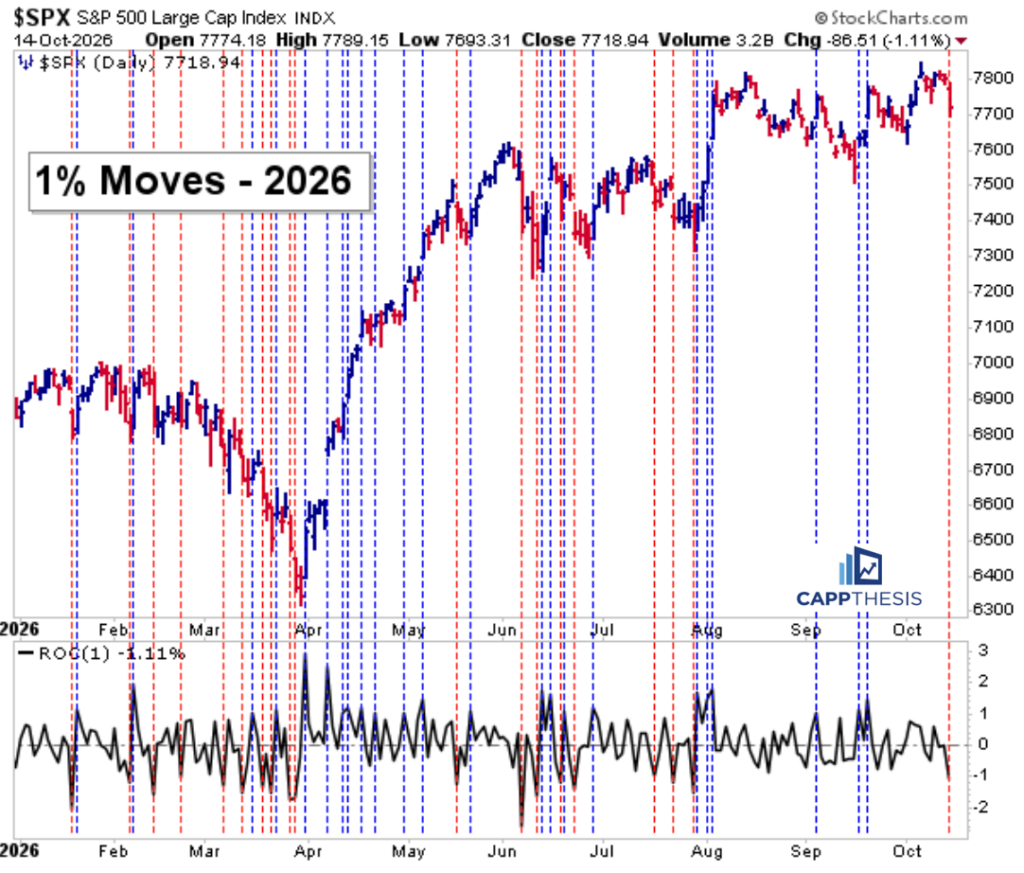
The SPX’s reaction to the higher-than-expected CPI report produced its first 1% decline since July 29, ending one of its longest stretches without one in recent years.

1% declines rarely occur in isolation, and over the last year, many have been followed by similarly large moves in the opposite direction. So, 1% gain wouldn’t be surprising to see again soon, although that likely would require a near-term rebound in Technology.

The concern, of course, is that we’re now entering a new, more volatile trading environment, which is characterized by clusters of big moves.  That simply would make it difficult to trust pattern breakouts.  


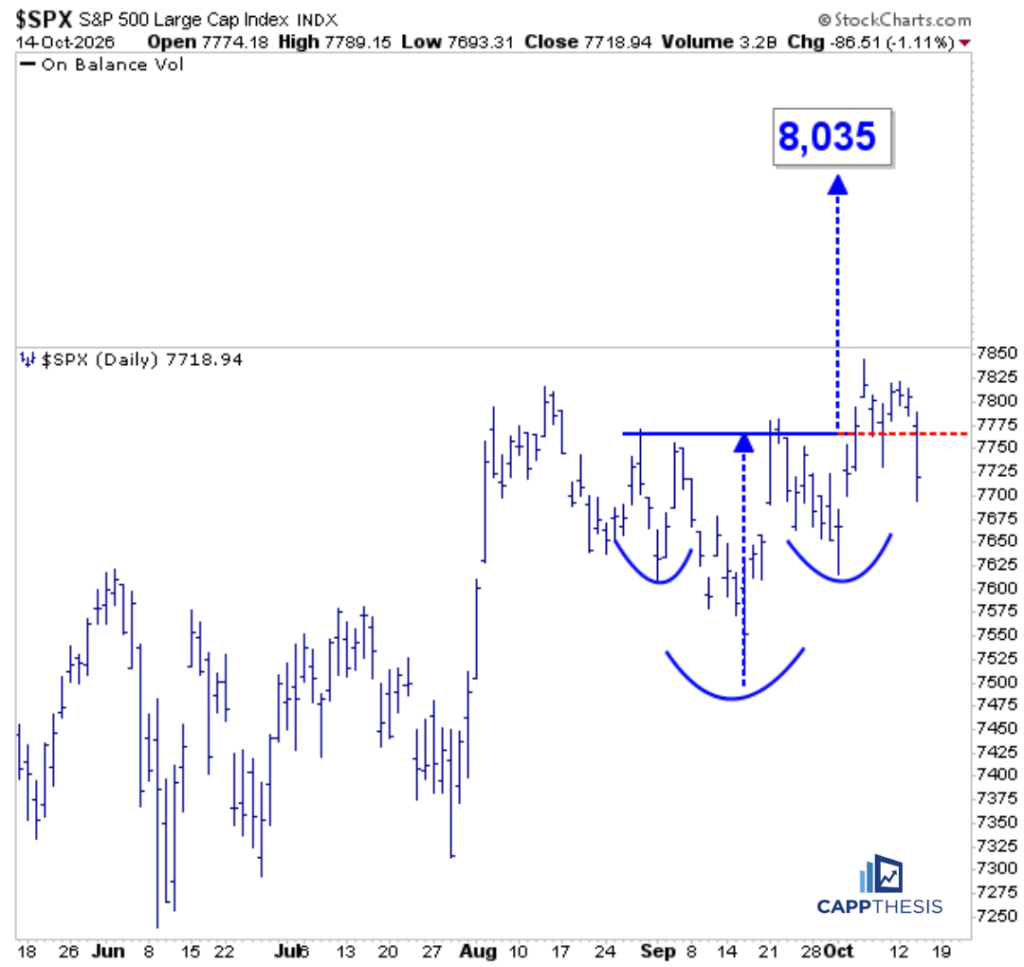
Breakout being tested
The big decline pushed the SPX back below its most recent bullish breakout zone, although the index remains above the pattern’s right shoulder for now. It’s all about the follow through or lack thereof now. 


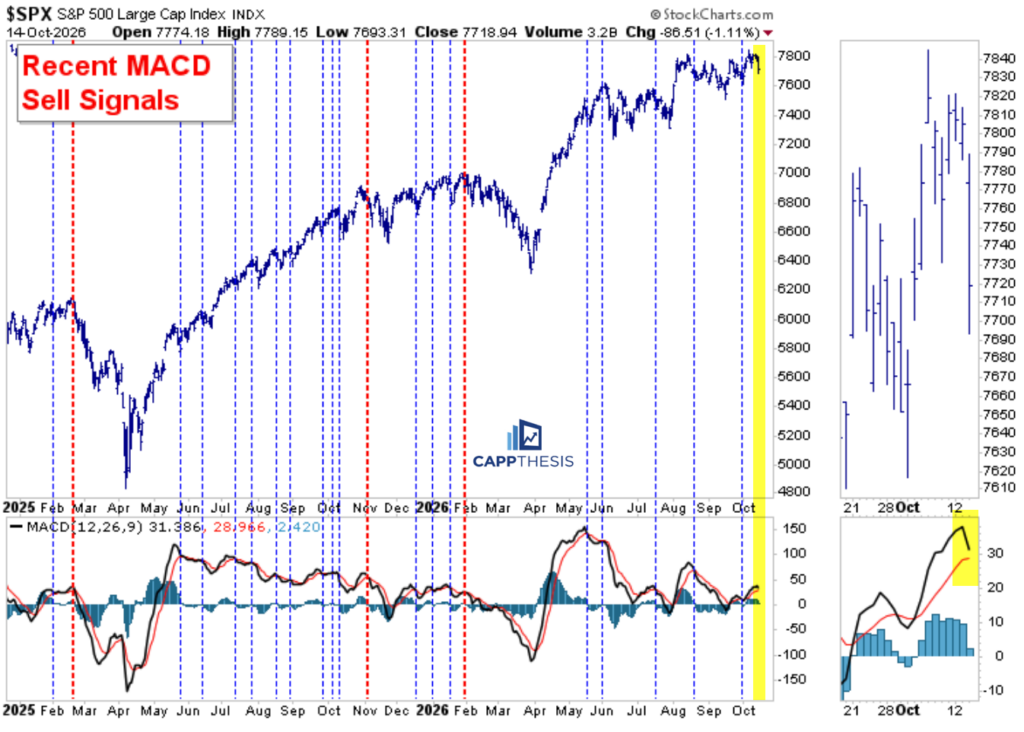
Impending MACD Sell Signal
Additional downside follow-through would trigger another MACD sell signal. The last five signals failed to produce further weakness, but as we’ve seen over the past two years, a string of failed signals doesn’t mean the next one won’t prove successful.


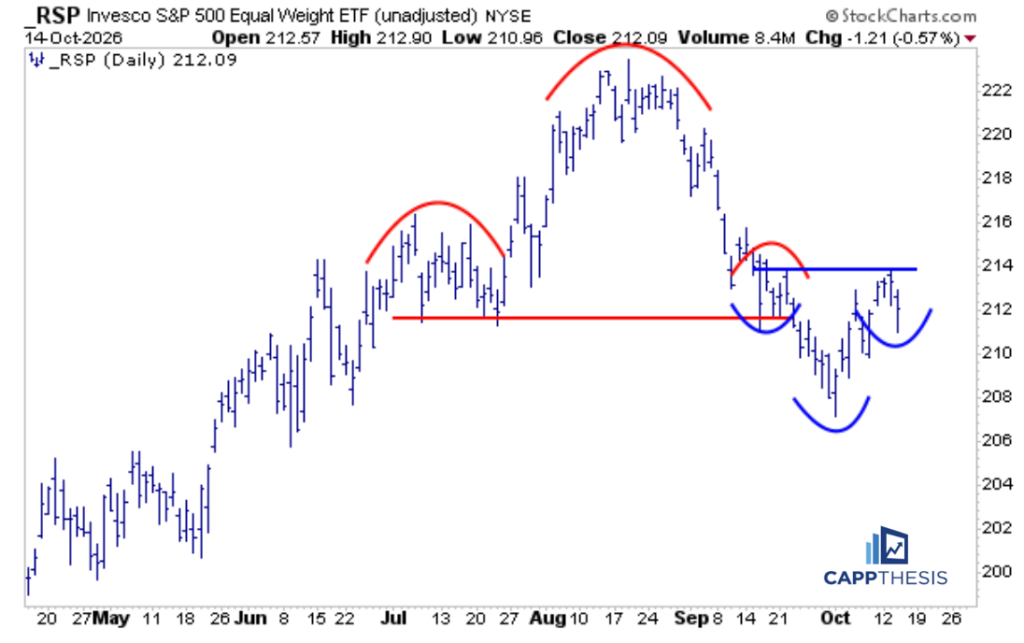
RSP Equal Weight SPX
The rotation away from Technology continued yesterday, with RSP declining considerably less than the SPX. As a result, its potential bullish pattern remains intact.


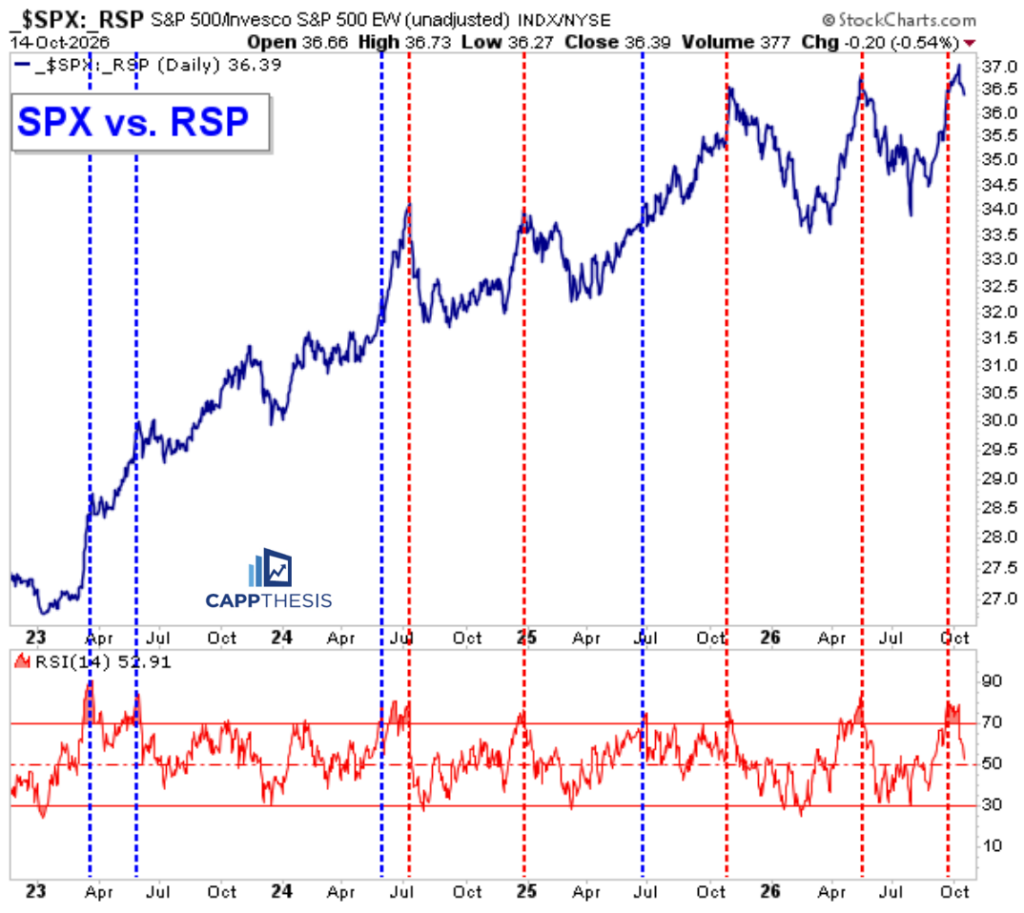
SPX vs. RSP
We highlighted this chart a few weeks ago, noting how the SPX had become overbought relative to RSP. The ratio has since rolled over, raising the question of how much further it could decline. Similar reversals since last fall produced clear downside follow-through that lasted for months.


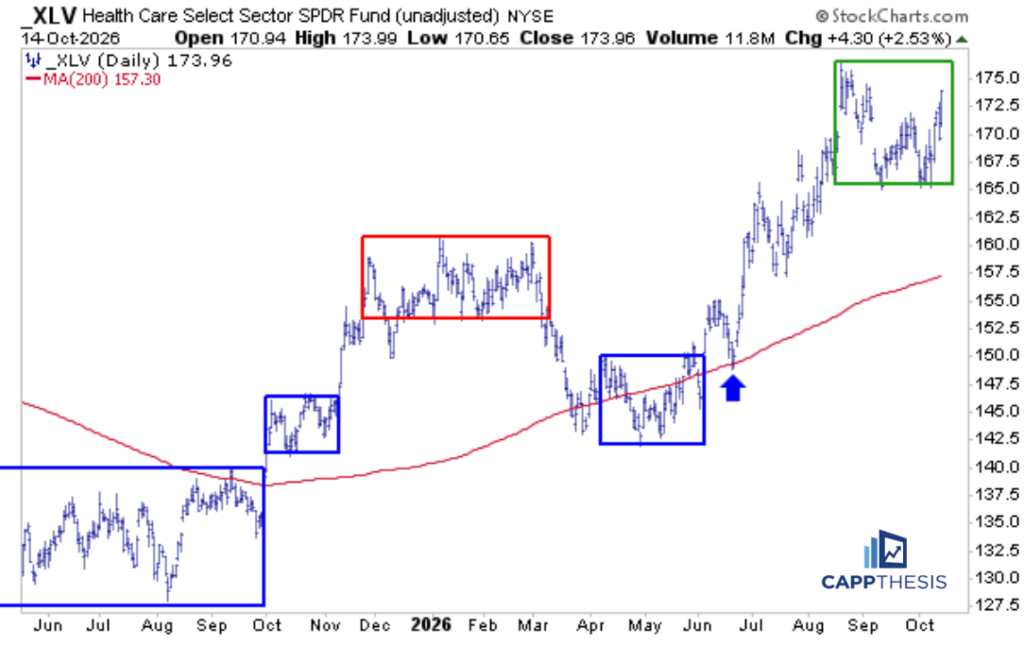
XLV Healthcare
Healthcare was yesterday’s best-performing sector, with XLV continuing to rebound from the lower end of its trading box. The ETF is higher again this morning and could soon test a new high.


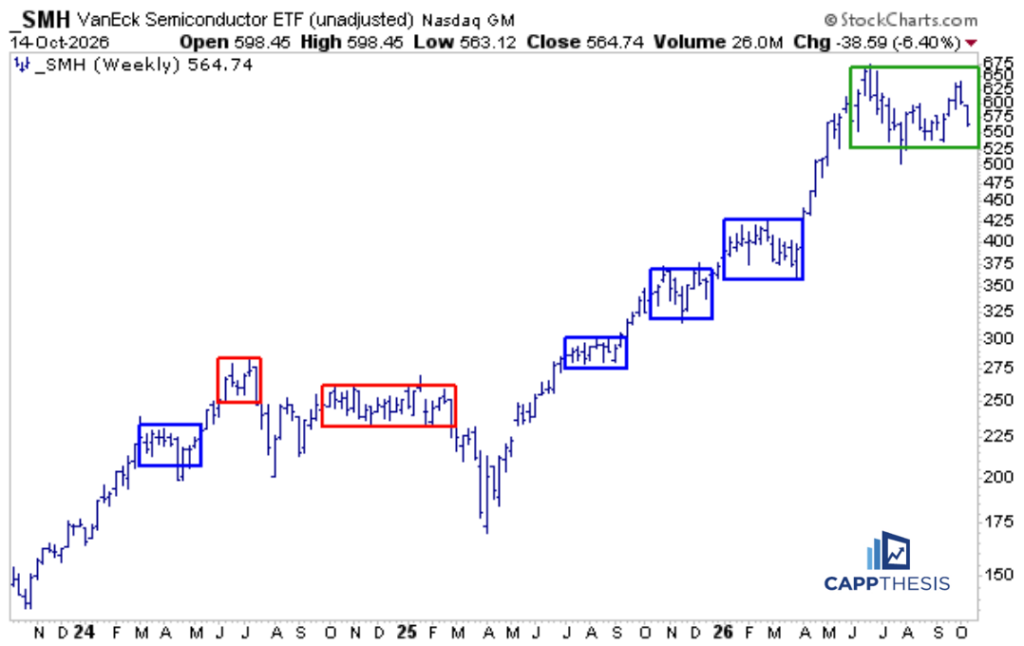
SMH Semis – Weekly Trading Boxes
SMH was hit hard on Wednesday, and looking at the weekly chart, the past few years can be characterized by a series of trading boxes. Additional weakness could bring the ETF close to testing the lower boundary of its most recent trading box, which has been developing over the past several months. With very little support under that area, the risk implications are clear.


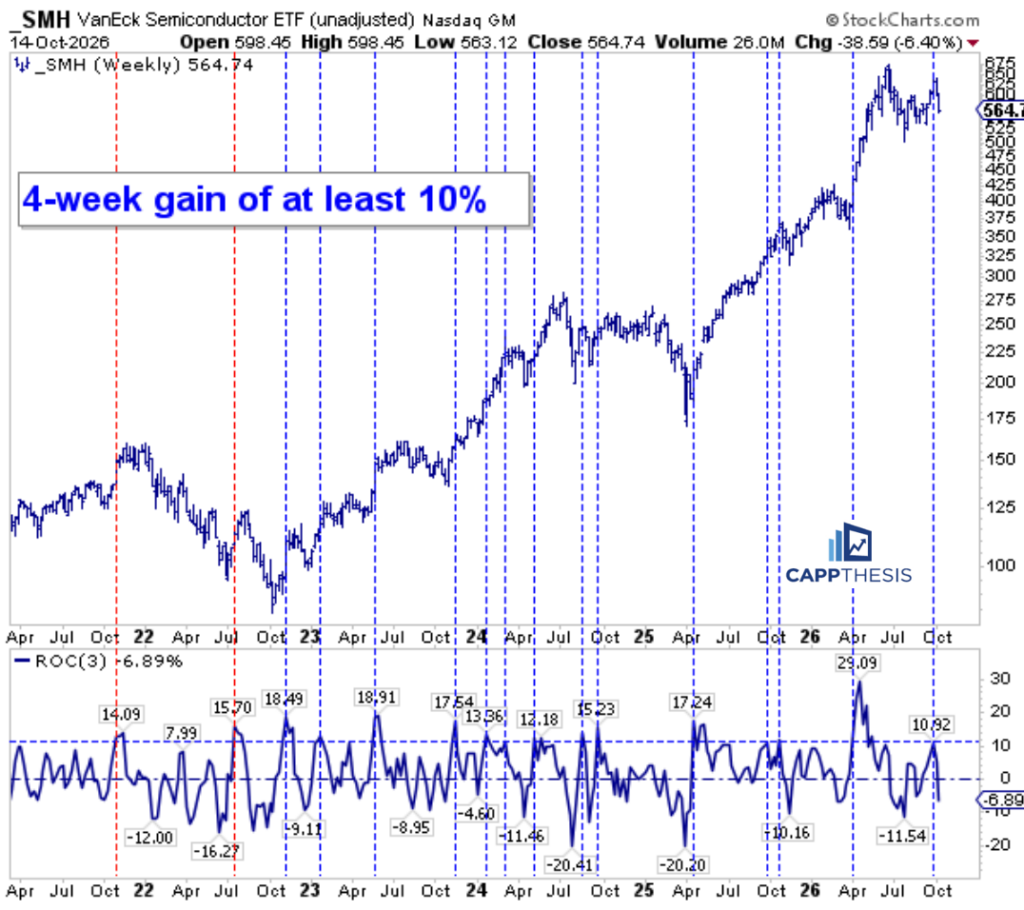
SMH – 4-week Gains of at least 10%
We recently highlighted how SMH had gained more than 10% over a four-week period, noting that most previous instances led to additional upside follow-through. The two exceptions occurred in late 2021 and mid-2022, just before and during the bear market.


TLT
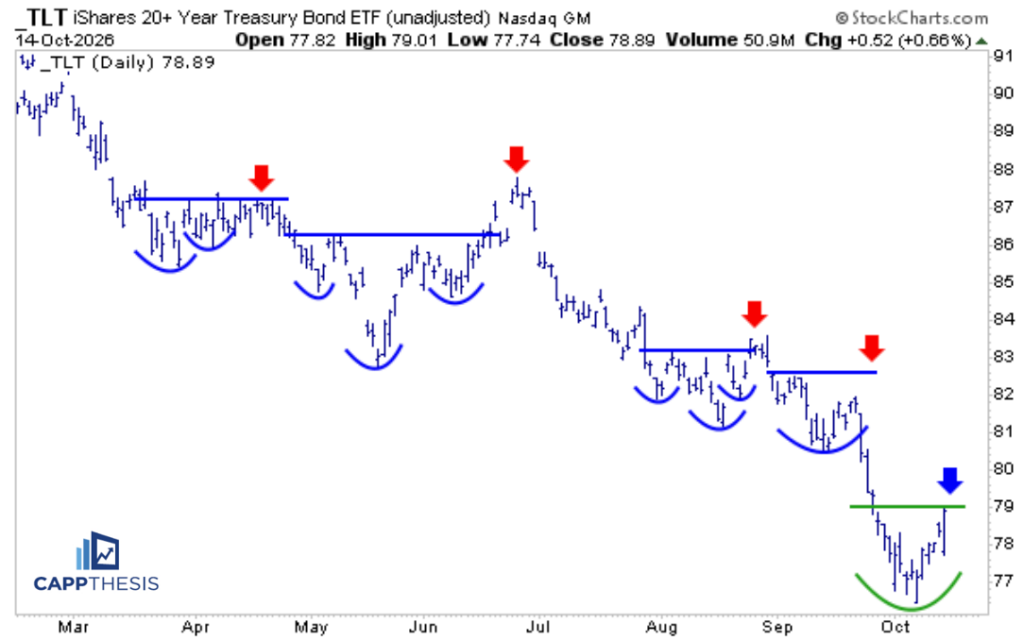
The big story was the move in bonds, with TLT staging a sharp bullish reversal and seeing additional upside follow-through in premarket trading today. A pattern breakout now is under way, with the next test coming as TLT approaches resistance in the low 80s.


XLP Consumer Staples
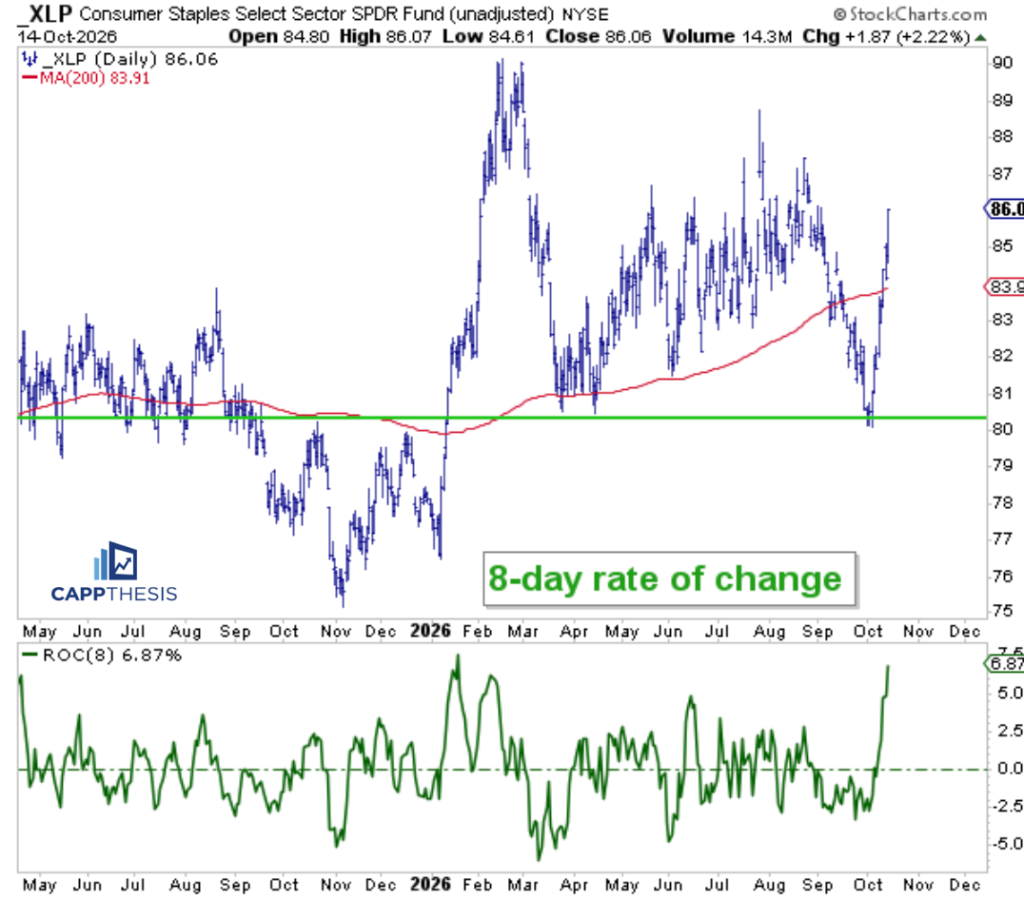
The snapback in XLP continued yesterday, bringing its eight-day gain to approximately 7%, the largest since the beginning of the year. This is clear evidence of a flight to safety, although the sharp advance makes it difficult to identify a tradable pattern. Regardless, the price action tells us a great deal about investors’ current risk appetite.


XLRE Real Estate
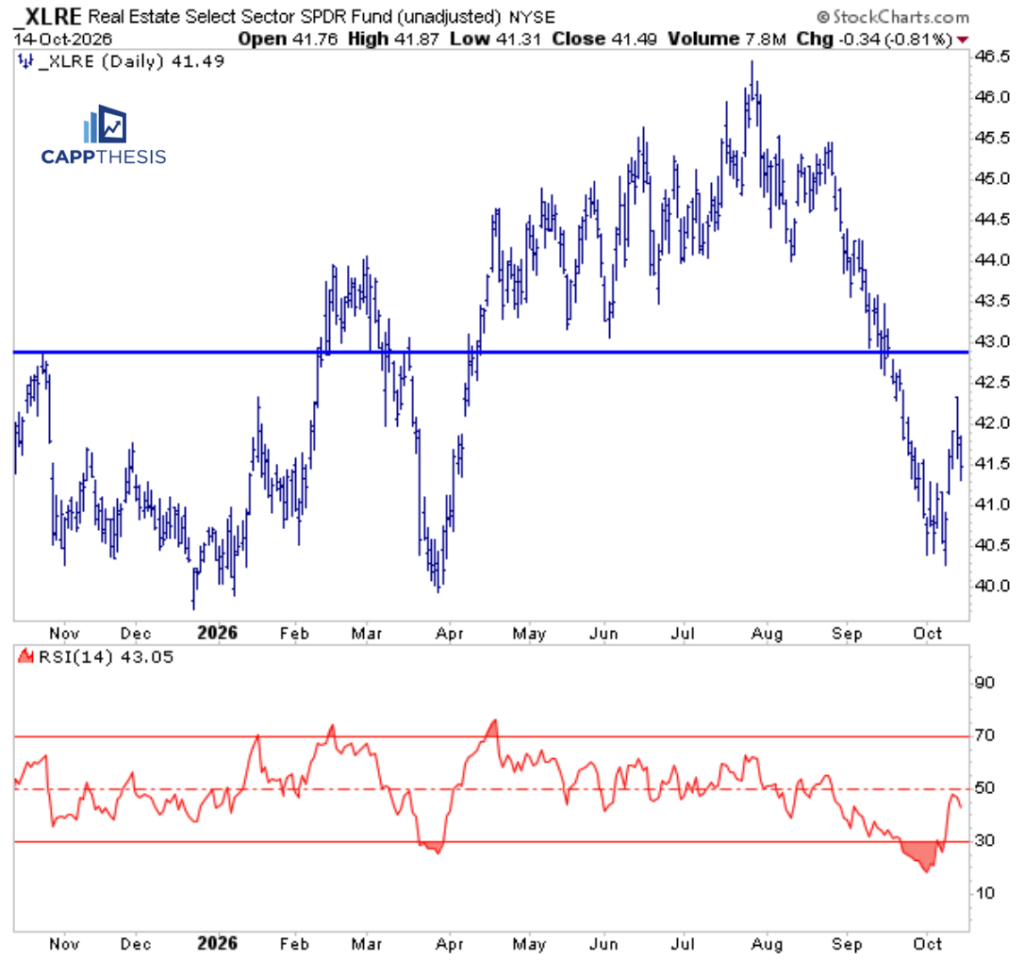
Real Estate (XLRE) has also rebounded from its lows, although not nearly to the extent of XLP. This remains an important sector to monitor, particularly if the pullback in Treasury yields continues and eventually translates into lower mortgage rates.


GDX Gold Miners
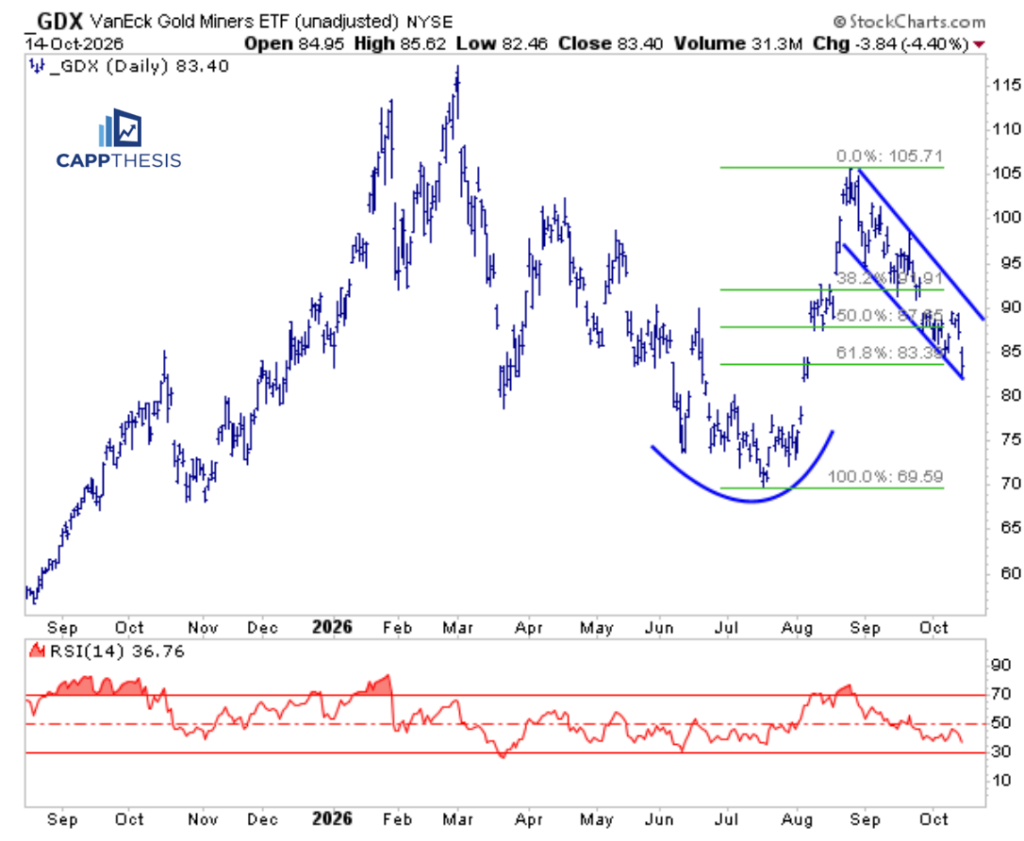
GDX Gold Miners was hit hard yesterday but finished off its lows, finishing near the 61.8% Fibonacci retracement of its summer rally. The ETF is seeing some buying interest this morning but remains within a downward-sloping channel. The next test will be how it responds if a rebound pulls it back toward the channel’s upper boundary.


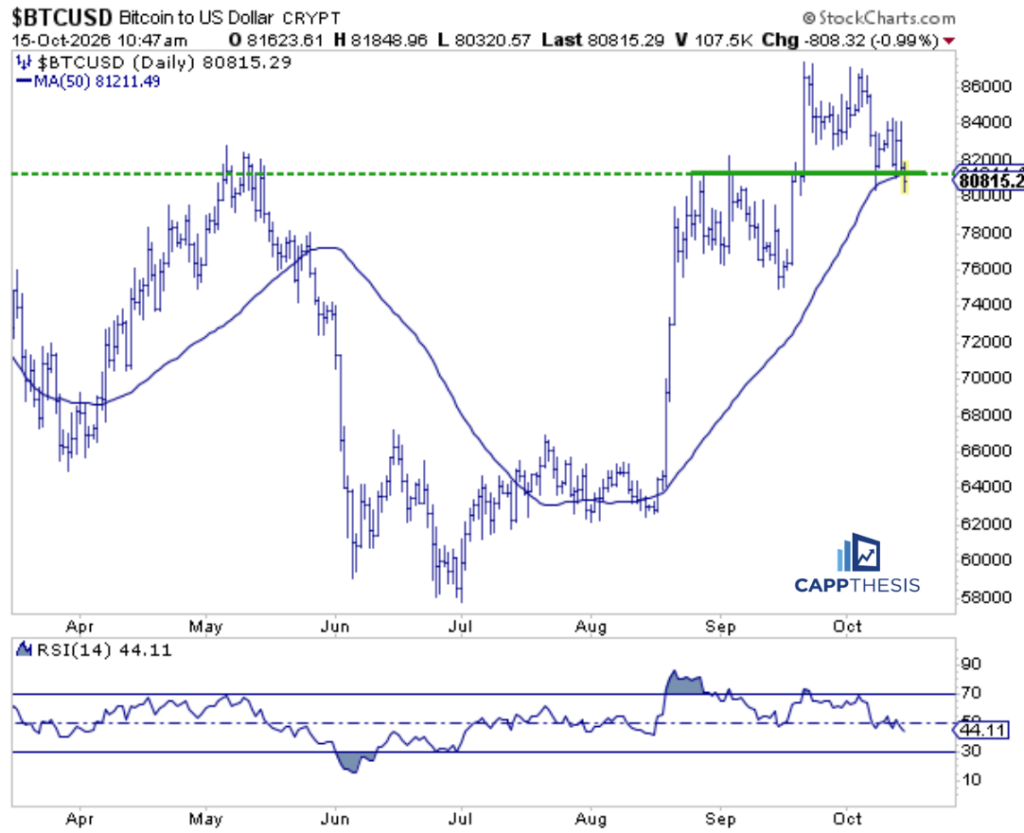
Bitcoin
This is a critical juncture for Bitcoin as it continues to test the 80,000 level, trading below its 50-day moving average with its RSI slightly below 50.


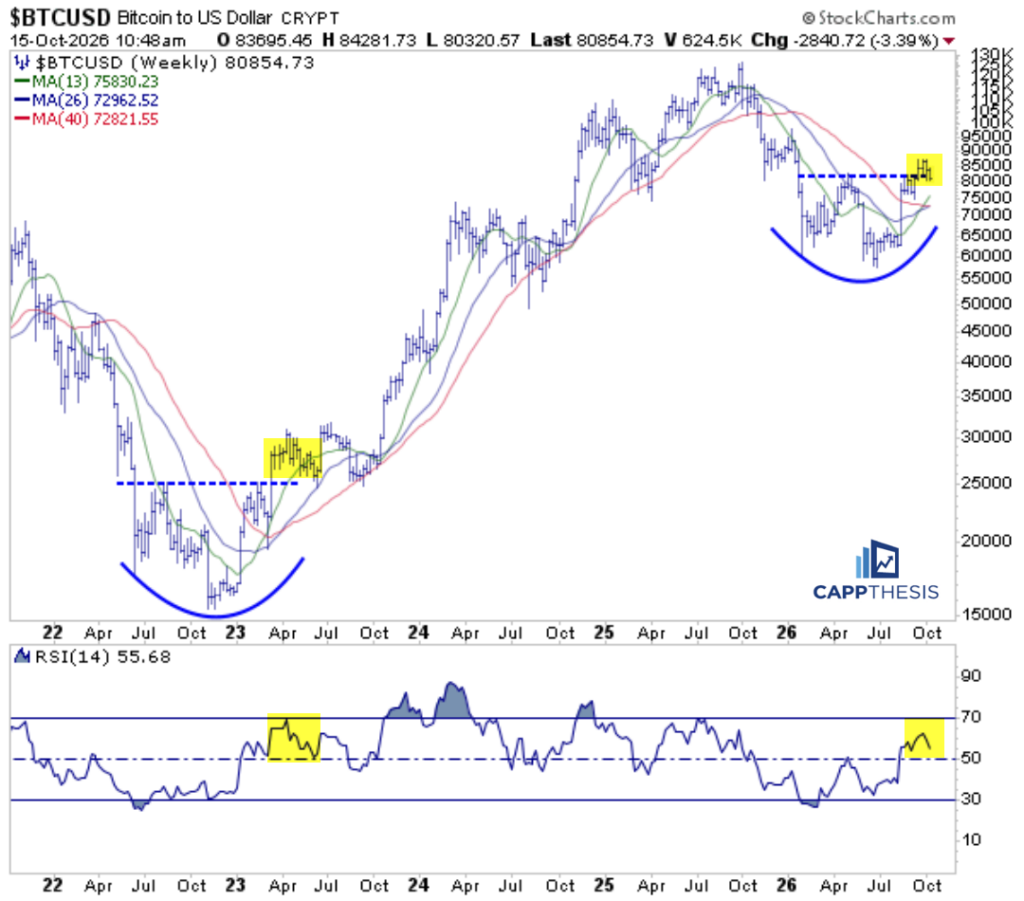
Bitcoin Weekly
Zooming out, Bitcoin’s weekly chart shows how the recent pullback toward its multi-month pattern breakout zone resembles the price action in 2023. The cryptocurrency is again testing a key area to keep the bullish formation intact.

Recall that the initial breakout in 2023 was briefly reversed, with Bitcoin undercutting the zone before demand returned and fueled an advance that extended into 2025. Similarly, the 14-week RSI tested the 50 zone for several months before bullish momentum took hold, much like we could be seeing now.

MORE LIKE THIS