

Topics Covered: -Weekly SPX –Weekly Breadth: SPX, NDX –Best 20 ETFs: XBI, SOCL –Worst...
Read More
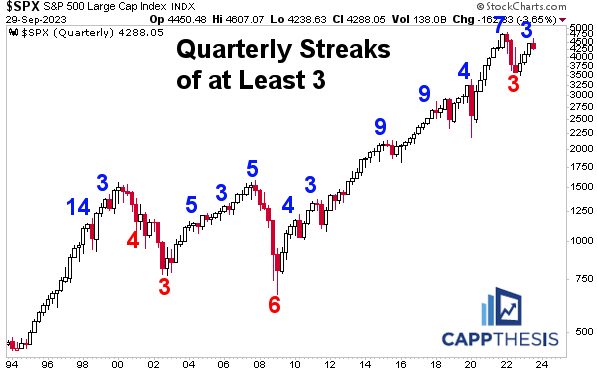
Topics Covered: SPX -Key Monthly Stats -Patterns -Monthly chart -After five straight up months end -May...
Read More
Topics Covered: -Weekly SPX –Weekly Breadth: SPX, NDX –Best 20 ETFs: SMH, KWEB –Worst...
Read More
Topics Covered: -Weekly SPX –Weekly Breadth: SPX, NDX –Best 20 ETFs: JETS, KRE –Worst...
Read More
Topics Covered: -Weekly SPX –Weekly Breadth: SPX, NDX –Best 20 ETFs: PALL, SIL –Worst...
Read More
Topics Covered: SPX -Monthly track -Monthly chart -Five straight up months -Patterns – March -Patterns...
Read More