Key Points:
1- The SPX remains below its breakdown zone but above the confluence of support it bounced near last week.
2- The RSP Equal Weight ETF was down 1.1% yesterday vs. the +0.1% move for the SPX. That puts RSP closer to its own downside target, as it’s now nearly to -11% from its high.
3– XLK Technology now is up 6/7 days and has formed a potential bullish pattern on the hourly chart. Given its recent relative strength, seeing how the formation progresses will be telling.
Topics Covered:
-Pattern update
-Key support
-AVWAP
-Index Breadth
-Sector Perf & Breadth
-Best & Worst 20 ETFs
-RSP
-RSP & SPX
-XLK
-XLU
-XBI
-CORN
SPX:
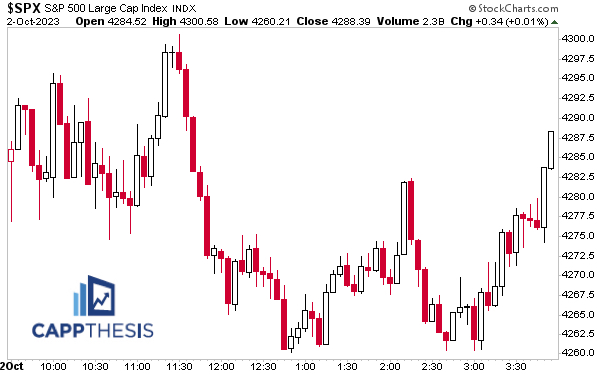
The SPX started another historically volatile month with the quietest result possible on Monday – a +0.1% move. Officially, it was the index’s third gain in four days, with the best part being its ability to rally in the afternoon.
Patterns
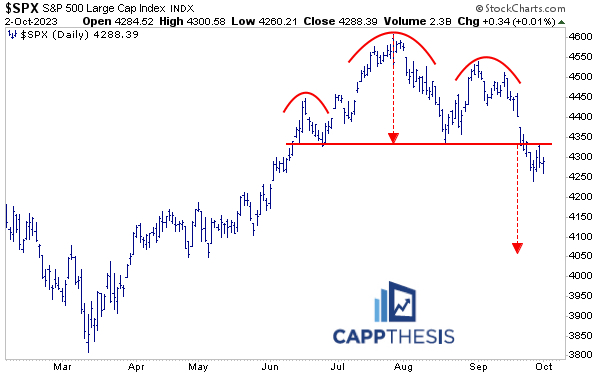
While the index has been fighting since triggering the big topping pattern, it has remained below the breakdown zone near 4,330. Thus, the 4,050-downside target still is in play.

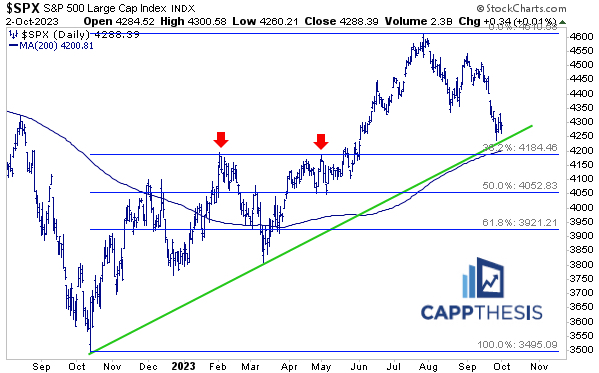
The index still is above the confluence of support though, which clearly is super-important to hold going forward:
1-The uptrend line from the October lows
2-The 38.2% retracement level of the entire October – July rally
3-4,200 round number significance
4-The 200-Day Moving Average
5-Key former high points from February and May
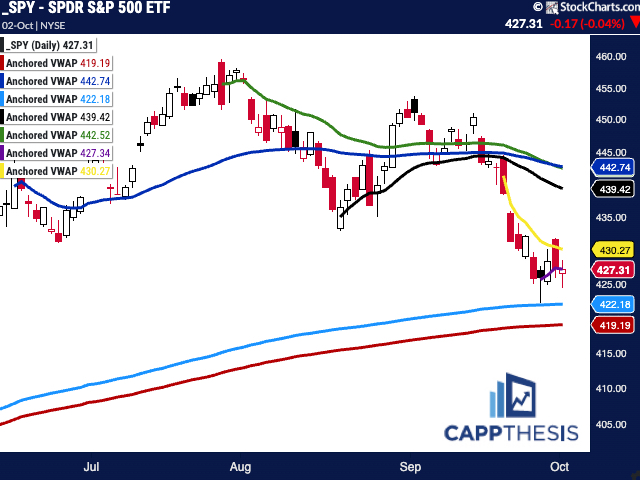
SPY AVWAP
We can add the most recent AVWAP line from last Wednesday’s pivot low (purple) as another key support line now, as well. SPY finished right on it yesterday again.
SPY remains below the VWAP anchored to the FOMC decision from 9/20. Reclaiming this mark would be a big accomplishment from a short-term perspective.
Breadth
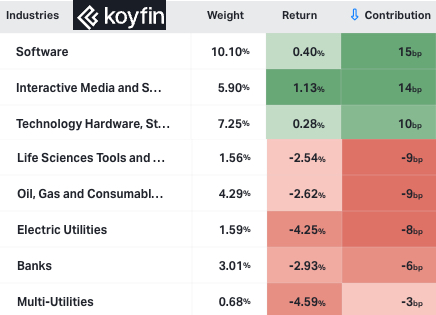
As noted below, leadership was unmistakable, with Big Cap Growth outperformance literally being responsible for the SPX’s ability to hold. Check out the huge difference between the SPX’s leading and lagging groups on Monday.
It’s quite rare to see various groups endure 2% selloffs and the SPX go unchanged.
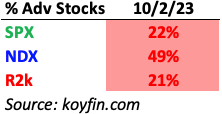
The separation was very evident from an index breadth perspective, too, with nearly half of the NDX’s components finishing higher vs. just 20% for both the SPX and R2k.
Sector ETFs
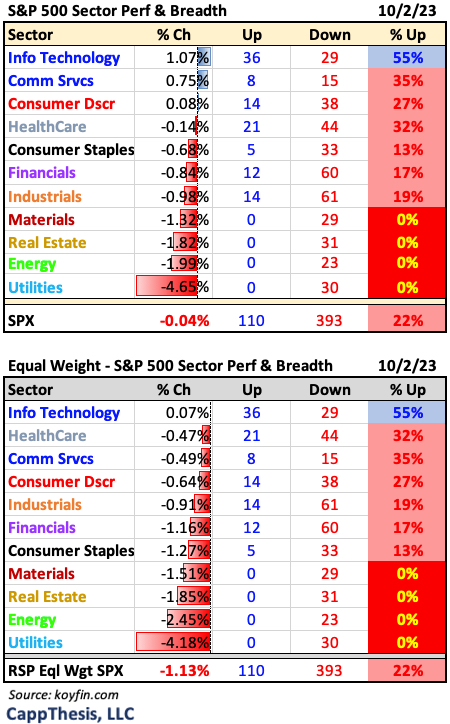
However, the bifurcation was most egregious from a sector view, especially when we compare the market weighted sectors to the equal weighted ETFs.
Four sector ETFs had ZERO advancing stocks – Energy, Materials, Real Estate and Utilities. As is clear, these are among the ones with the fewest holdings…
…while Technology – the biggest, of course – was the only sector with more stocks up vs. down. XLK was +1.1% vs. the RSPT Equal Weight ETF up just 0.1%.
Best and Worst 20 ETFs
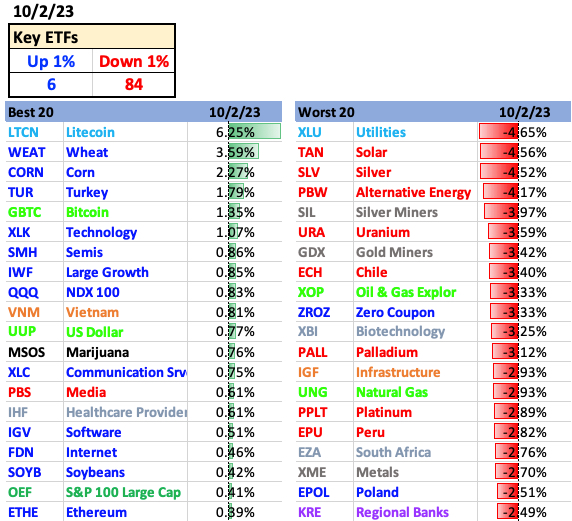
The lopsided showing was just as clear in our ETF breakdown, with 84 losing 1% or more vs. just six up 1%. The best 20 were dominated by blue (Growth), while there was a little bit of everything on the downside.
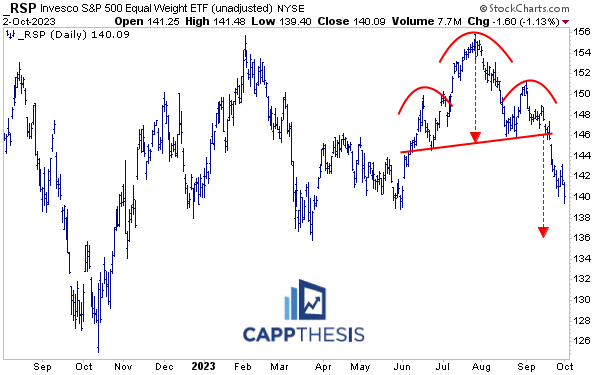
RSP Equal Weight S&P 500 ETF
RSP was down 1.1% as a result, as it has unraveled much more aggressively than the SPX has since breaking below this topping pattern.
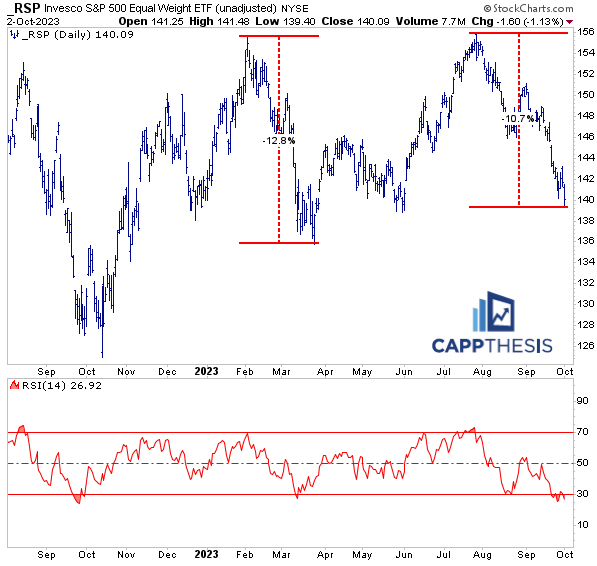
At its lows yesterday, RSP’s current drawdown got to -10.7% vs. -8.2% for the SPX so far. RSP’s pullback from February to March also was worse than the SPX (-12.8% vs. -9.2%).
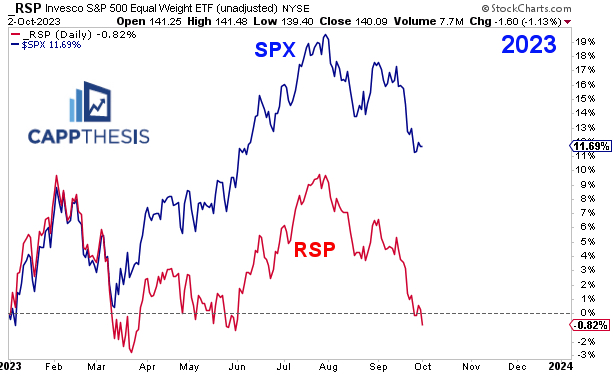
RSP & SPX
Yesterday’s performance took the equal weighted ETF back below breakeven for the year vs. the +11.7% YTD move for the SPX up to this point…
Of course, all of this means that the biggest names have continued to outperform, even when the market as a whole has been going lower.
XLK Technology
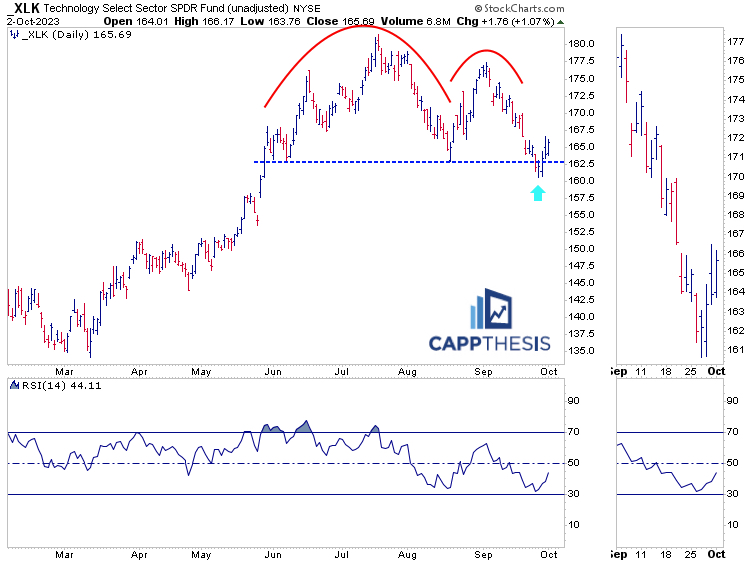
XLK’s recent action is a perfect example of this. The ETF logged its fourth straight advance yesterday and now is up six of the last seven trading sessions. That’s been enough for the ETF to push back above its own breakdown zone from September, while also avoiding getting oversold.
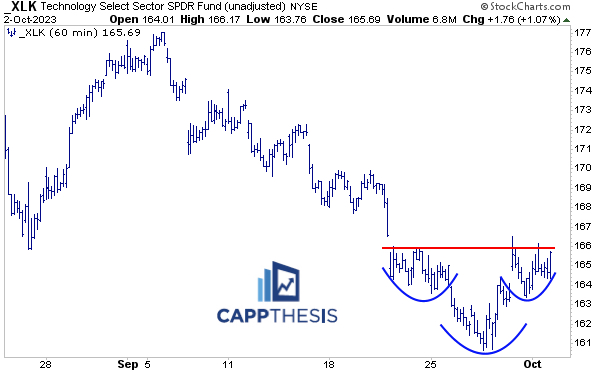
Thus, the next step for XLK would be to break out from this short-term bullish pattern. If it can, the upside target would be near 171.
That won’t change much on the daily chart, but like we always say, the first step is seeing momentum shift in the very short-term. If this small formation gets snuffed out prematurely, then we’ll know the market isn’t ready for a larger move yet.
XLU Utilities
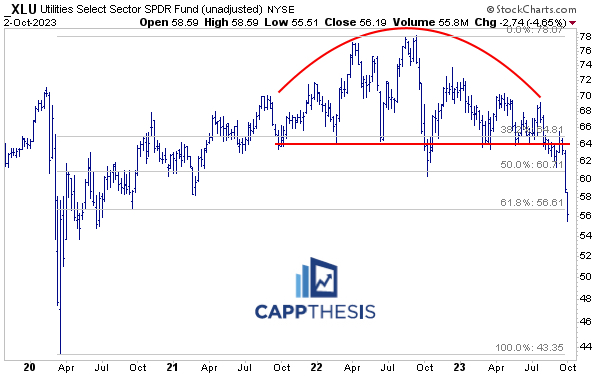
XLU’s crash continued in full force yesterday. While there is no pattern to speak of on the daily work, the breakdown from the weekly formation has been clear. It settled just below the 61.8% retracement mark of the entire 2020-22 advance.
XBI Biotech
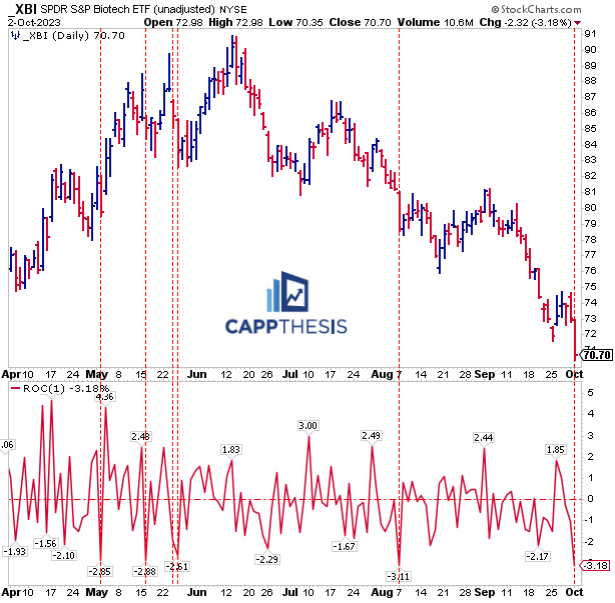
Yesterday’s 3.2% decline was XBI’s first 3% sell-off since August 7th, which happened in the middle of what has become a four-month sell-off now. There were big declines on the way UP, too – all in May.
Regardless, the same story remains – despite pockets of strength along the way, momentum has yet to flip from negative to positive.
CORN
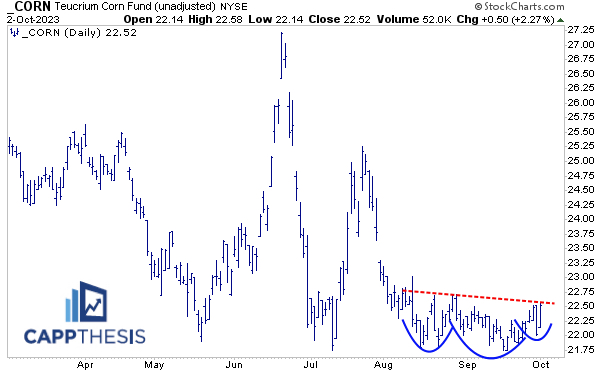
The CORN ETF was among the leaders yesterday, as it continues to move sideways. As a result, it’s close to a breakout attempt of this potential inverse H&S pattern.
