Key Points:
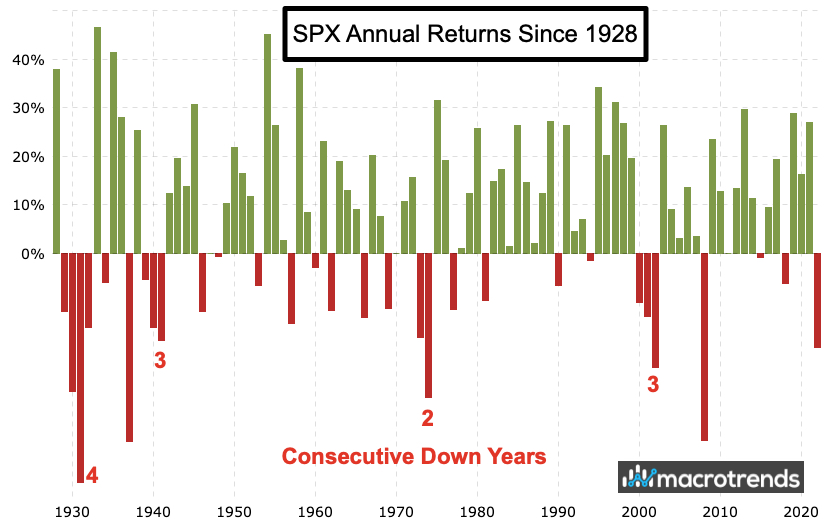
1- The SPX has logged successive down years only TWICE since the early 1940s (’73-’74 and ’00-’02). Not by coincidence, the current bear market has been compared to those periods more than others, as inflation and Tech underperformance have been the main drivers of downside equity price action.
2-Looking at the performance figures below for 2022, Q4 and December, it’s clear that the SPX remains in a downtrend; we should expect more strong multi-week rallies like we saw in Q4 (specifically October and November); but nothing will change if said rallies get reversed like they were in December.
Topics discussed:
1-SPX Annual Returns
2-Now vs. 1973-74 and 2000-02
3-The odds of an “average” move in 2023
4-January Performance after a down December
5-Pattern Update
6-Full Performance stats for 2022, Q4’22 and Dec’22
SPX
The SPX comes into Tuesday fresh off the 2022 downtrend, which the index never truly threatened over the last 12 months. And with the change of the calendar, the question is whether this year will be any different. There have been many a prognostication about this topic for weeks already, all with various conclusions.
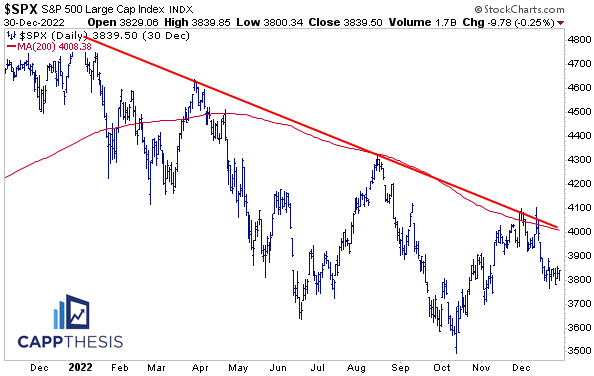
With the SPX having moved double digits every few weeks for 12 months now, trying to pinpoint an actual percentage move 12 months hence doesn’t seem overly helpful. Undoubtedly, predicting the correct PATH will be even more challenging.
That said, history can at least provide some guidance, as 2022 wasn’t the first big down year the SPX has witnessed in its history. First, as we’ve heard by now, consecutive down years have been rare. Not counting overlapping instances, the SPX has lost ground in at least two straight years just four prior times since 1928 (see the chart below from www.macrotrends.net).
Of greater significance, successive down years only have happened TWICE since the early 1940s (’73-’74 and ’00-’02). Not by coincidence, the current bear market has been compared to those periods more than others, as inflation and Tech underperformance have been the main drivers of downside equity price action.
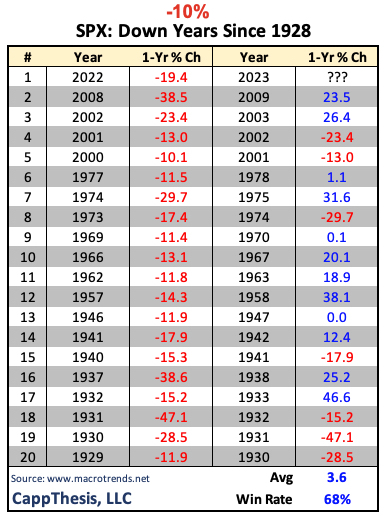
The “average” move following a down year of at least -10% has been +3.6%, but with the SPX logging multiple +/-3% DAYS in 2022, this is hardly insightful.
More importantly, the AVERAGE annual move for ALL years since 1928 has been +7.7%, which is more than double the average after -10% down years…
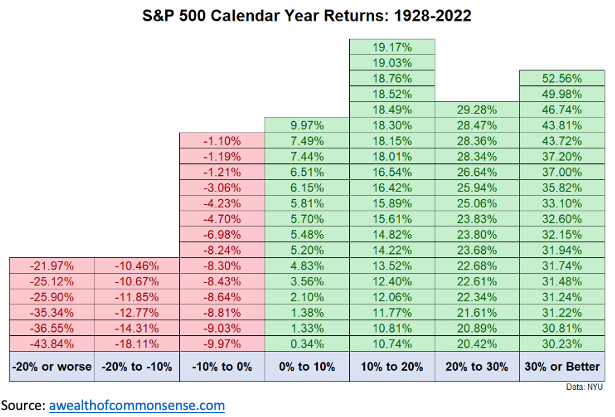
In terms of how big a move to expect in 2023, according to awealthofcommonsense.com, history suggests it won’t be a small one:
“The stock market probably won’t give us “average” returns. Depending on the time frame you use the long run annualized return for U.S. stocks is something in the 8-10% range.
The strange thing about investing in stocks is any given year rarely gives you anything close to that range of returns.
In fact, going back to 1928 there has been one single year of returns that fell between 8% and 10% (1993 when the S&P 500 was up 9.97% in total on the year).
Most of the time the stock market is up big or down big on the year. From 1928-2022, 70% of all years have seen double-digit gains or losses (including 2022):”
January After a Down December
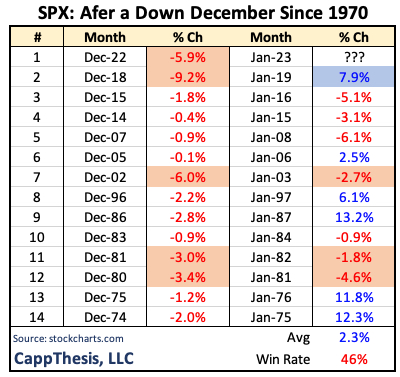
The SPX also is coming off a down December for the 14th time since 1970. The index was higher the following January 6/13 times.
It’s also only the fifth time the SPX logged a loss of at least 3% in December since ’70 (highlighted in red below). Three times, the index was lower again in January (1981, 1982 and 2003); once it was up (2019).
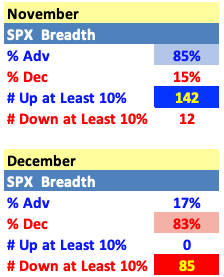
December breadth was the opposite of what we saw in November, too. Most striking is that there were ZERO SPX stocks up at least 10% last month vs. 85 down at least 10%.
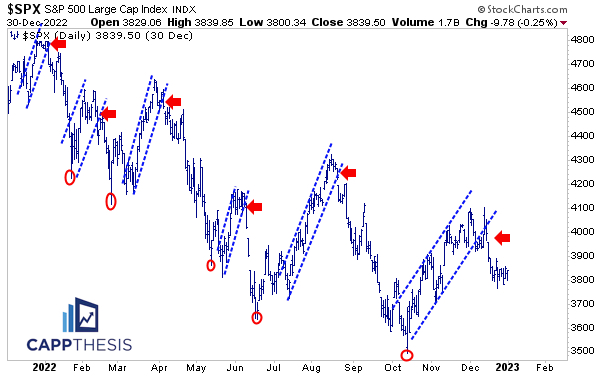
Again, this is nothing new, as each upswing has been faded up to this point, which will need to change for the SPX to rediscover a long-term bid. Said change = avoiding making a new low before the next round of demand materializes.
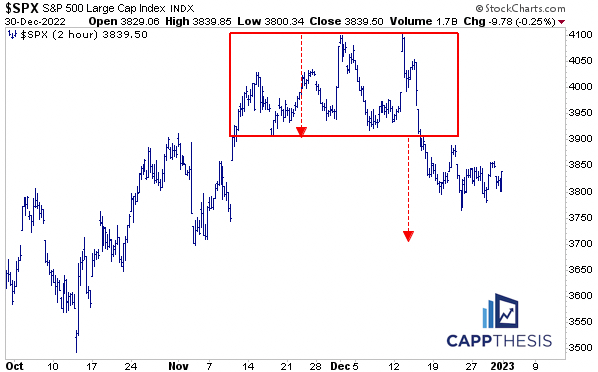
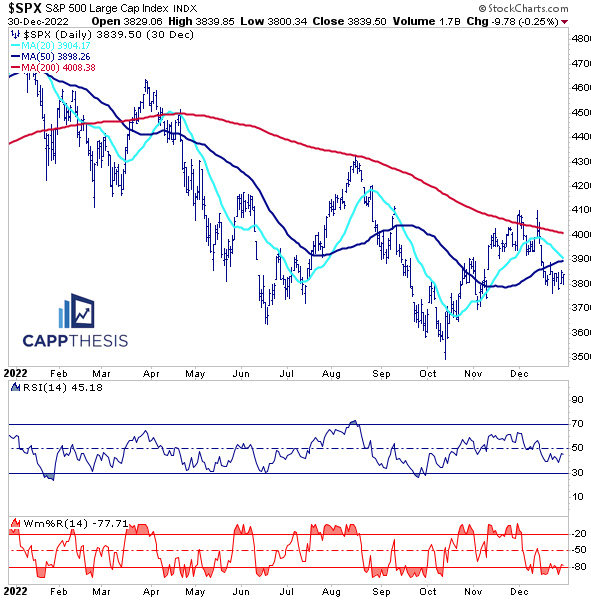
As of now, the only live pattern continues to be this bearish trading range breakdown.

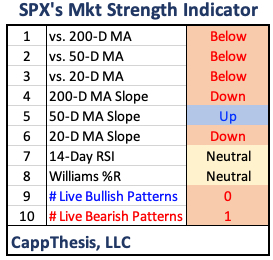
The SPX’s Market Strength Indicator (MSI) remains weak, but it’s not at the extreme levels that have supported the best buying opportunities in the last 12 months. That only happened after the 50-Day MA rolled over and the 14-Day RSI and Williams %R were both oversold.
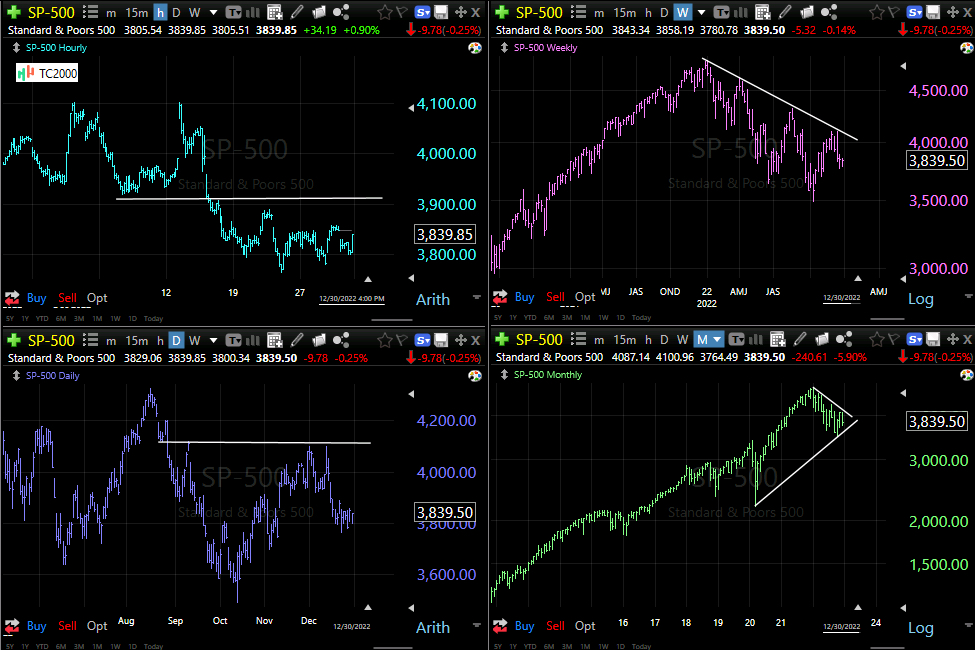
Here’s a view of the SPX across four different time frames (hourly, daily, weekly and monthly). The reference points are clear, with 3,900 still being the first key level to overcome.
Performance Tables
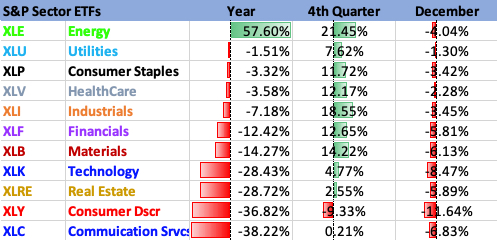
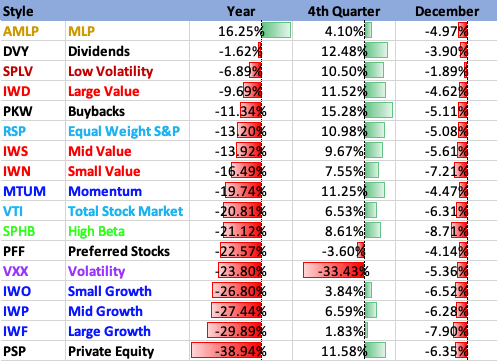
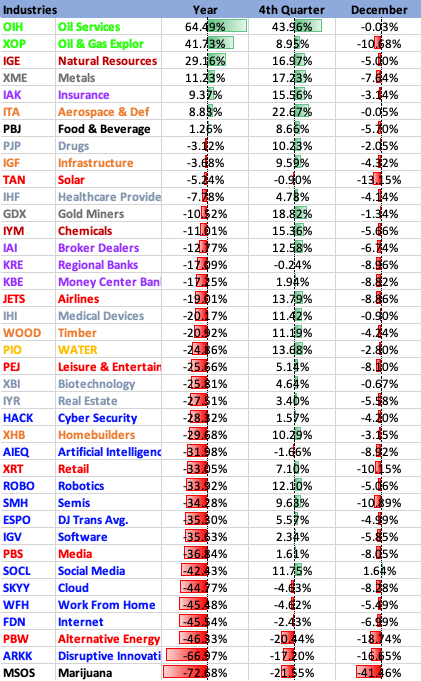
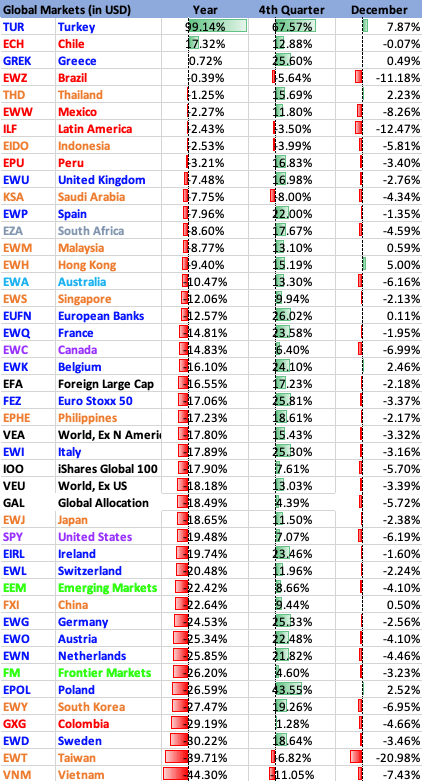
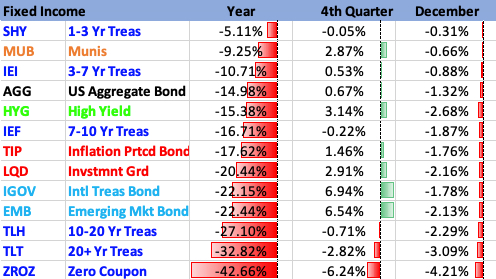
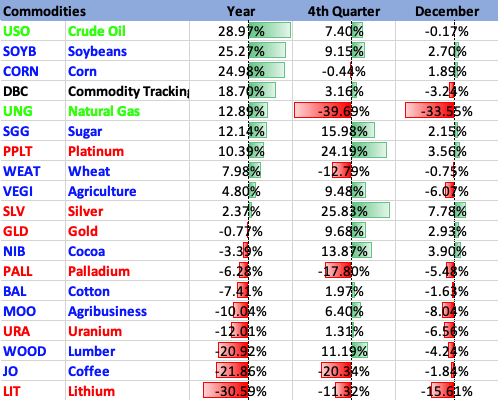
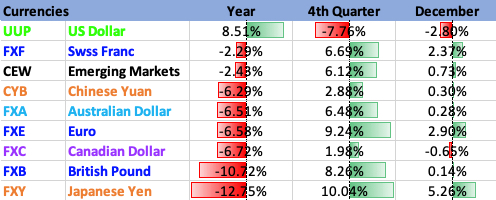
Here’s one last look at 2022, the 4th quarter and December performance.
One trend is clear throughout:
The SPX remains in a downtrend; we should expect more strong multi-week rallies like we saw in Q4 (specifically October and November); but nothing will change if said rallies get reversed like they were in December.
All categories are sorted by best YTD % moves.

