Every year on September 11, we say the words “Never Forget.” All of us who lived through that day has a story no matter where we were at the time.
I was 26 years old working as a junior analyst, sitting on the trading desk in the middle of Times Square, New York City. Dozens of my fellow employees and I watched the events unfold together. Two of them were working in one of the towers that morning and perished.
Twenty-five years later, the loss remains impossible to comprehend. Thousands of lives were taken, families were forever changed, and for many people, the pain of that day has never gone away.
But there is something else we all should remember very clearly: how our country responded.
Extreme grief was soon paired with an extraordinary sense of unity. Former New York Governor George Pataki has described it as the moment “the nation became a neighborhood and all Americans became New Yorkers.” I think that captures it perfectly.
People helped one another. They looked out for strangers. Differences that seemed important before September 11 suddenly didn’t seem quite as significant anymore. There was a genuine sense that we were all in this together.
We honor those who lost their lives on September 11, 2001, and the families and friends who continue to carry that loss. We will never forget them.
We also should remember how we came together as a country when we needed one another most.
Daily Price Action
The SPX comes into CPI-Day down four straight sessions, its longest losing streak since five in a row from June 22–26. The rally attempts have been few and far between up to this point.
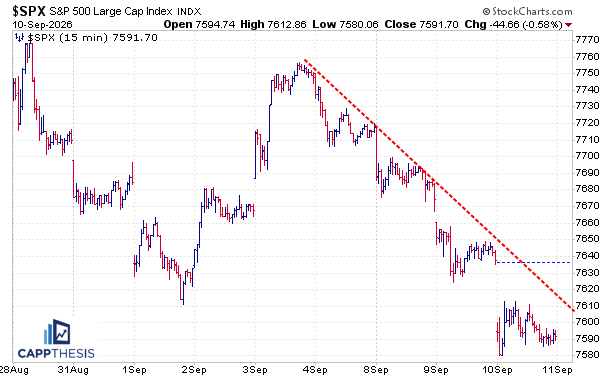
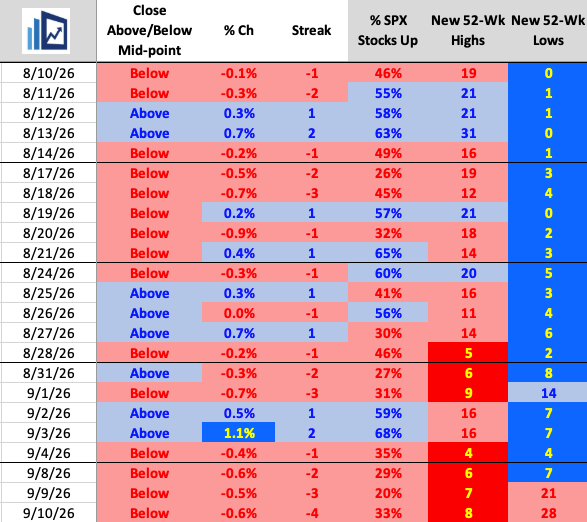
Over that stretch, the index has closed below its intraday midpoint each day. while breadth has remained weak, with only 20%–35% of SPX stocks advancing the last four days. The number of stocks making new 52-week highs have been in the single digits in 7/9 days, as well.

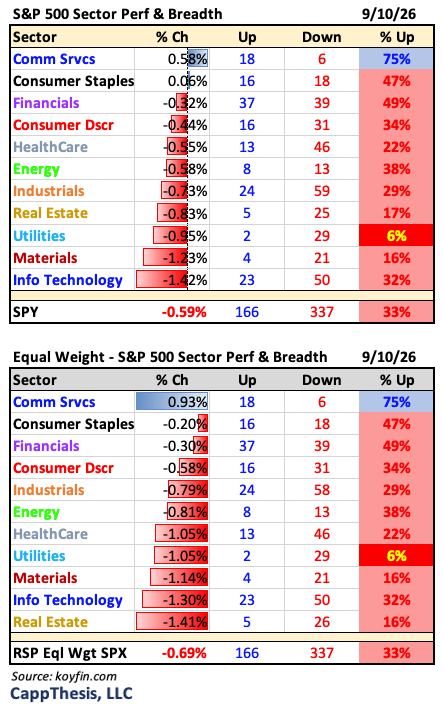
Yesterday only Communication Services advanced among the sectors, with every other sector declining on negative internals.
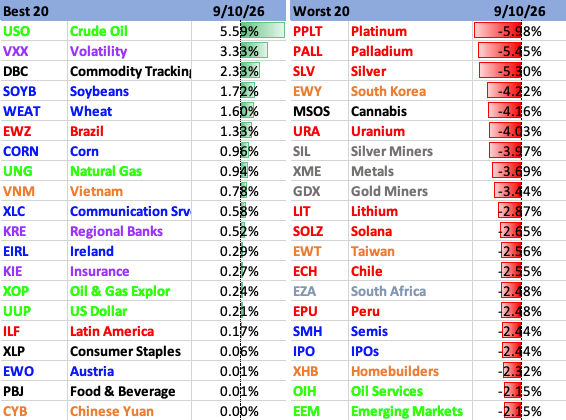
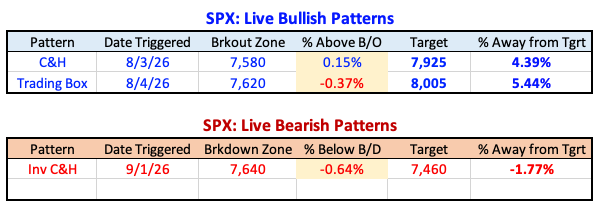
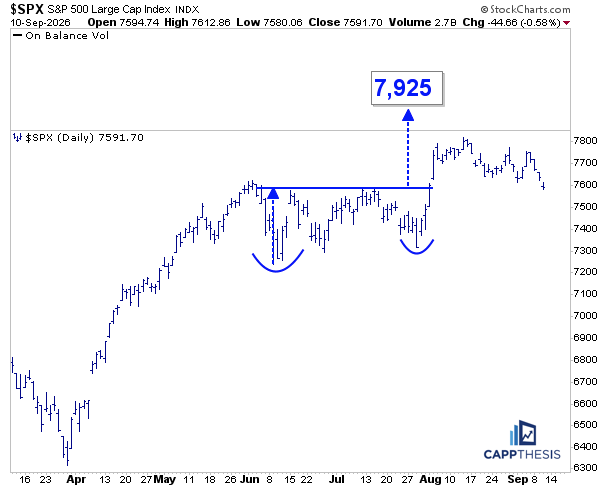
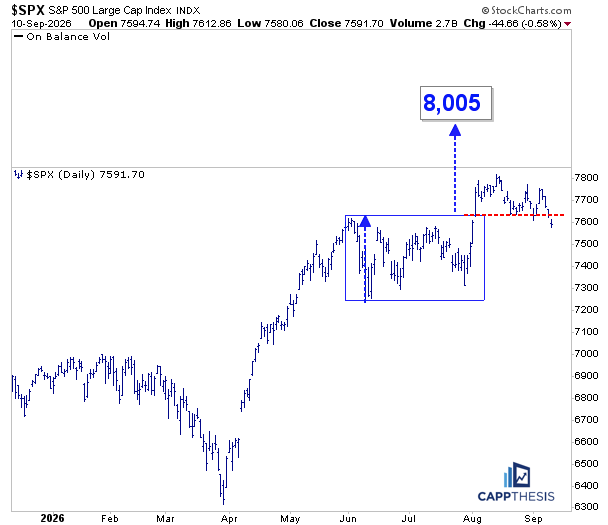
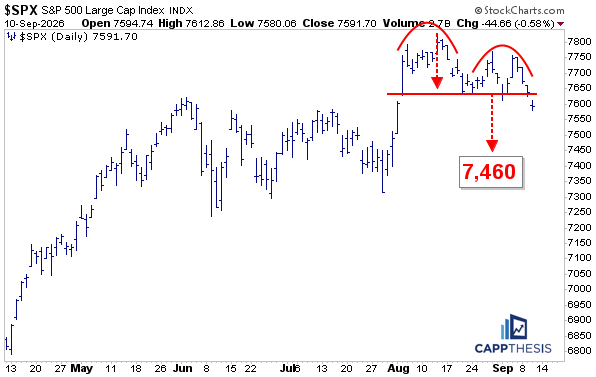
Pattern-wise, all three live formations we’ve been tracking remain in play, with the SPX sitting near the respective breakout and breakdown levels. This makes the reaction to today’s inflation numbers even more significant.
Short-term
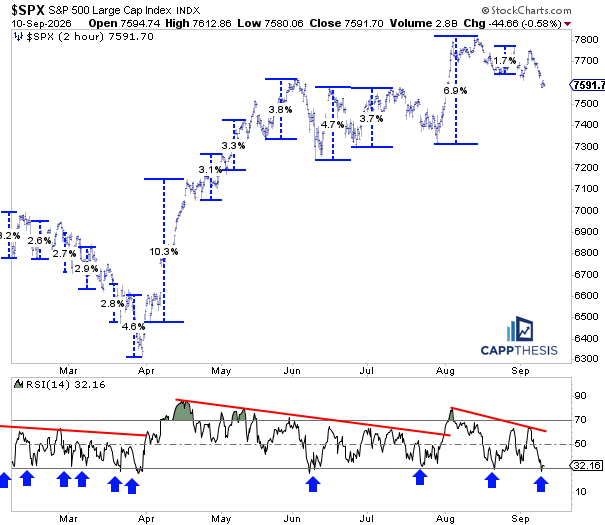
Short term, the four-day losing streak has pushed the 14-period RSI on the 2-hour chart back into oversold territory. As we know, this has been a favorable setup for bounces over the last few months.
However, the most recent rally from an oversold condition was one of the weakest of 2026, producing just a 1.7% trough-to-peak advance. More importantly, it did little to change the SPX’s recent character, which continues to feature slightly lower highs and lower lows.
With today’s inflation data providing another major potential catalyst, the SPX has another opportunity to produce a more meaningful response from oversold conditions.
CPI
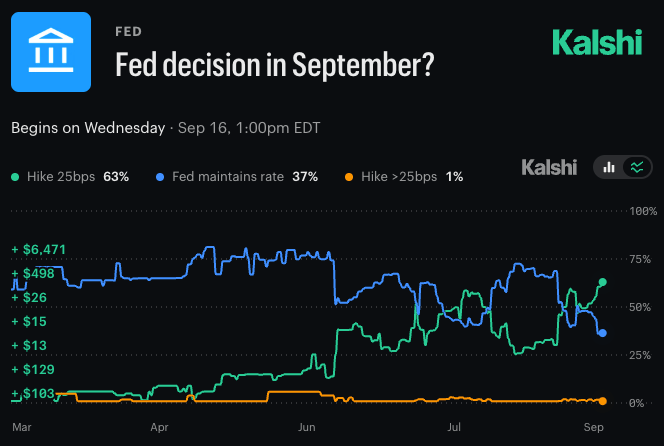
As we all know by now, yesterday’s hotter PPI report pushed the probability of a 25-basis-point Fed hike next week to roughly 63%, according to Kalshi. That’s the highest probability we’ve seen yet for the September decision.
With CPI typically carrying more weight than PPI, that probability could change considerably following this morning’s inflation report.
SPX & CPI
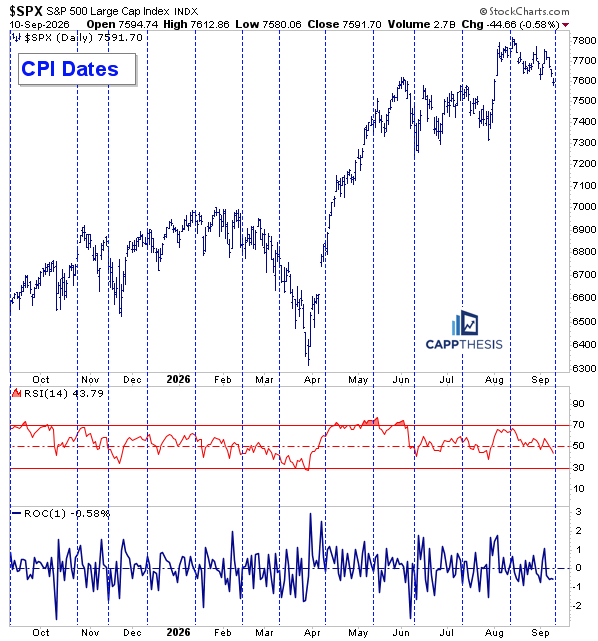
From a daily perspective, the SPX comes into today at its lowest level since early August, as it continues to digest and retrace the big four-day advance from late July into early August. The 14-day RSI now sits near 44, its lowest reading since late July, as well.
From a CPI perspective, the setup looks similar to June. Back then, the SPX was experiencing its first meaningful pullback following the strong rally from late March into early June. Once the CPI report came and went, the index bounced in the short term but ultimately settled into a two-month trading range before finally breaking out in late July.
From that perspective, the current setup has similarities, with the SPX once again pulling back and digesting its most recent surge.
10-Year Yield Long-Term
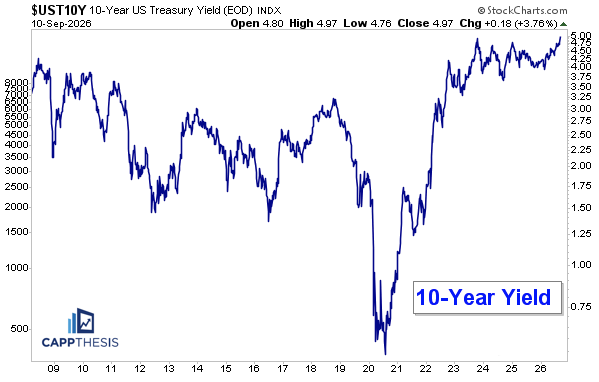
The focus, of course, will continue to be on the 10-year yield. This chart goes all the way back to 2008 and shows how, after declining for nearly 40 years, yields finally reached a generational low around the COVID period. Since then, the trend has reversed, with the 10-year yield advancing consistently and recently approaching the 5% area.
Given that falling interest rates provided a major tailwind for equities for decades, it would have been reasonable to assume that the reversal higher in yields would have created a persistent headwind. That certainly was the case during much of 2022, but otherwise, equities largely haven’t blinked the last five-plus years…
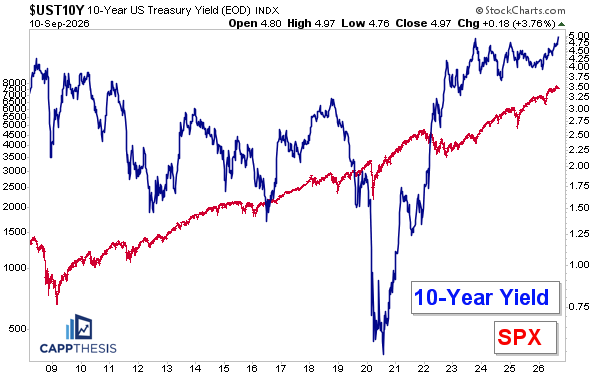
SPX & 10-Year Yield Long-term
Overlaying the SPX on the 10-year yield shows this clearly. From a very long-term standpoint, equities have continued to trend higher through a wide variety of interest-rate environments. Short-term volatility certainly can increase when yields rise, but the speed and magnitude of the move often matter more than the direction alone.
That was particularly evident in 2022, when yields surged as the Fed aggressively played catch-up with inflation. That is the concern again now, especially with inflation-sensitive commodities continuing to strengthen—not just Energy.
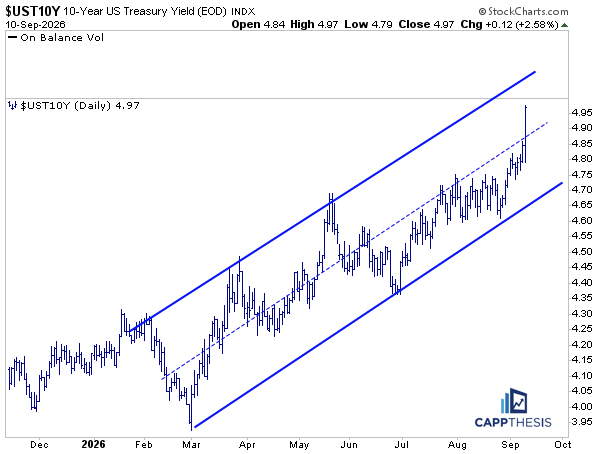
Turning to the daily chart, here’s the same upward-sloping channel we discussed yesterday. And following Thursday’s sharp move higher, the 10-year yield is now back in the upper half of the pattern.
Another big advance in rates could quickly push the yield toward the channel’s upper boundary. That area already was tested twice in 2026, in March and again in May, with both instances followed by rollovers soon thereafter.
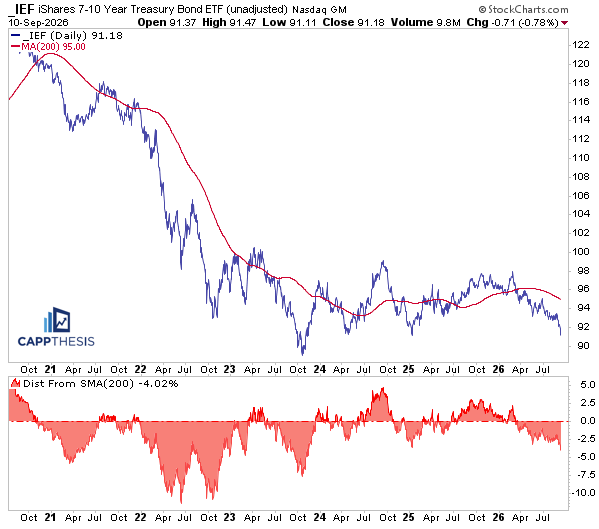
IEF 7-10 Year Treasury Bond ETF
While TLT gets plenty of attention and we discuss it often, it represents longer-term (20-year plus) Treasuries. IEF is more closely associated with the 10-year, holding Treasuries with maturities between seven and 10 years. This daily chart going back to 2020 provides some useful perspective.
IEF has been declining for most of 2026 and now sits roughly 4% below its 200-day moving average, its largest negative discrepancy since 2023. Still, despite the persistent weakness, IEF has only marginally undercut its 2024 and 2025 lows.
That’s considerably different from 2020–2023, when IEF’s decline accelerated, as it routinely traded much further below its 200-day moving average. Since then, both IEF and the 10-year yield largely have remained within broad ranges – though now at extreme levels of said ranges.
We’re not using this as a standalone indicator, but it provides important context on the recent bond-market weakness. Treasuries have been falling consistently in 2026, but so far, that decline hasn’t materially changed the broader sideways trend of the last few years. If that changes, the implications for equities obviously could become much more significant.
USO Oil Fund
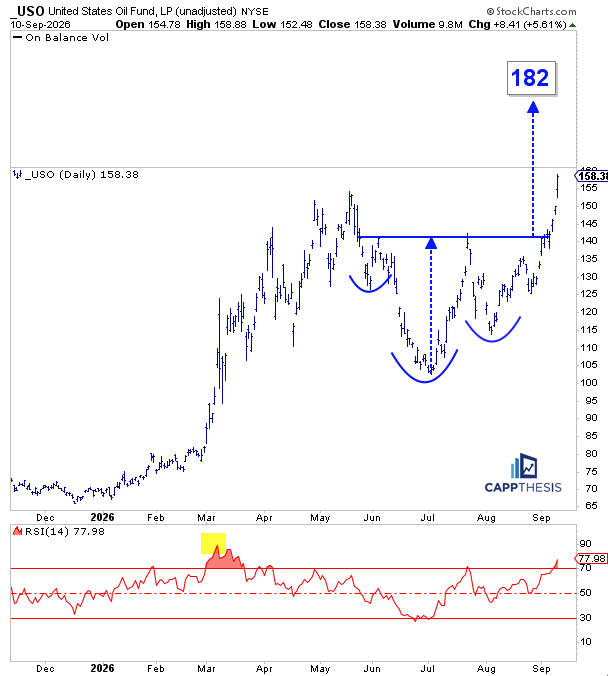
Yesterday’s continued advance in crude oil pulled USO even further above its breakout zone, keeping the 182-upside target in play. The 14-day RSI popped, too, with it finishing near 78, by far its highest level since early March.
Back then, the RSI topped and started making lower highs while USO continued to advance for roughly two more months before finally peaking. This time, however, multiple DeMark Sell signals also have triggered on both the daily and weekly charts, as discussed yesterday. Regardless of the headline-driven nature of crude oil, the already-stretched rubber band was pulled even tighter yesterday.
Crude Oil has been selling off this morning, so a continued pullback wouldn’t be surprising. The question is how far it goes. The first notable support area for USO remains near 140, which coincides with the pattern’s breakout zone.
XLC Comm Services
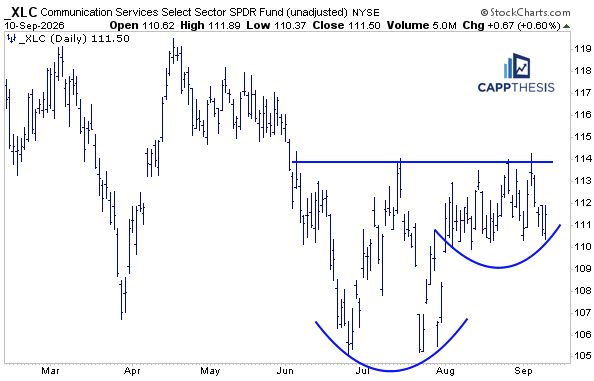
As mentioned above, XLC was the only sector ETF to advance yesterday, although the move did little to change the complexion of its chart… yet. Simply holding steady over the last few weeks has allowed XLC to outperform most areas and, more importantly, keep its potential cup-and-handle pattern intact.
Let’s keep this one on our radar, as Communication Services eventually could become an area of rotation after underperforming other Growth areas for quite some time.
WFC (Wells Fargo & Co.)
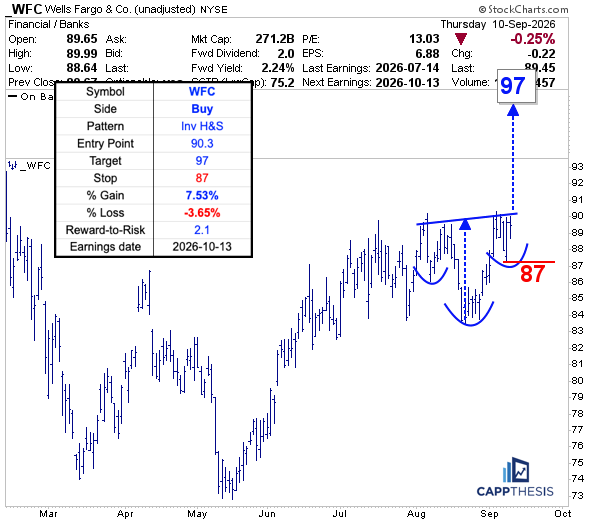
Over the last few days, several banks have surfaced with interesting chart patterns during our daily review, so it makes sense to profile one this morning: Wells Fargo (WFC).
This is a relatively small formation, and the potential measured move isn’t huge, but our goal is simply to identify the cleanest setups we can find. WFC has tested the 90 area before without meaningfully breaking through, but its potential inverse head-and-shoulders pattern gives it another opportunity.
A breakout above 90.30 would trigger the formation and produce a 97-upside target. We’ll use 87 as the suggested stop-loss.
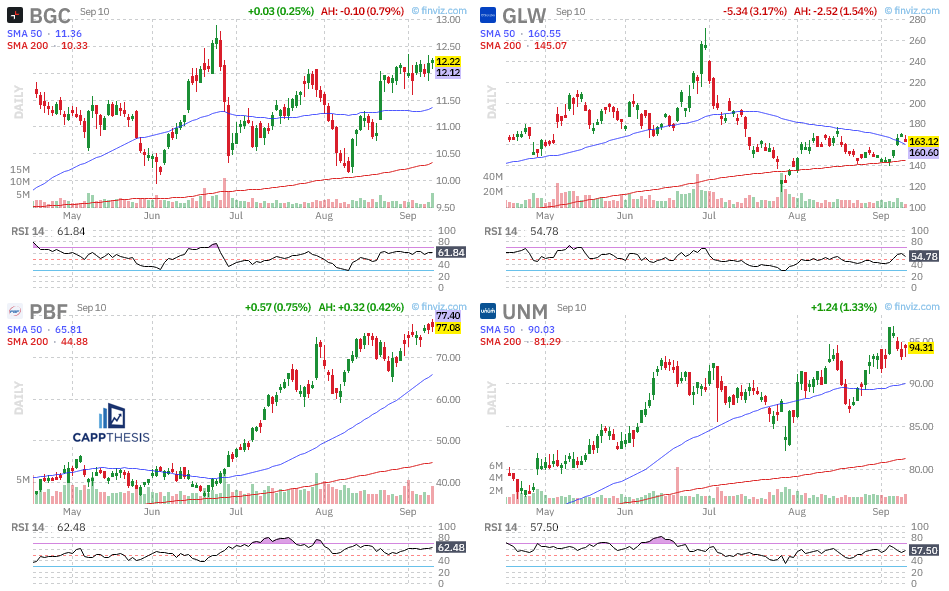
Watch list: BGC, GLW, PBF, UNM