Key Points:
1- The SPX now is +9.6% over the last three weeks. Prior three-week advances of at least 9.5% have been rare going back to 2008. When they have occurred, though, they’ve been bullish signals.
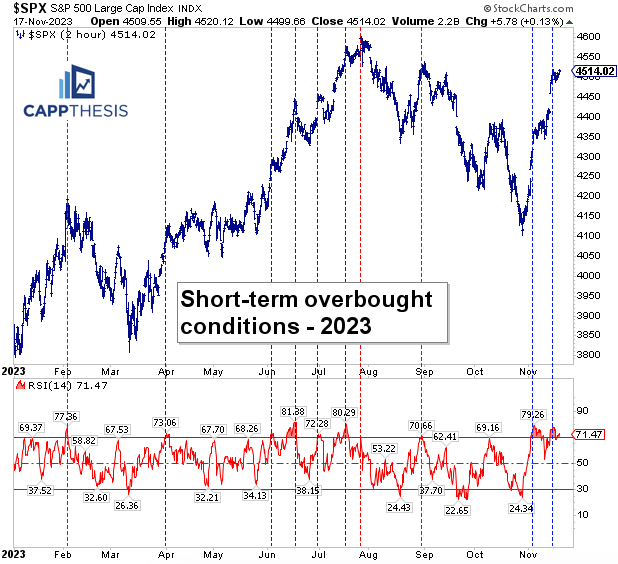
2- The SPX continues to hover near overbought territory on the two-hour chart. This can’t last forever. During the long run from mid-March through the end of July, the 14-period RSI oscillated between the upper and lower part of the range.
3- The Dollar’s 14-day RSI also is getting close to hitting oversold levels for the first time since July. From November’22 through February’23, the 14-day RSI stayed closed to oversold territory before the next real rally attempt.
Topics Covered:
Market
-4-day winning streaks
-Big 3-week gains
-Short-term overbought
-Steep trendlines
-Bollinger Bands
-AVWAP
Stats
-Daily Price action
-Index Breadth
-Sector Perf & Breadth
-Best & Worst ETFs
Key Charts
-Crude Oil
-XLE
-US Dollar
-German DAX
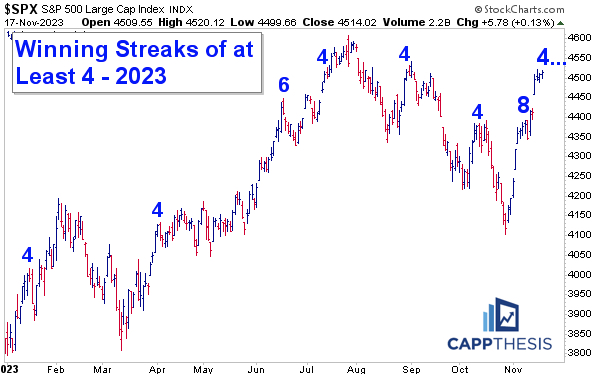
Another 4-Day Winning Streak
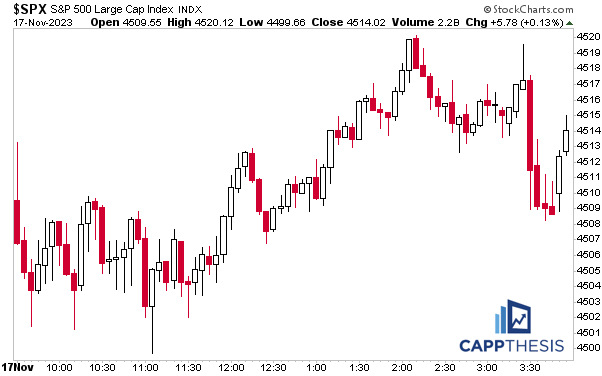
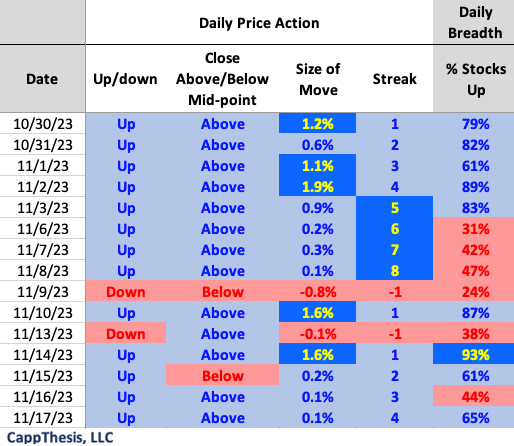
The SPX spent another day in digestion-mode on Friday, but it was good enough for the fourth straight advance.
This now is the second winning streak of at least four since the start of this bounce, with the other extending to eight, of course.
Incidentally, we’re now seven days removed from that prior streak, and so far, the index has done a lot better after that run vs. the prior two from late August and early October. As we’ll recall, there was zero upside follow through after each time.
We won’t list the detailed stats again of what typically has happened after 4-day winning streaks here. However, overall, the market has been higher two weeks later approximately 70% of the time since 2017.
In 2023 so far, that win-rate has held true with the SPX higher over the next 10 trading days later 5/7 times before this one.
Large Three-Week Gains
Over the last four days, the SPX has logged gains of 1.9%, 0.2%, 0.1% and 0.2%, as it has continued to consolidate the huge CPI reaction. While that led to a very quiet trading environment, it was enough to produce another strong weekly gain of +2.4%.
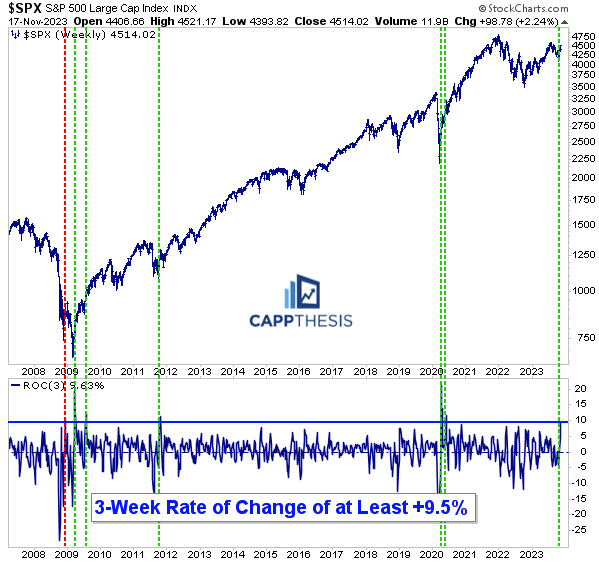
Repeating from yesterday’s PostScript report, over the last THREE weeks, the index now is +9.6%, which is the best three-week run since the period right after the Covid lows.
As the chart shows below, three-week advances of at least 9.5% have been rare going back to 2008. When they have occurred, though, they’ve been bullish signals, leading to a lot more upside in the months and years to follow.
The only time one did not happen near a key market bottom was in December’08. But even that occurred closer to a key low vs. a key high.
Ultimately, this is just another study suggesting that bursts of buying tend to lead to higher prices over the long-term… remember, the first one was the Zweig Breadth Thrust on 11/3, nearly three weeks ago.
Short-term Extended
The SPX continues to hover near overbought territory on the two-hour chart – again, this has been a much different (and better) reaction than the prior two.
We’ve compared this period to what happened in the weeks and months after the March lows. That continues to be a helpful blueprint, but even during that long run (through the end of July), the indicator oscillated between the upper and lower part of the range.
In other words, we shouldn’t be surprised to see this pace slow at some point soon…
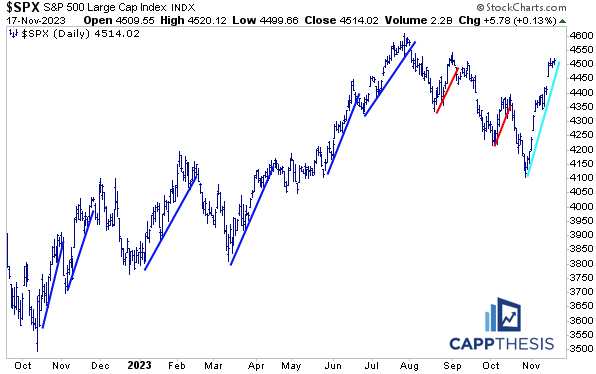
If that does happen in the near-term, then this very steep trendline finally will be broken.
Again, we’ve seen this before. However, of the prior eight times that the SPX broke below a prior steep uptrend line, six times, it made a higher low vs. the previous low. We see them clearly here.
And with the SPX now more than 10% from the last low from late October, it has a big cushion to potentially repeat this behavior and make another higher low again.
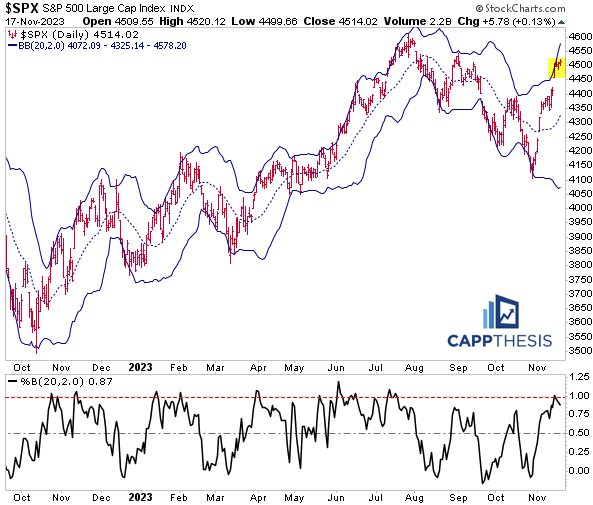
This phenomenon can be viewed via the Bollinger Bands, too. While we can’t expect the SPX to hug the upper line into perpetuity, seeing it stay in the upper half of the bands (above the 20-Day MA) would confirm the uptrend.
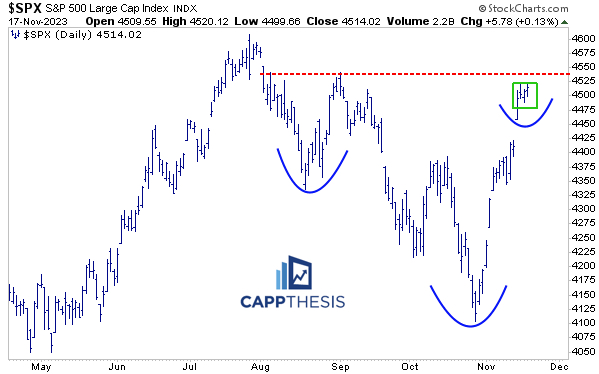
Patterns
Needless to say, the bullish pattern breakout from 11/10 remains in play.
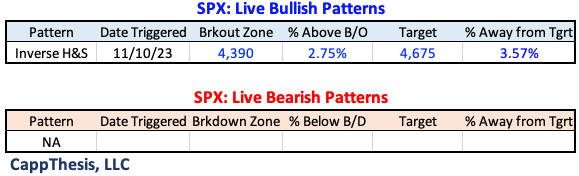
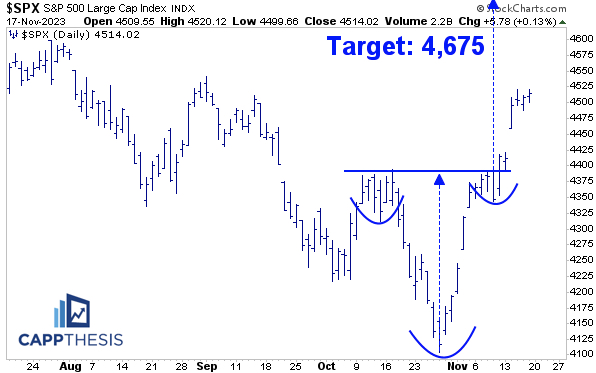
The other two potential bullish formations continue to build, as well.
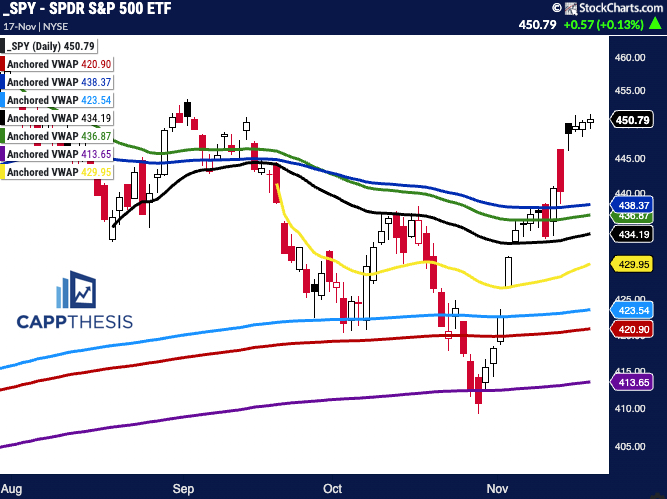
SPY AVWAP
With SPY still way above each VWAP line, we’ll continue to wait for another decline to anchor the next line to.
Purple: 1/4/22 – 2022 high
Green: 10/13/22 – 2022 low
Red: 1/2/23 – YTD VWAP
Light Blue: 2/3 – Former high point
Yellow: 9/20 – FOMC Meeting
Black: 8/18 – August low
Blue: 6/15 – FOMC negative reversal
Daily Price Action
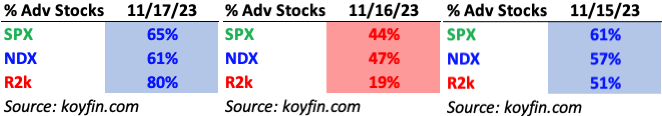
Weekly breadth shot back near 90% positive last week even though the index only had one day with more than 65% stocks up (Tuesday: 93%). That was more than enough, of course, with the SPX and many of its components digesting that big session the remainder of the week.
Breadth
Breadth in the Russell 2k shot back to 80% on Friday, bouncing back from the sub-20% level on Thursday.
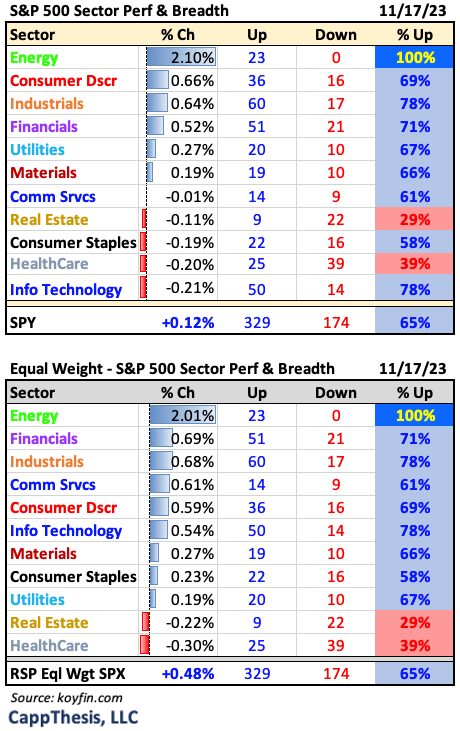
Sector ETFs
6/11 Sector ETFs advanced on Friday, led by Energy’s big 2% gain and 100% of its components up for the session.
Best and Worst 20 ETFs
Friday’s 1% gainers/1% decliners ratio was the second best of the week despite the SPX’s small gain.

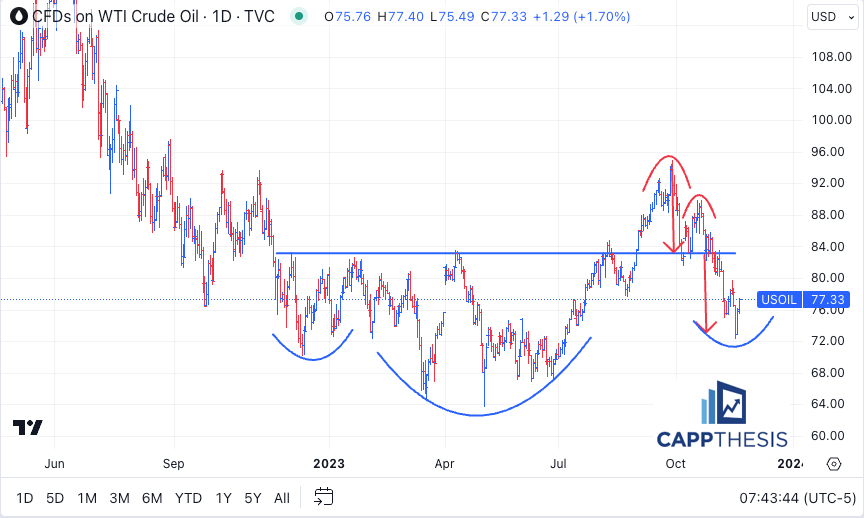
Crude Oil
The bad news is that the prior breakout attempt through 84 failed, and Crude Oil ended up hitting the bearish pattern downside target last week.
The good news is that it now has a chance to log another key higher low and potentially complete another – even bigger – basing formation. We just need to see better upside follow through now…
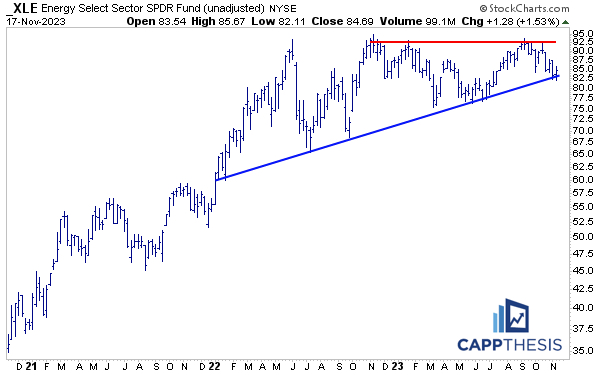
XLE Energy
With Crude bouncing, XLE has a chance to extend the strong move from Friday. Not by coincidence, that began at the uptrend line that started in 2022.
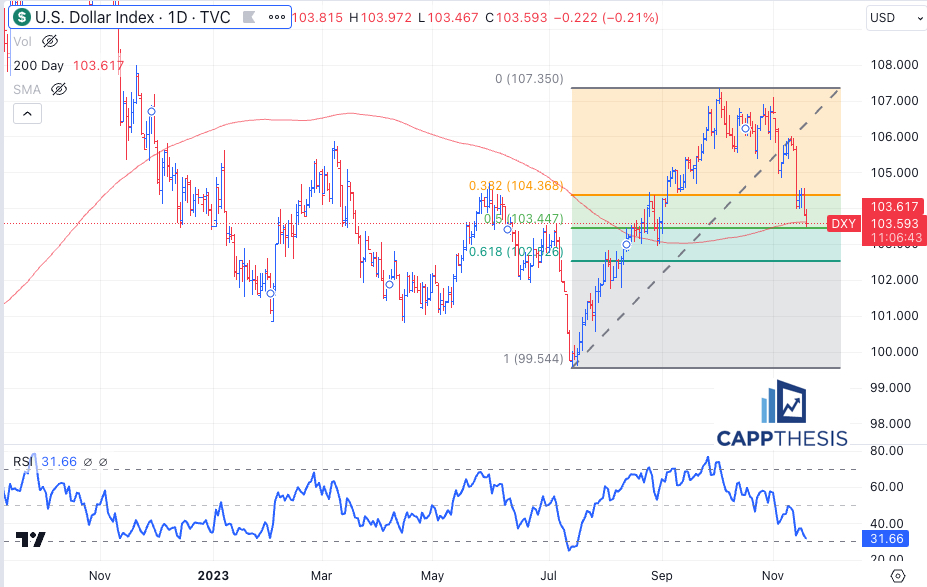
US Dollar
With the Dollar down early this morning, it’s testing the 200-DMA for the first time since late August and also the 50% mark of the entire advance. The Dollar’s 14-day RSI also is getting close to hitting oversold levels for the first time since July.
Again, with it extending the pattern breakdown that we touched on two weeks ago, let’s remember how it acted from November’22 through February’23 – the 14-day RSI stayed closed to oversold territory for a few months before the next real rally attempt.
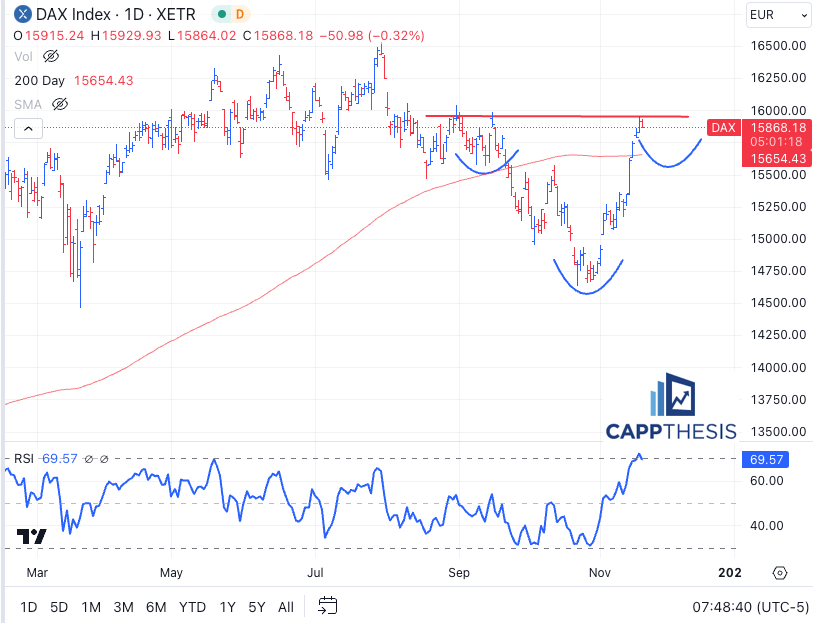
German DAX
The DAX just hit overbought territory for the first time since February 9th; seeing a pause now could prompt the formation of a right shoulder of this would-be inverse H&S pattern.