Key Points:
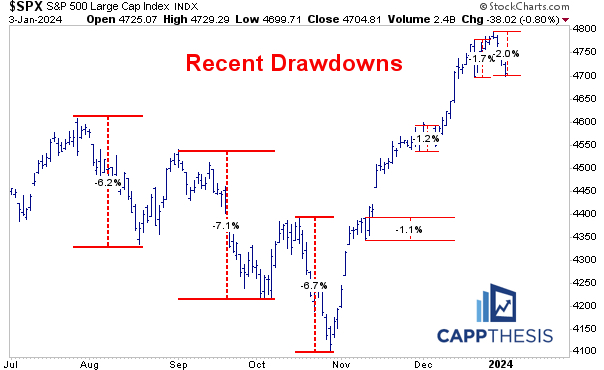
1- The SPX’s drawdown from the 12/28 high now is -2%, which is still less than each of the drawdowns from April through July (all between 2.4% and 3.5%).
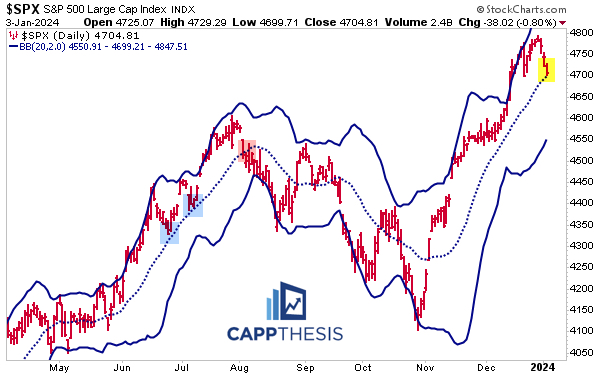
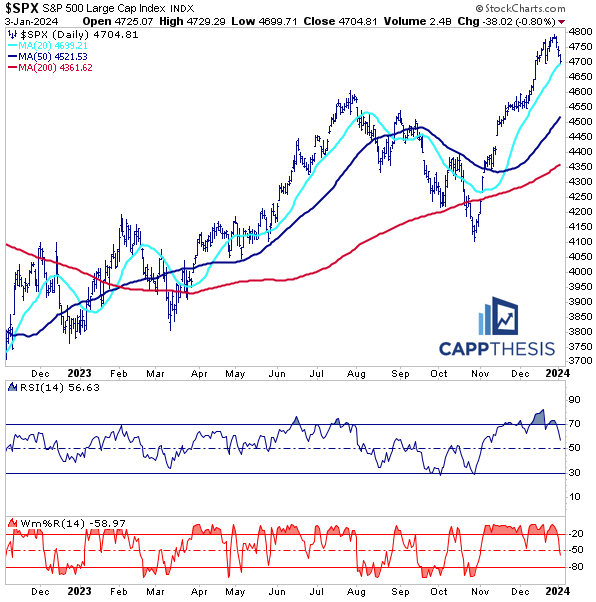
2- For the first time since early November, the SPX is testing the middle line of its Bollinger Bands, which, of course, is the 20-Day MA.
3- The MACD indicator just flashed its second sell signal since December. As we can tell from the colored lines, five of the last six sell signals failed.
Topics Covered:
Market
-Drawdowns
-Bollinger Bands
-Bollinger Bands – Weekly
-MACD (2)
-Market Strength Indicator
-SPX Adv-Dec
-NASDAQ Adv-Dec
-Patterns
-AVWAP
Stats
-Daily Price Action
-Index Breadth
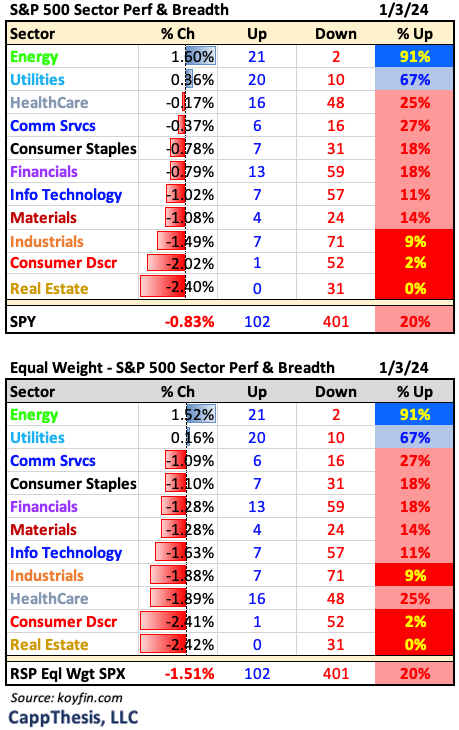
-Sector Performance
-Best & Worst ETFs
Key Charts
-XLE
-XOP
-OIH
-Bitcoin
SPX:
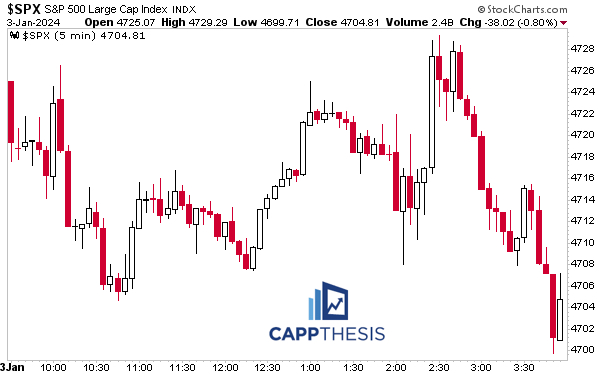
The SPX dropped its third straight on Wednesday, which now is the second 3-day losing streak since 10/27/23. The last longer streak was five in a row, from 10/17-10/23. The 80-bps loss was the largest since 12/20 (-1.5%)…
This pushed the drawdown from the 12/28 high to approximately -2%, which is the largest pullback from a short-term high in the last 10 weeks. And it’s still less than each of the drawdowns from April through July (all between 2.4% and 3.5%).
Of course, various areas have gotten hit a lot harder over the last few days, many of which have led on the way up. That’s a concern given their large weightings, but so far, the field has done enough to keep the damage in check.
So, let’s see how the pullback has affected some of the indicators that had gotten extended into year-end’23…
Indicators
For the first time since early November, the SPX is testing the middle line of its Bollinger Bands, which, of course, is the 20-Day MA. We know it can’t stay above the short-term line forever but slicing right through it would be a bearish sign, which is what we saw in early August.
Back then, however, that was the third test of the 20-DMA, with the first two proving to be short-term respites within the uptrend (highlighted in blue).
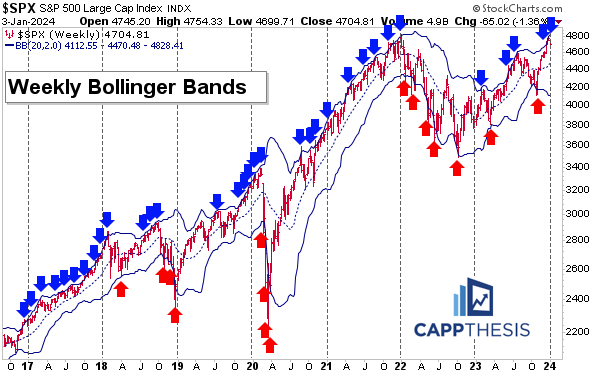
The weekly Bollinger Bands indicator is a very important one to watch going forward, too.
As is very clear, routinely hitting the upper band has been a key trait during the best and longest uptrends (2017, 2019, 2021). Just as significant has been avoiding tagging the lower band, which was last hit at the October lows.
As we can see, even though the SPX gained 24% in 2023, it wasn’t the least volatile ride, at least compared to the years just mentioned. Could 2024 provide new highs and a more consistent uptrend like those?
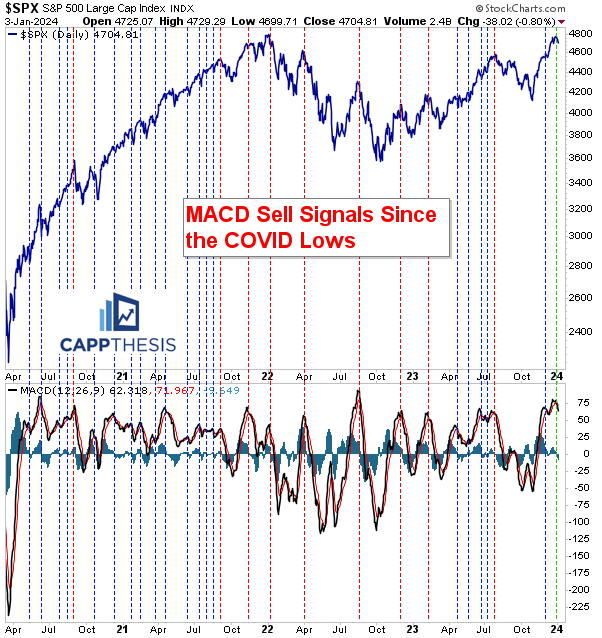
The MACD indicator just flashed its second sell signal since December. As we can tell from the colored lines, five of the last six sell signals failed. They worked great in 2022…
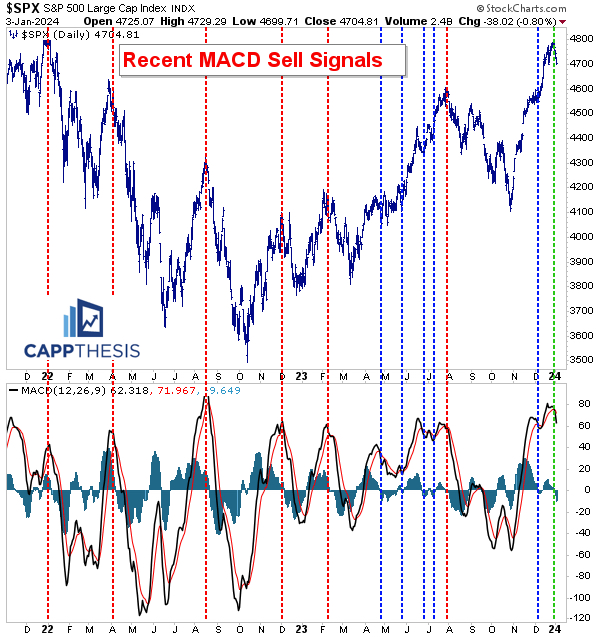
… but that year looks like an aberration given what happened in 2021 and 2023. Pullbacks are normal no matter the market we’re in. Seeing buy interest surface sooner rather than later is the key difference in uptrends.
Obvious but true.
Market Strength Indicator
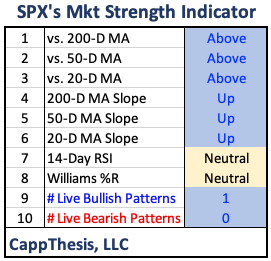
The MSI has come off its extremes from December. First, the SPX has achieved two of its three pattern targets. And now, the formerly stretched indicators have been neutralized. Seeing where the 14-day RSI bottoms will be a big one to watch now.
Breadth
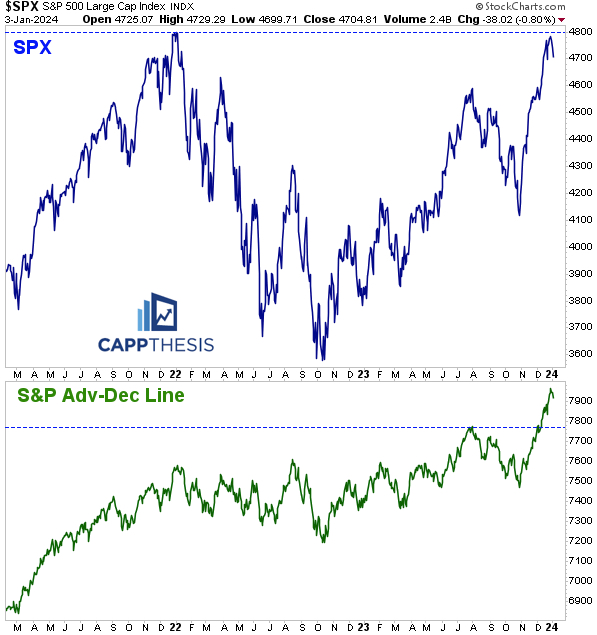
While the SPX hasn’t made a new high yet, its cumulative adv-dec line did so weeks ago. More importantly, the line and the SPX have been aligned the entire way up to this point.
The index has just endured 2/3 days with negative breadth for the first time since 11/27-28. That’s a cluster worth watching, but for now it’s not overly alarming.
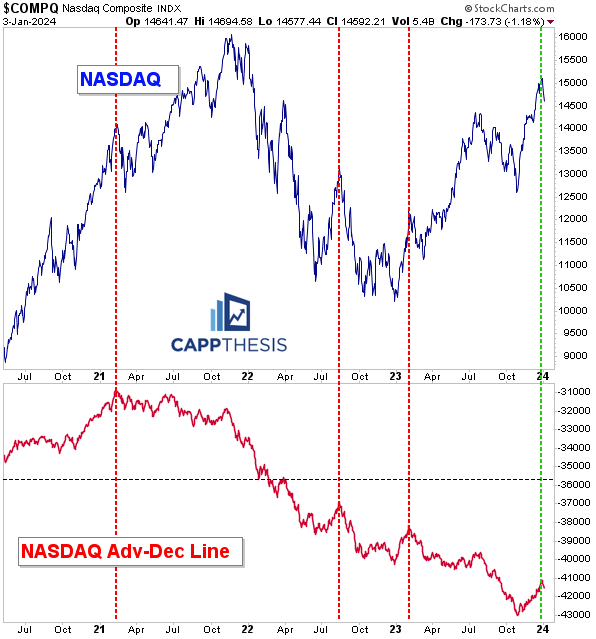
As we talk about from time to time, the NASDAQ adv-dec line has been in a perpetual downtrend since its inception over 50 years ago. But during the strongest market rallies, it actually moves higher.
This happened again over the last nine weeks. That’s certainly helped the overall market, but it’s also a sign that things could be getting overheated.
Noted are the times when the NASDAQ adv-dec line topped, which coincided with trading tops in the NASDAQ itself (some minor, some big). Again, simply seeing the line move lower isn’t a huge deal given that its long-term trend is down, but it only moves higher during the best market advances – like now.
Patterns
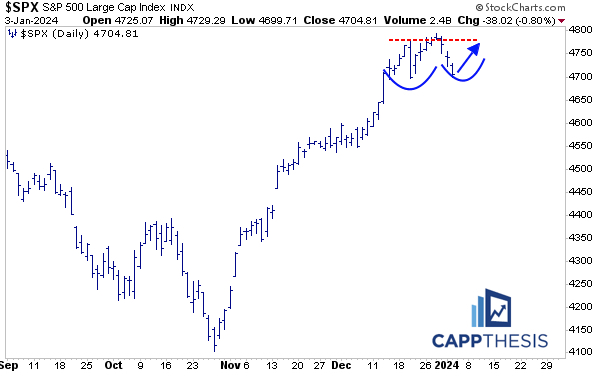
The SPX has come off its highs, but the last pattern breakout has yet to be tested. Target 5,030.

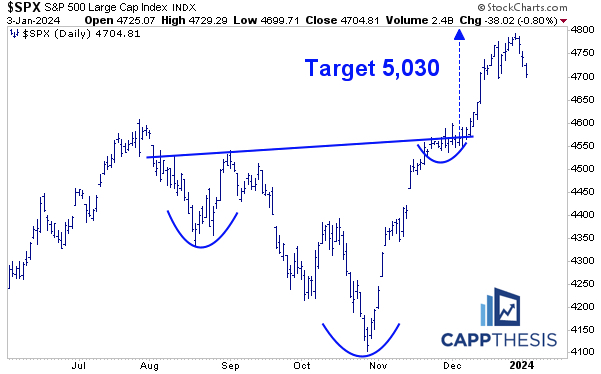
A hold soon would keep this potential bullish formation alive.
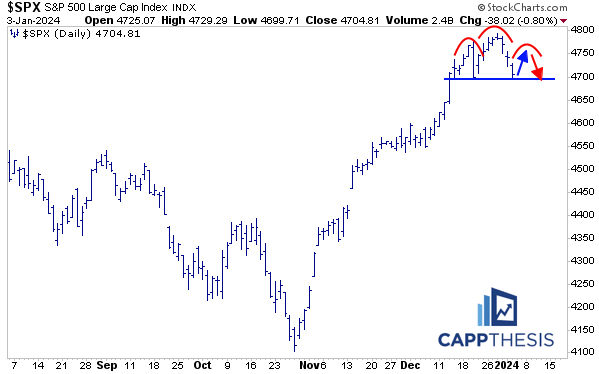
A bounce that fails to take out last week’s high could complete this topping pattern. We haven’t had a live bearish pattern in play since October.
SPY AVWAP
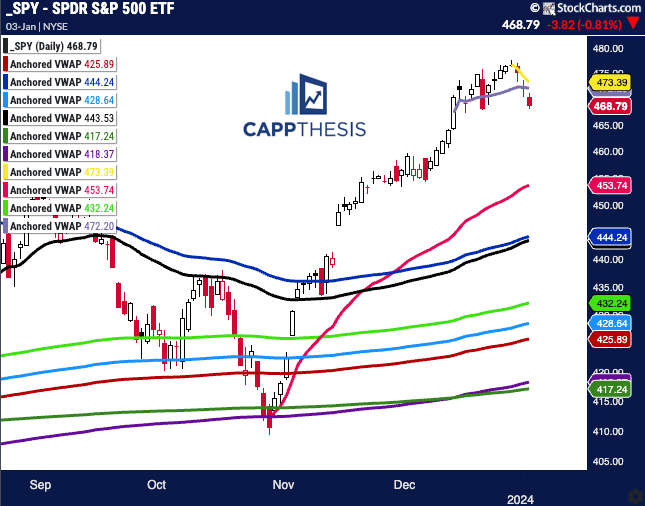
SPY now is below two short-term VWAP lines (resistance). Seeing how it does on the next bounce attempt will be telling.
Yellow: 12/28 – Most recent high
Light purple 12/13 – FOMC
SPY
Pink: 10/27 – October low
Blue: 6/15 – FOMC negative reversal
Black: 8/18 – August low
Light Green 3/13 – March Low
Light Blue: 2/3 – Former high point
Red: 1/2/23 – YTD VWAP
Purple: 1/4/22 – 2022 high
Green: 10/13/22 – 2022 low
Daily Price Action
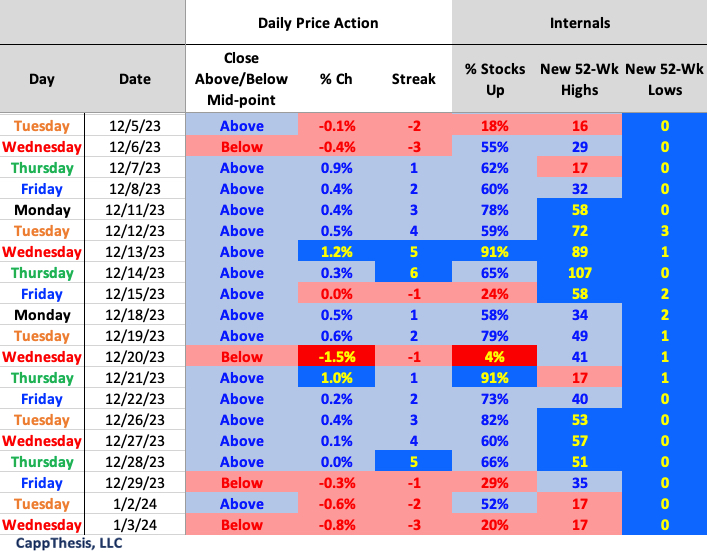
The SPX now has finished below its intra-day mid-point in 2/3 days. We haven’t had 3 in 4 days since 10/24-10/27.
Breadth
The NDX has continued to lag from a breadth perspective.

Sector ETFs
The equal weight sector ETFs got hit a lot harder on Wednesday, with 9/11 down more than 1%.
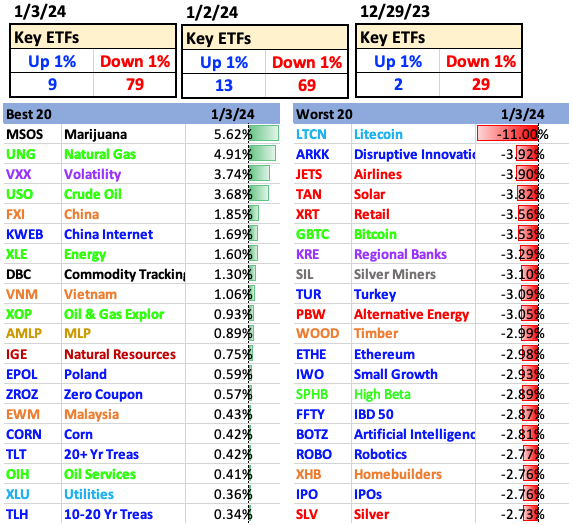
Best and Worst 20 ETFs
The adv-dec breakdown continued to be negatively lopsided.
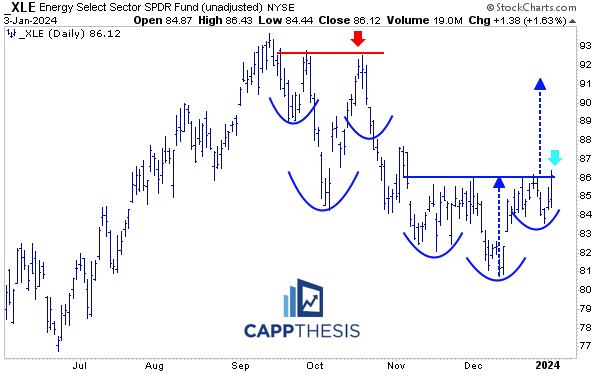
XLE Energy
XLE was the only sector ETF up more than 1% yesterday and now is back to resistance from December and late November. It closed marginally above a multi-week bottoming formation, as well, and now has a target up near 91.
This has taken time to develop, with the last attempt at breaking above 86 failing in late December. It has another chance now. Many of its components look similar.
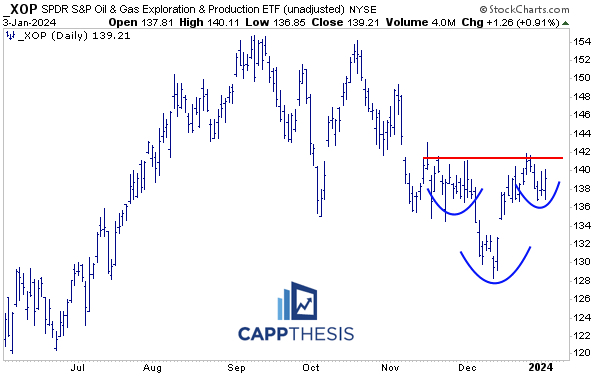
XOP Gas Exploration
XOP hasn’t broken out yet, but it’s close…
OIH Oil Services
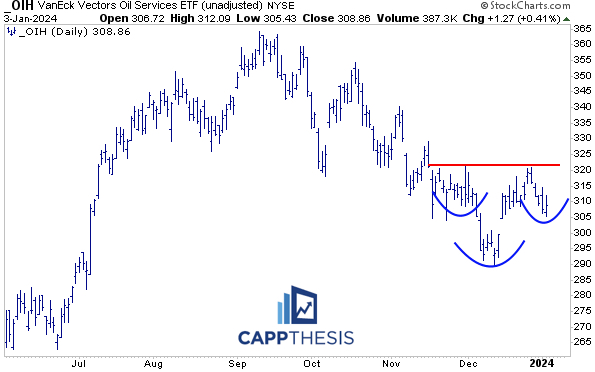
OIH has lagged and remains in a downtrend, but it has a chance to make a higher low and potentially complete its own bottoming formation.
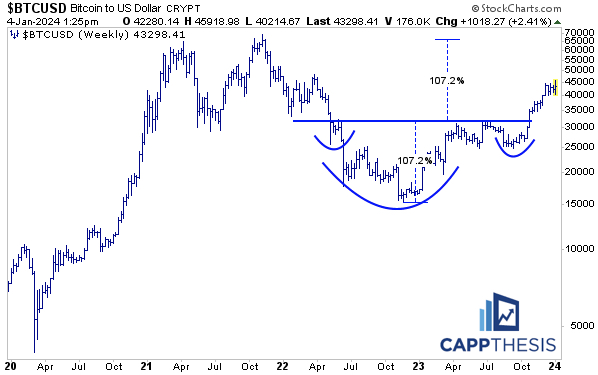
Bitcoin
Despite the recent volatility, Bitcoin’s 14-day RSI has continued to hold near the 50 zone, which it hasn’t been below since mid-October. That’s kept it within the same trading range since early December.
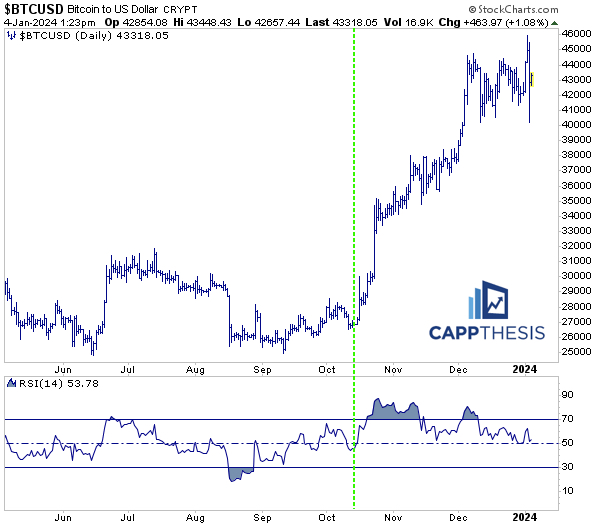
It’s already hit a few of our upside targets, with the biggest one still in play.
