Key Points:
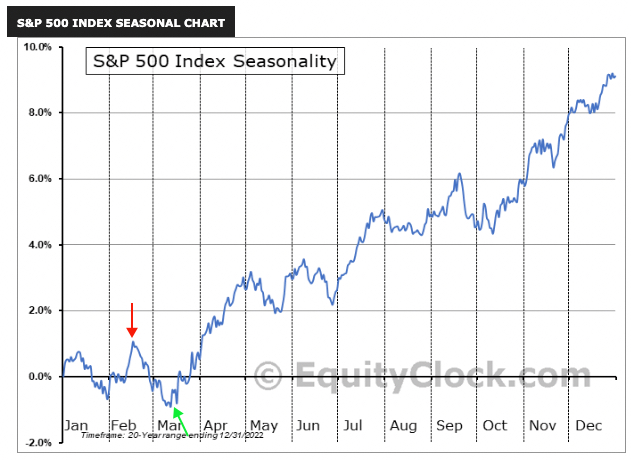
1- With the SPX topping on 2/2, the index has been moving lower most of the month. From a seasonality standpoint, this isn’t too surprising, as the index typically ends February worse than it starts.
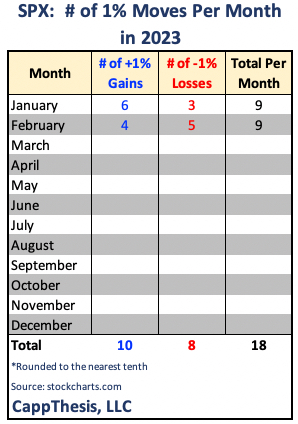
2- The number of +/-1% moves remain high. The SPX is at 18 for the year, with one trading day to go in February. At this rate, we’re on pace for another year with over 100. Through February 2022, the SPX had 19 absolute 1% moves (6 up, 13 down).
3- HYG quietly has been outperforming the SPX over the last few days. While just a blip on the longer-term chart, HYG led the SPX during each of the index’s biggest multi-month rallies since last spring. See below.
Topics discussed:
1- Seasonality
2- Large Daily Moves
3- HYG
4- HYG vs. SPX
5- Grains (Corn, Soybeans, Oats and Wheat)
6- TGT
SPX
The SPX comes into the last day of February with two gains in the last three trading sessions, but they’ve hardly made a dent. In fact, the last three advances in the month’s second half all have been tiny:
SPX Gains since 2/14:
2/27/23 0.31%
2/23/23 0.53%
2/15/23 0.28
The intermittent declines have been more severe recently (three 1% losses in the last seven days). Overall, the index hasn’t been able to shake the steady decline since topping out near 4,200 way back on February 2nd.
From a seasonality standpoint, this isn’t too surprising. February doesn’t have the best track record: Since 1970, the SPX had been up 30/53 times (57% of the time), with an average move of +0.16%. And its intra-month path typically ends worse than it starts. That certainly has held true again in 2023.
Let’s also remember that we’re coming off that huge January. It was only the eighth time the SPX gained at least 6% in the year’s first month since 1970. And while keeping up that pace was highly unlikely, the index had tended to do MUCH better than its historical average after big January performances:
Post January gains of at least +6% since 1970, the SPX logged gains in February 5/7 prior times (a 71%-win rate), with an average move of +1.4%.
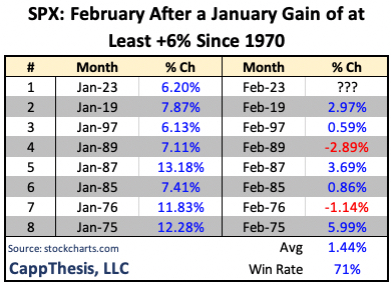
From that angle, this month’s downturn has been discouraging with the SPX currently -2.3% in February.
Seasonality aside, there are other things to consider as we head into March:
Large Daily Moves
Despite the quiet advances lately, the SPX’s +/-1% moves in aggregate continue to be high. We’re at 18 with one trading day to go in February. At this rate, we’re on pace for another year with over 100. Through February, 2022 the SPX had 19 absolute 1% moves (6 up, 13 down).
And regardless of what the VIX does, a high frequency of large moves tells us all we need to know about volatility – it’s still here. That means breakouts and breakdowns should be treated with a discerning eye. In other words, the odds of continued whipsaws on both sides are high.
That only will change if the number of outsized daily moves slow down in a major way. That would be defining characteristic of a trustworthy, mature uptrend. And while that’s certainly a possibility, to get there, we’ll need to see more successful bullish patterns materialize.
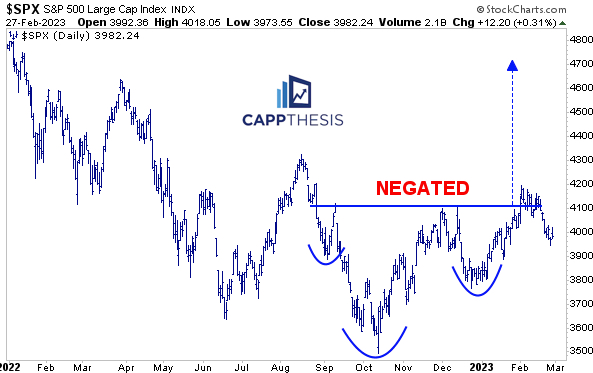
Patterns
Seeing the SPX’s three bullish formations wasted in February put a damper on the comeback efforts, along with two other potential set ups that never were triggered.
Successful bullish formations were the building blocks of the 2020 comeback and the 2021 uptrend that followed. They stopped working in November, 2021 and we know what happened next.
Currently, only the smallest bullish patterns have been successful, i.e., an immediate follow-through post breaking out with an upside target being hit soon thereafter.
As noted yesterday, the market can still climb higher despite this, but it will be rockier ride. With no live patterns currently in play, the SPX has a clean slate to construct the next version in March.
HYG High Yield Bonds
In last evening’s Last Licks Piece, we profiled this chart, showing that HYG quietly has been outperforming the SPX over the last few days.
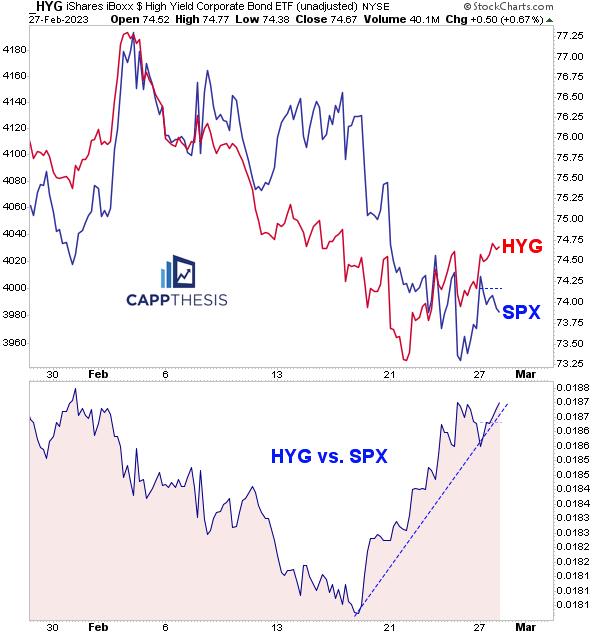
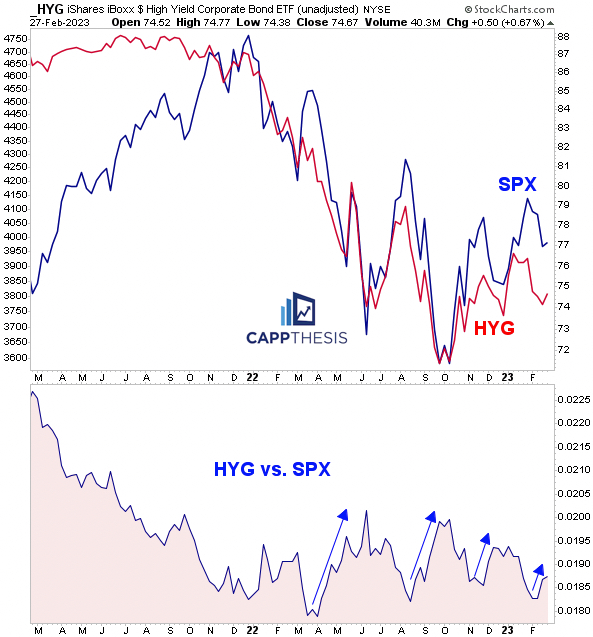
It’s just a blip on the larger chart but considering that HYG led the SPX during each of the index’s biggest multi-month rallies since last spring, we need to pay close attention to this relationship again now.
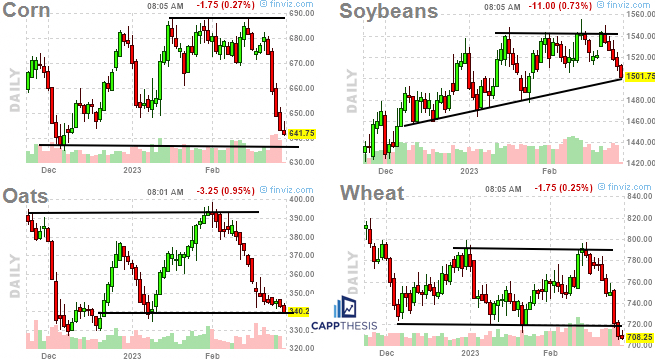
Grains
Corn, Soybeans, Oats and Wheat have completely rolled over after failing at clear resistance points over the last two weeks. All are short-term oversold now. If nothing else, these have respected support and resistance zones lately. That hasn’t mattered for Wheat in recent days, as it made a new low, but we should watch it for a potential turn regardless.
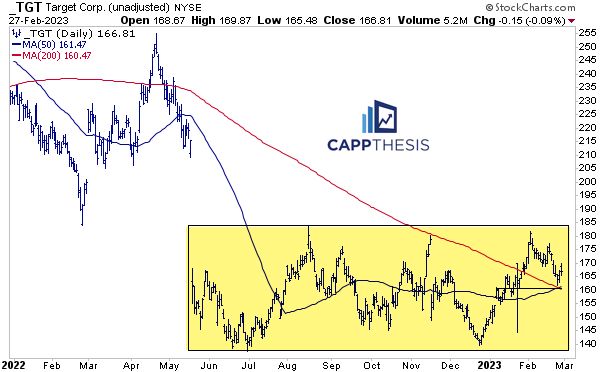
TGT
Respecting the 160 zone is key to keeping the big base potential alive.