Key Points:
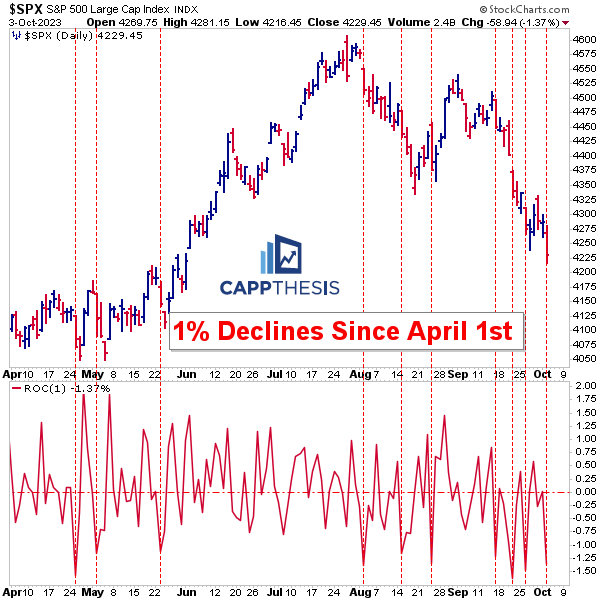
1- With the SPX logging its fourth 1% decline since mid-September, the index now is staring at the confluence of support that we’ve been discussing lately.
2- A key step for a potential change of character would be breaking above the steep downward sloping channel that the SPX has been in the last three weeks.
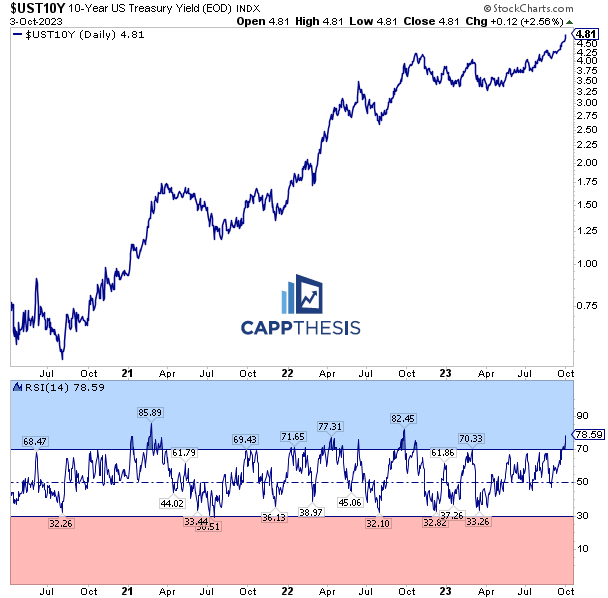
3– Through yesterday’s close, the 10-Year Yield’s 14-Day RSI stands at nearly 79, the highest since 80 from 9/26/22. See more below.
Topics Covered:
-1% declines
-Pattern update
-Trading channels
-Key support
-AVWAP
-Index Breadth
-Sector Perf & Breadth
-Best & Worst 20 ETFs
-10-Year Yield
-XLU
-XHB
-TAN
SPX:
The SPX comes into Wednesday after logging its first 1% decline of October on the month’s second day of trading.
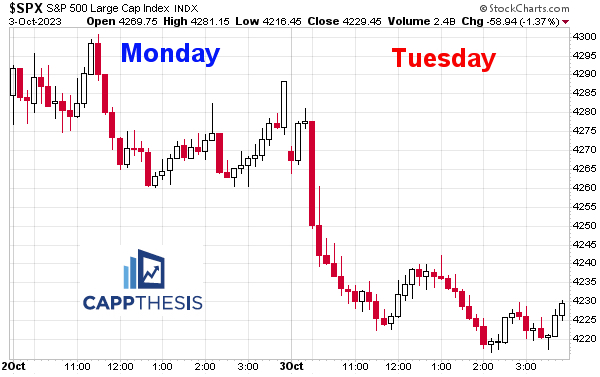
That makes it four 1% declines since September 15th, which still is below the 2022 pace… but not by much.
More importantly, this time has been different in one glaring way:
With the last 1% GAIN happening on 8/29, we haven’t seen a true rally attempt in five weeks.
As this table we display a lot plainly shows, 2022 and the first quarter of 2023 were characterized by a lot of big moves in BOTH directions. This two-way volatility provided whipsaws on both sides of the tape.
And while big moves have returned, they’ve only been present on the downside up to this point.
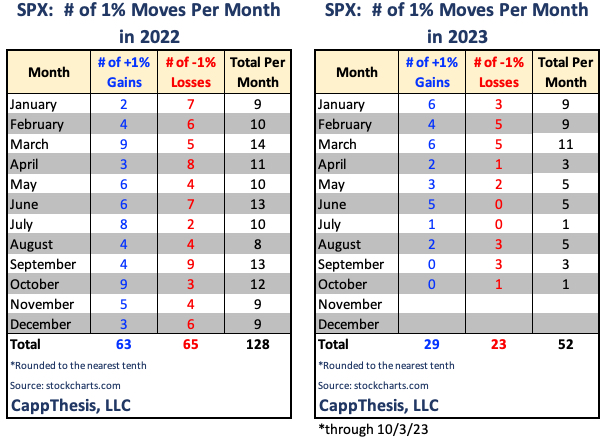
Looked at a slightly different way, it’s now the fourth straight week that the SPX has logged at least one 1% decline. That’s consistently bearish action plain and simple.
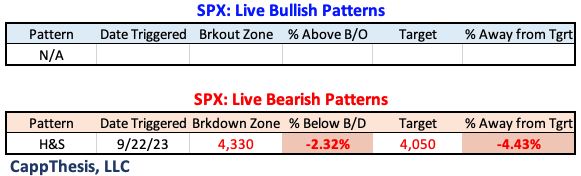
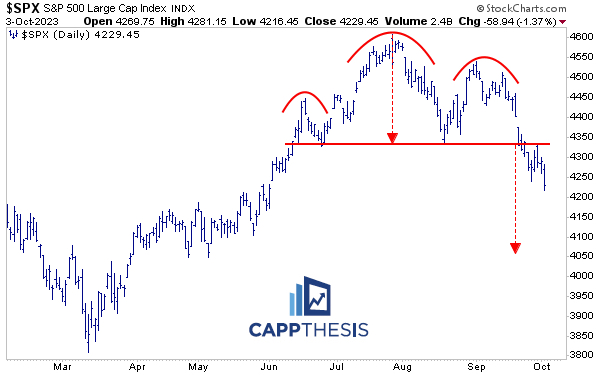
Patterns
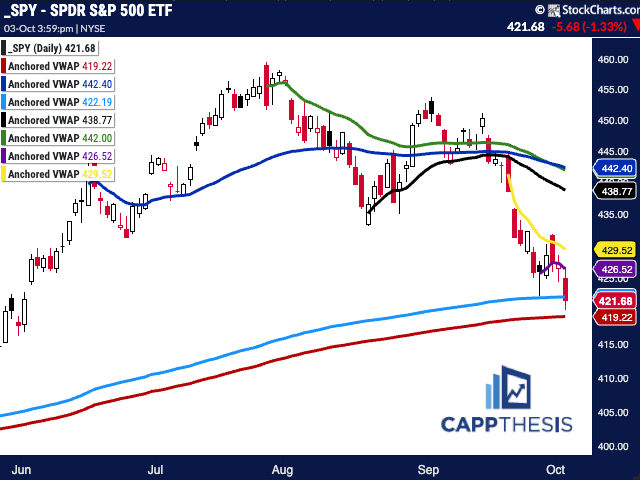
With yesterday’s 1.4% decline, the SPX now is 2.3% below its breakdown zone and that much closer to the downside target of 4,050.
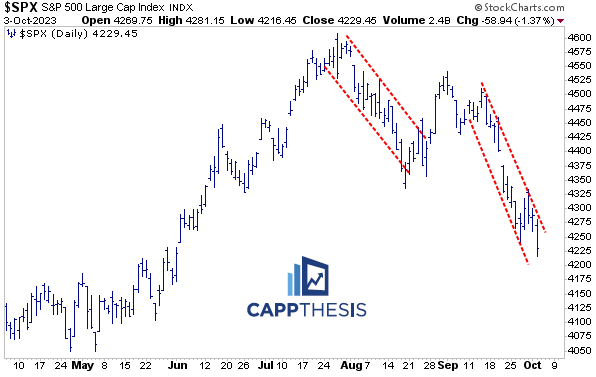
The decline since mid-September has formed this steep downward sloping channel. A key step for a potential change of character would be getting through the upper line. Breaking above a similar trading channel in late August gave way to the quick bounce.
In the Zone
All of this now puts the SPX right in the zone of support that we (and now, many others) have been referencing. Again, identifying a moving average or trendline in isolation is one thing, but a single support line doesn’t hold much water in a bid-less market.
Having five different forms of support, though, very well could help.
Will the crowd be wrong?
Well, we all have our favorite indicators – sometimes to a fault – in that we don’t see what the other metrics are saying. In other words, many are pointing to the same area now but for different reasons, literally forcing more eyeballs on it.
Next step – actually see buyers show up.
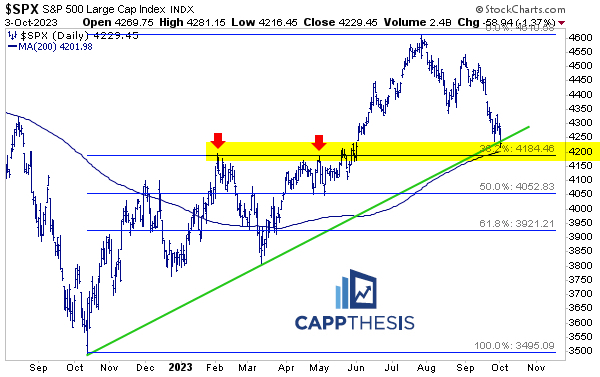
Again, the five forms of support are:
1-The uptrend line from the October lows
2-The 38.2% retracement level of the entire October – July rally
3-4,200 round number significance
4-The 200-Day Moving Average
5-Key former high points from February and May
SPY AVWAP
Yesterday’s weakness force SPY below the 9/27 Anchored VWAP (purple). It’s now back to the line tied to the 2/3/23 high (light blue), which it pivoted from last Wednesday (9/27). This also lines up with the 4,200 zone for the SPX.
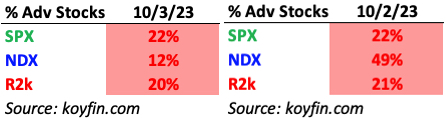
Breadth
Internals were weak again yesterday, with the SPX and R2k both with 20% ratios for the second straight day. The big difference was that the NDX underperformed on Tuesday after Monday’s relative strength.
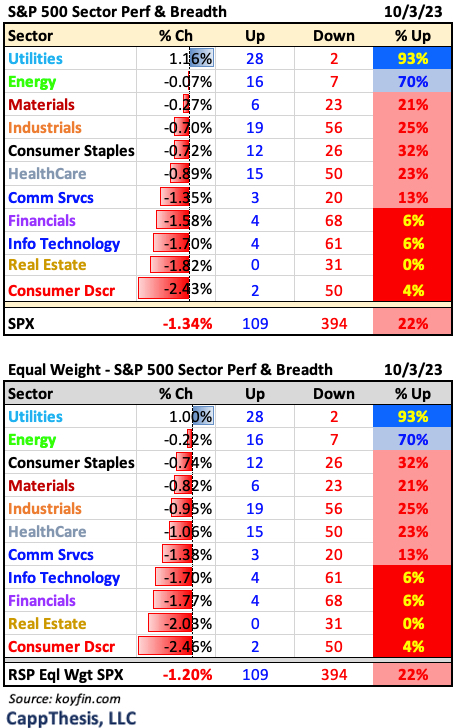
Sector ETFs
The biggest turnaround was, of course, Utilities, with nearly all its components ripping higher after early big losses. That didn’t help the rest of the index, of course, especially with four of the biggest sectors having more than 90% of their holdings decline.
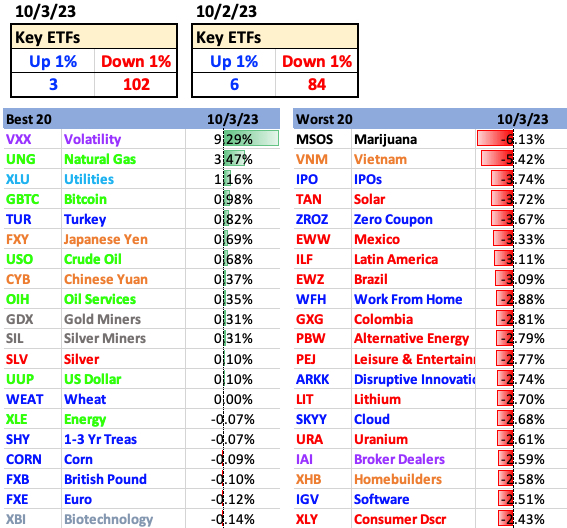
Best and Worst 20 ETFs
It was another lopsided showing, with more than 100 ETFs we track down at least 1%. Seeing the VIX (VXX) and Dollar (UUP) ETFs among the leaders tells us all we need to know.
10-Year Yield
Through yesterday’s close, the 10-Year Yield’s 14-Day RSI stands at nearly 79, the highest since 80 from 9/26/22. Back then, it got as high as 82.5, as we can see on the chart here. It wasn’t sustainable then and it won’t be now either.
But… as we’ve discussed various times over the last few weeks, we saw extreme overbought readings routinely during the run-up from 2021 through the 2022 high. Just as telling, the 10-Year Yield hasn’t been officially oversold since the COVID lows. The epic advance in rates started soon thereafter…
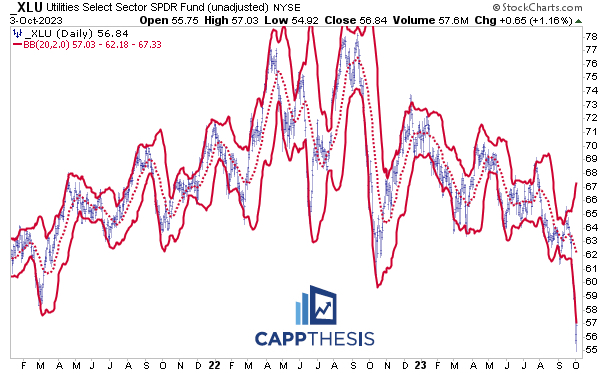
XLU Utilities
Everyone now is wondering if yesterday’s strong positive reversal will mark a key low for XLU. Here’s one angle to consider. The crash put the ETF WAY below its Lower Bollinger Band. This stands out even versus last year’s massive decline. In fact, it closed below the line yesterday for the fourth straight day.
In other words, it’s still oversold.
Notice also how massively wide the bands now are. At the very least, these will need to narrow soon, and if they do, the ETF should trade back within the bands.
The other part is that XLU did this on a day that rates spiked again, showing that perhaps traders bought (covered) in anticipation of the 10-Year finally declining soon. So far today, that could be playing out.
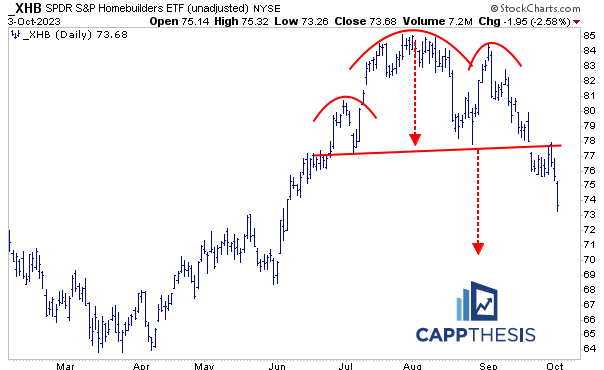
XHB Homebuilders
Seeing how XHB does from here will be instructive given how tied to rates it is, as well. It was down 2.6 %, as it continues to sell off from re-testing its pattern breakdown last week. Continuing to fail near its breakdown zone would keep the target near 70 in play.
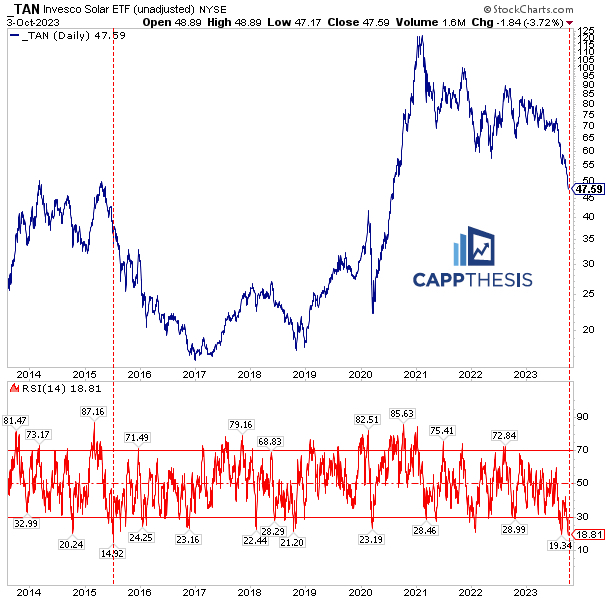
TAN Solar
TAN was down another 3.7% on Tuesday, easily making a new 52-week low. That pulled its 14-day RSI down below 19, which is the lowest since July’2015 (below 15). As we can see, that didn’t mark a low back then – not even close. Every time is different, but any failed rally from here would keep risk elevated.