Key Points:
1- Other than the four-day pop at the end of August, winning streaks have been non-existent since the July high.
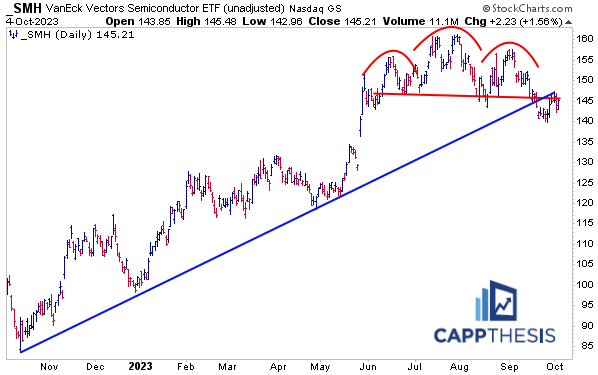
2- SMH Semis was among yesterday’s leaders and given its influence on Tech and the overall market, seeing how it does vs. these two converging trendlines (resistance) will be very significant.
3– This is a major test for Crude Oil, as the current 6-day decline of -11% is the worst since -11.6% from the period ending 5/3/2023 (near the ’23 lows).
Topics Covered:
Market
-Recent streaks
-Winning streaks 2023
-Weekly losing streaks
-SPX, USD, 10-Yr Yield
-Pattern update
-Key support
-AVWAP
Stats
-Index Breadth
-Sector Perf & Breadth
-Best & Worst 20 ETFs
Key Charts
-JETS
-SMH
-IPO
-Crude Oil
SPX:
The SPX comes into Thursday after logging its best gain (+0.81%) since 9/14 (+0.84%). It looked like the first 1% advance since 8/29 was a possibility as the afternoon bounce extended, but the index ran out of time. Thus, it ended the session right near the consolidation zone from late Monday.
It was a good start, coming at a good time, with the collection of support lines near 4,200 on every active trader’s mind (more on that below).
Next step? Follow through… which has been an obvious missing ingredient for weeks now.
We’ve talked about the need to see small changes happen for any major trend shift to occur. This remains the case.
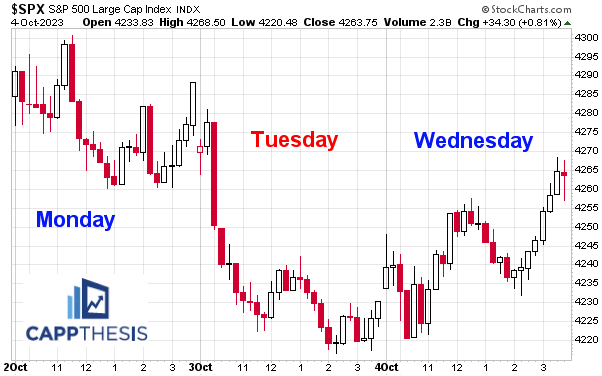
The SPX has alternated between gains and losses the last four trading days. When that happens after a big move in one direction, it suggests indecision. And for those looking for a big positive reversal, indecision can be interpreted as bullish.
While true, it can only occur if traders take advantage of it. Again, yesterday was a solid start, as the strong breadth and market statistics later in the report show.
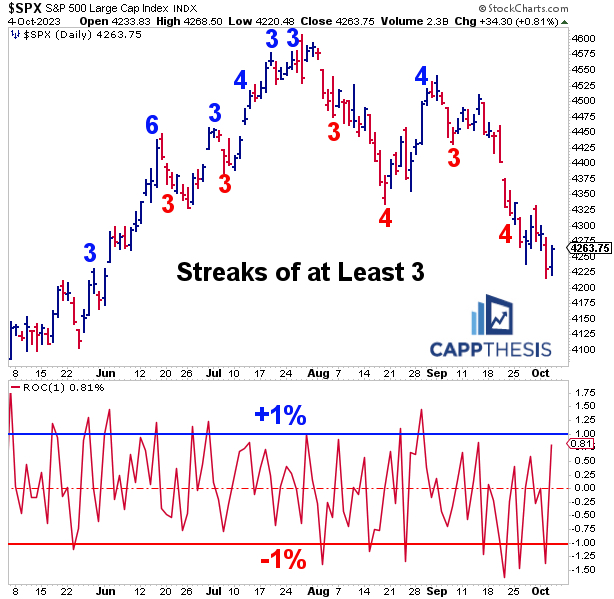
But as this chart depicts, other than that four-day pop at the end of August, winning streaks have been non-existent since the July high. Simply put, consistent uptrends contain strings of successive advances along the way. This has NOT been happening lately.
It appeared that the market was well on its way to recapturing the July highs with that strong, late-August move, but that wasn’t meant to be.
Indeed, we haven’t had a losing streak in two weeks either, but the down days continue to be bigger than the up days, as the rate of change panel depicts. Obvious, but noteworthy.
All of that needs to change before we get too excited about a day or two of gains.
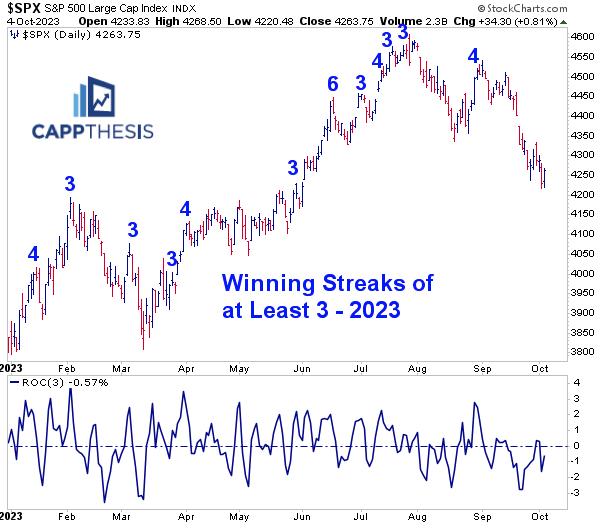
Here are ALL of the winning streaks of at least three so far in 2023, along with the running 3-day rate of change. Not surprisingly, as the number of streaks has decreased, the average 3-day move has, as well.
Sticking with the “streak” theme, the SPX is trying to avoid logging its fifth consecutive down week, as well. That would be the worst weekly run since it lost seven straight from April-May 2022.
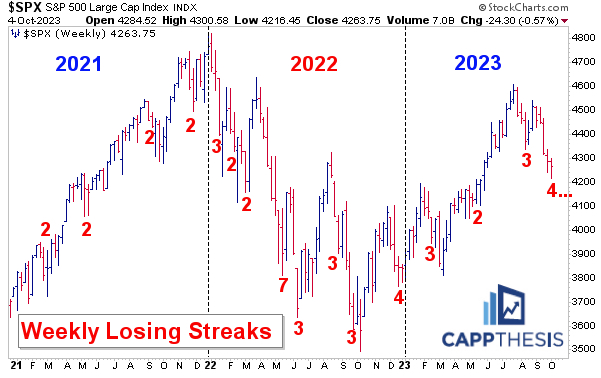
Like we’ve discussed recently, it’s clear that the SPX isn’t behaving like it did in 2021, when it consistently advanced all year. Lately, it’s been more like 2022, which obviously has been bearish. That said, the worst was over by mid-October a year ago. We’re nearly there again…
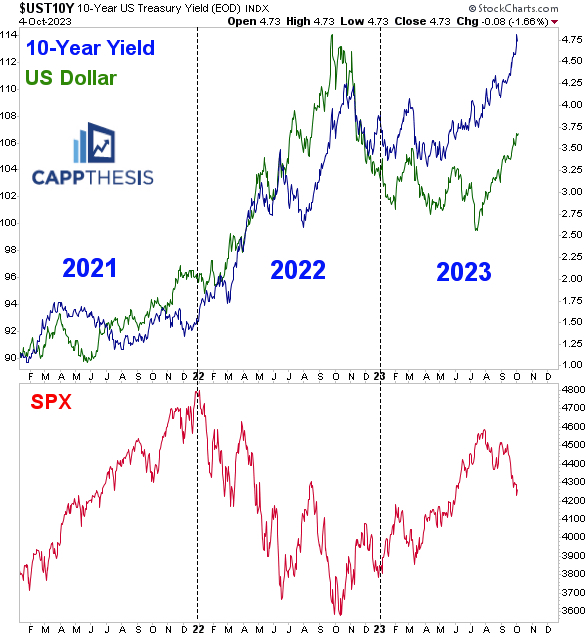
We just need rates and the dollar to do an about face like they did then. This really is the only chart that matters…
Patterns
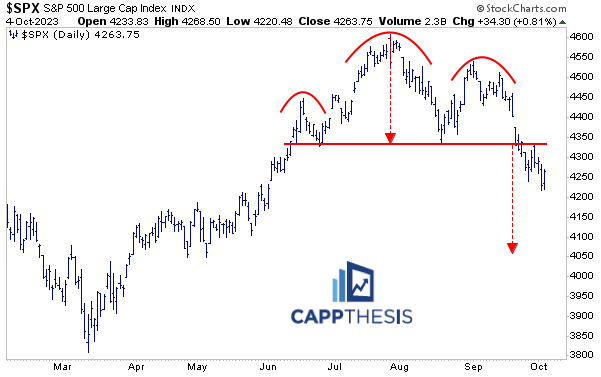
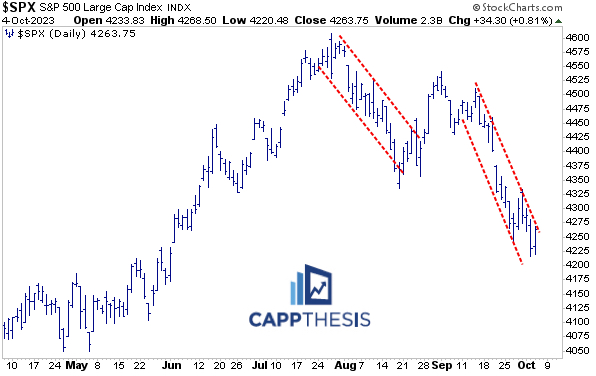
The SPX remains 1.5% below its breakdown point, as the 4,050-downside target still is in play.
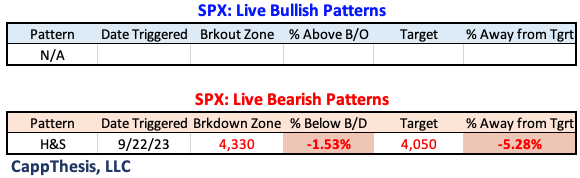
The important support zone will need to be taken advantage of soon to prevent greater damage.
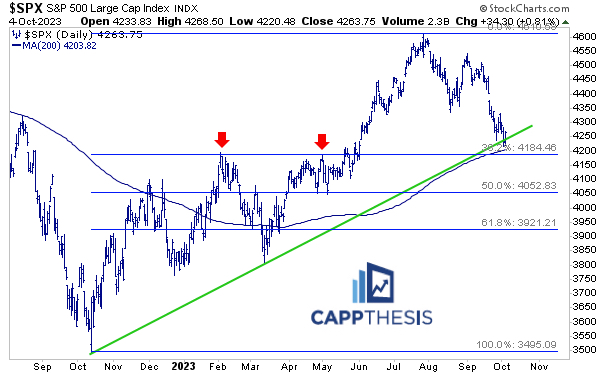
Seeing the SPX break through this downward sloping channel could help encourage follow-through.
SPY AVWAP
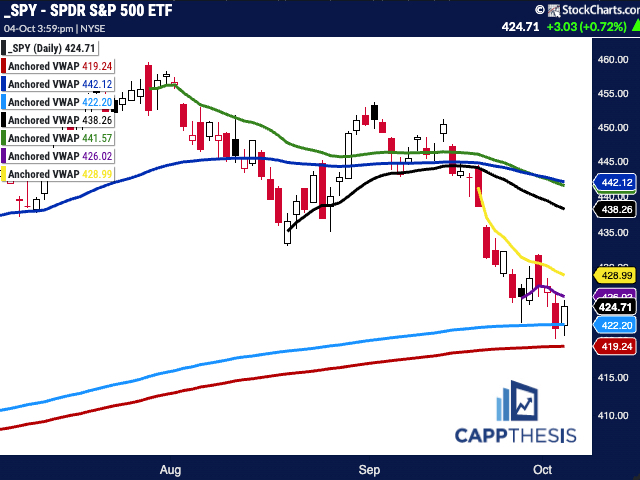
SPY remains below the 9/27 Anchored VWAP (purple), but it again bounced at the line tied to the 2/3/23 high (light blue). This is important to hold, as it lines up with the 4,200 zone for the SPX.
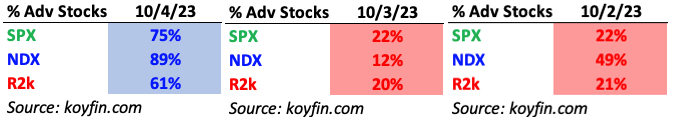
Breadth
Yesterday provided the best internals we’ve seen lately, especially for this week. The NDX was back in the lead for the second time in three days.
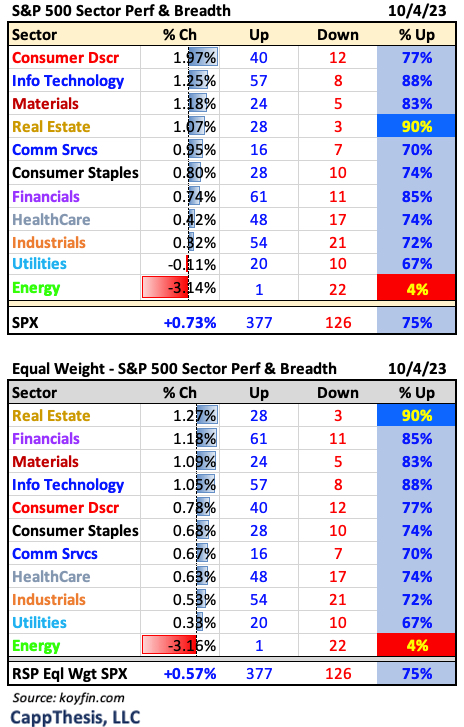
Sector ETFs
Five of the SPX’s sector ETFs were up at least 1%, including all three growth-related ones – XLK, XLY and XLC. But Energy’s big decline put a damper on the otherwise broad advance.
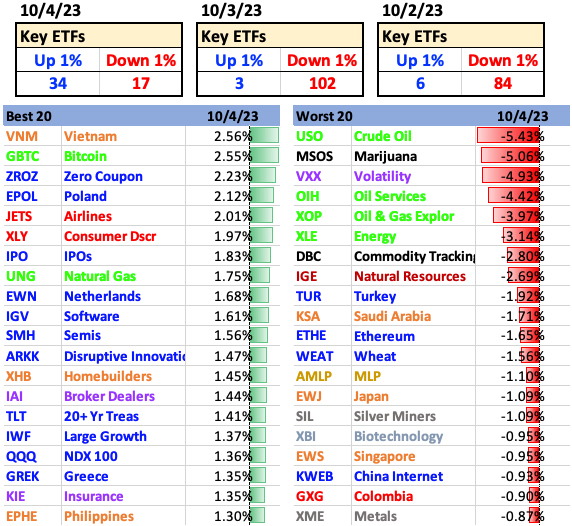
Best and Worst 20 ETFs
For the first time this week, more ETFs had 1% gains than losses. Again, seeing a huge amount of blue tells us that both Growth-related ETFs led, along with bonds (with rates moving lower).
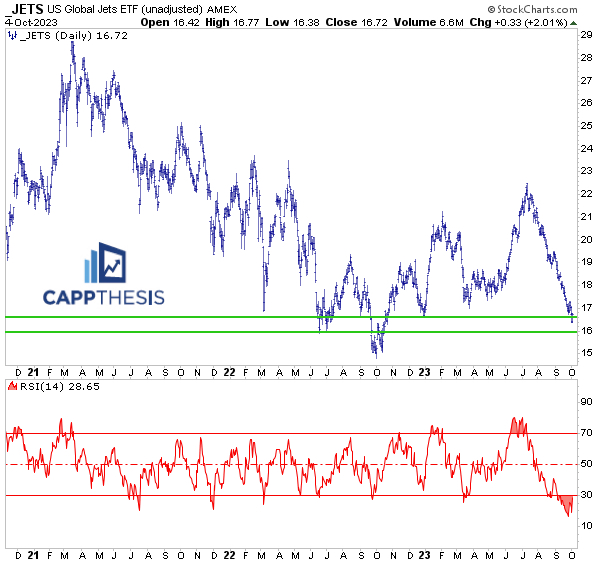
JETS Airlines
We’ve discussed JETS a few times recently, but it remains an important one to watch for one major reason: It’s down over 25% from its high, and if there’s going to be a sizable market-wide bounce, we’ll see the most beaten-up areas like this respond in a material way. It was our best domestic equity ETF yesterday.
SMH Semis
SMH led, too, and given its influence on Tech and the overall market, seeing how it does vs. these two converging trendlines (resistance) will be very significant.
IPO
The IPO ETF isn’t very liquid, but it’s among just a few ETFs to have NOT triggered a major topping pattern yet. And as we can see from this chart, there are TWO potential bearish formations waiting to be broken. Seeing IPO hold instead would be a sign that there’s interest in speculative growth.

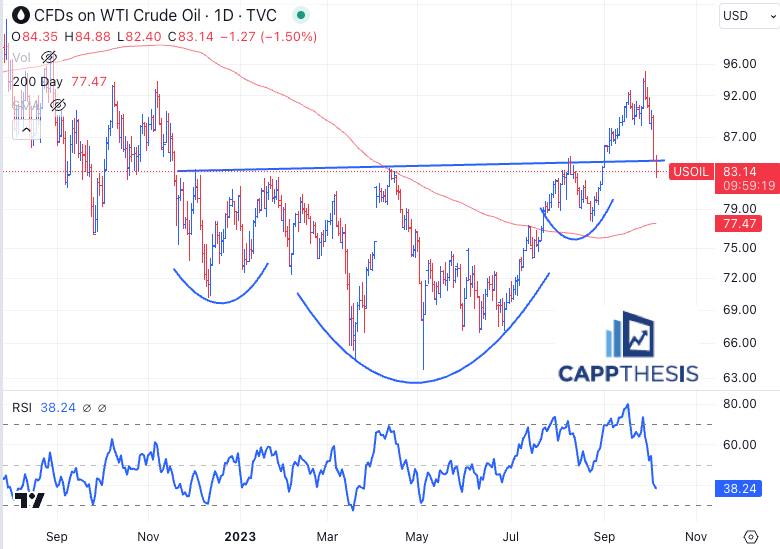
Crude Oil
This is a major test for Crude Oil, as the current 6-day decline of -11% is the worst since -11.6% from the period ending 5/3/2023. Back then, the next day, the huge positive reversal occurred, making the low for 2023. Not surprisingly, its 14-Day RSI now is at the lowest mark since early May, as well.
With this happening right near the September breakout, seeing demand surface soon would tell us that the foundation remains in play and another up-leg could start soon.
For those who missed said breakout, here’s the dip they were looking for…