

Key Points The SPX logged its second straight gain, which comes after three losses as the recent back...
Read More
Key Points The SPX logged its first 1% gain in eight days yesterday, snapping a modest three-day losing...
Read More
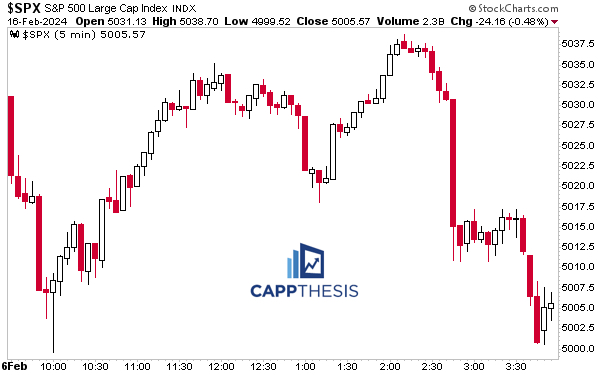
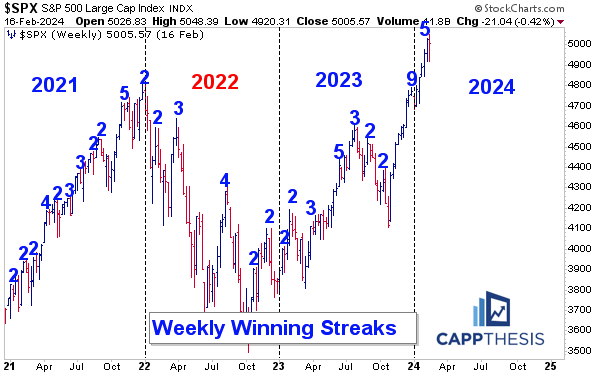
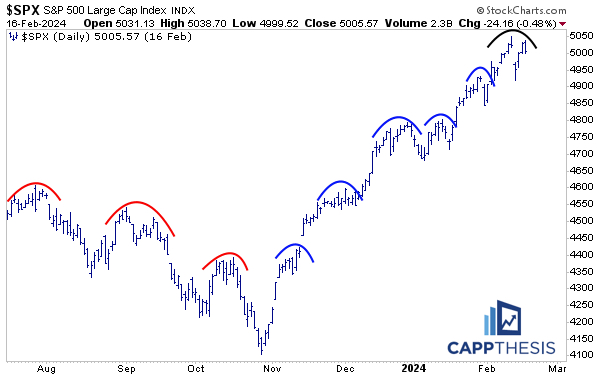
Key Points The SPX hung on just enough to notch its 7th straight weekly gain last week, but Friday’s...
Read More
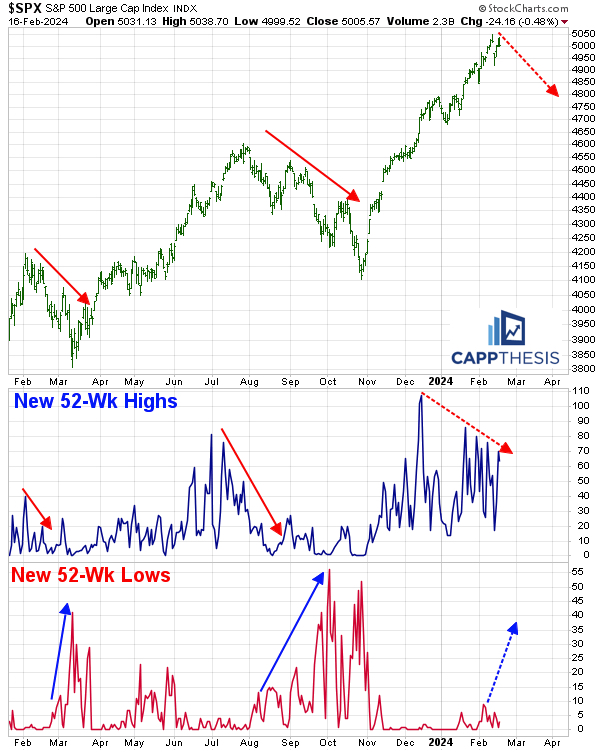
SPX – Overbought for 8 Straight days This is pretty rare, with the last occurrence (of eight or more)...
Read More
Key Points The SPX followed through after Tuesday’s reversal and notched a fresh record, led by Tech....
Read More