Key Point
The FOMC’s hawkish cut unleashed one of the harshest declines we’ve seen in 2024. We assess the updated technical landscape below.
Topics Covered
Market
-Bottom of the channel
-Short-term
-% of oversold SPX stocks
-Long-term trend
-Live patterns
-Potential patterns
-AVWAP
Daily Stats
-Daily price action
-Index breadth
Key ETFs
-Extremely Oversold ETFs
-SPX, 10-Year and USD
-Bitcoin (2)
Intra-Day
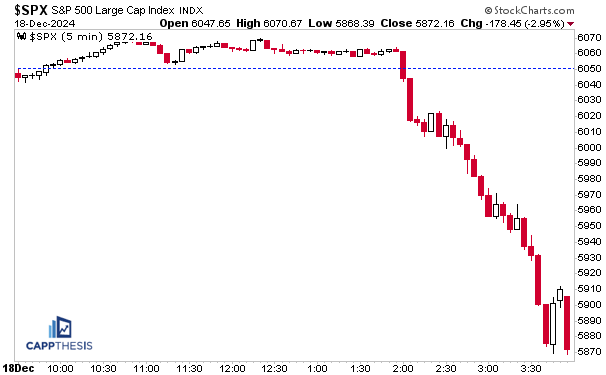
The post-cut reaction had clear, one-sided downside volatility on Wednesday.
Bottom of the Channel
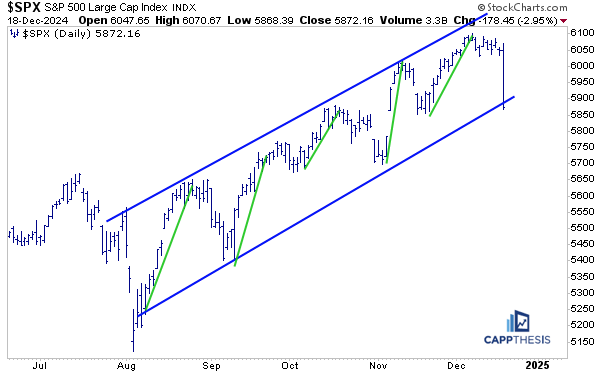
First, the near 3% decline pulled the SPX all the way down to the bottom of its four-month trading channel. So, while it happened all at once, the index once again pulled back after 1-getting close to the channel’s upper boundary and 2-breaking the short-term uptrend line.
We had displayed this via the RSP Equal Weight ETF over the last week, and, clearly, with the large cap growth stocks getting whacked yesterday, the SPX now has caught down.
On the flip side, if the higher lows scenario is going to persist, then we’ll see another bid materialize relatively soon. As we’ll recall, the last near-3% decline happened on 8/5, and it was followed by FIVE 1% advances in the next 10 trading days. The last 1% gain recently was on 11/6 – the day after the election. A face-ripper is due again soon.
Short-Term Oversold
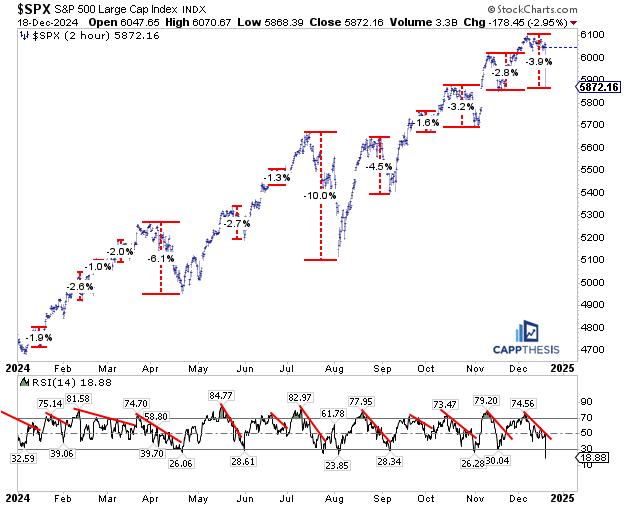
The total drawdown from the highs now stands at 3.9%, which, as of now, lines up with the prior pullbacks in 2024. By our count, it’s the fourth biggest behind the spring and summer drawdowns.
However, given that the 3% down day happened in just two hours, it really hit the short-term momentum indicator work. By the close, the SPX’s 14-period RSI on the two-hour chart was at 18.9, which is the lowest level since June’22. The strong, albeit short-lived, summer bear market rally commenced soon after that.
% of Oversold S&P 500 Stocks
As we know, with most of the market reeling even before yesterday, many stocks had fallen to oversold territory. Specifically, 12% of the S&P 500’s holdings had 14-day RSI readings below 30 yesterday before the rate decision was announced.
That number more than doubled by 4:00 yesterday to 28%. As noted on this chart, that’s very extreme vs. what we’ve seen over the last four years. It’s easily the highest amount of 2024…
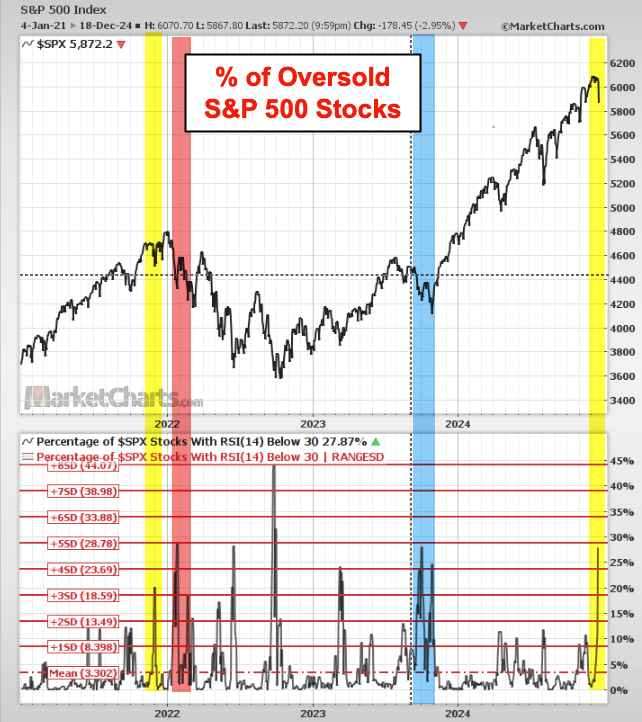
Three different periods of are highlighted above, showing the instances when the % of oversold SPX stocks spiked above 20% (the other times occurred during, and slightly after, the bear market).
Blue – Fall 2023 – a major low point was soon etched.
Yellow – Q4 2021 – the market regrouped and made one last new high to
conclude the year.
Red – Jan 2022 – The beginning of the 2022 bear market.
Given that the SPX has been trading near its highs, as of now, this looks most like the Q4 2021 period. That is a risk given what happened next, so we have to monitor the next few weeks very closely.
Long-Term Trend
This may be the most important long-term chart to watch for a potential major trend shift. We’ve shown this before (most recently for the SMH Semiconductor ETF). It’s a weekly chart that has three key moving averages – the 13-, 20- and 40-week lines. Needless to say, the best-case scenario has been in place for a while: the SPX has been trading above all three upward sloping averages. And when the index has pulled back during the biggest volatility periods, the lines have acted as support.
The same was true for most of the trading period from the COVID lows through late 2021. Again, just when the number of oversold stocks spiked, these lines began to roll over, and once the SPX undercut all three, the long-term uptrend was in jeopardy. From that point, the weekly averages acted as resistance until the SPX finally broke above them for good in early 2023.
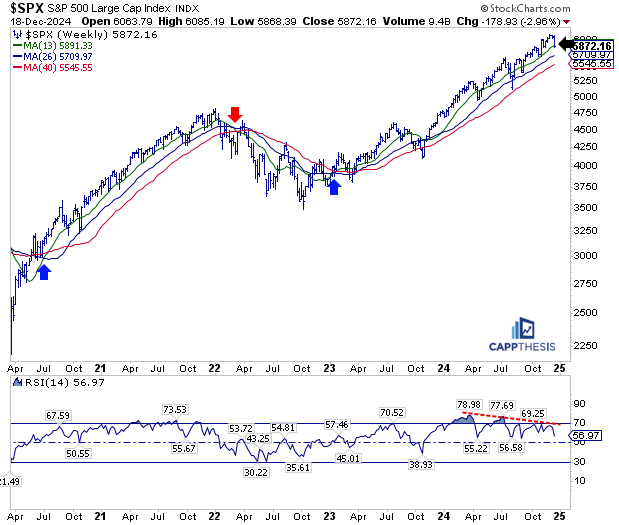
We’re clearly not at that point now, with the SPX only touching the shortest 13-wk line. In fact, the index actually undercut all three during the late 2023 correction. But with the market turning higher so quickly soon thereafter back then, the lines, themselves, never faltered. It takes consistent selling for the weekly moving averages to roll over.
Yesterday could be the start of that, but it definitely did NOT mark a major turning point from this perspective. It’s all about the follow through.
Live Patterns
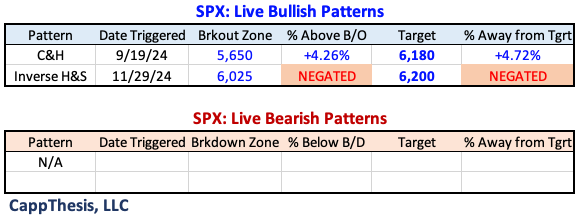
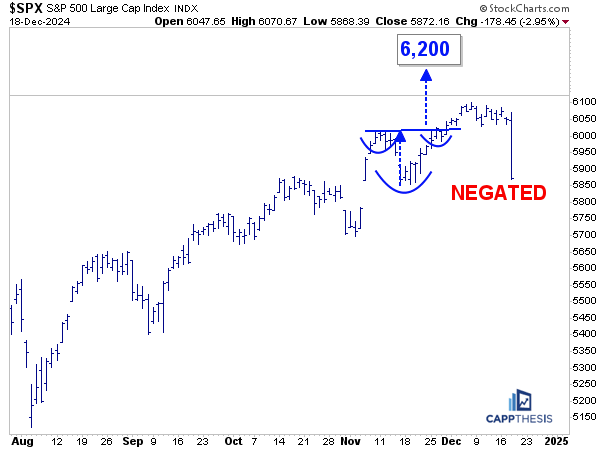
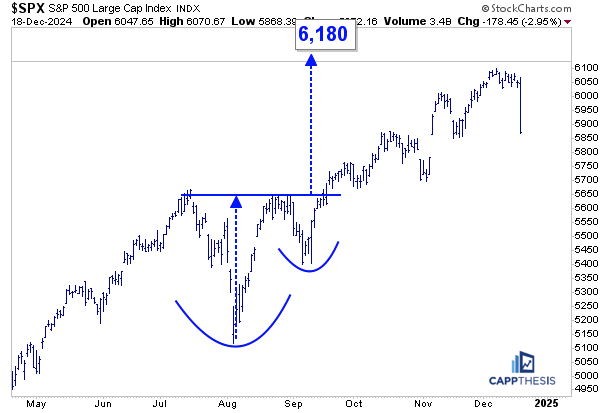
The small bullish pattern with a target of 6,200 was quickly negated with the sell off. The 6,180 objective remains in place.
While we never like to see upside targets wasted, this was a small formation, and the SPX never extended too far from the 6,025-breakout zone.
As noted recently, for us to get a much higher target, we literally needed bigger intermittent pullbacks. That’s how we got the long-term 6,100 target (that was hit on 12/6). High volatility periods literally are the building blocks for the biggest patterns. Indeed, sometimes those take a while to form, but that’s what we’ll be looking for, especially in 2025.
Potential Patterns
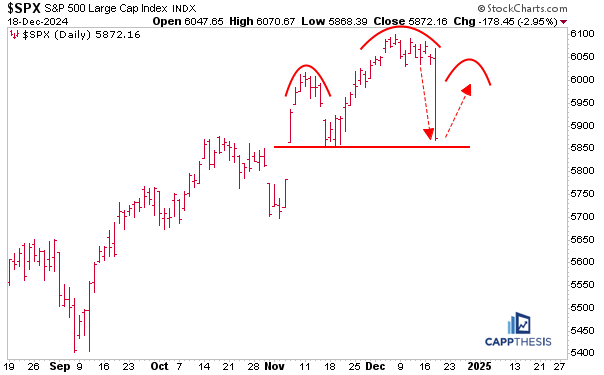
Given that the SPX never extended beyond 6,100, the bearish scenario remains a possibility. We’ll know A LOT by how the next bounce plays out. A lower high would crystalize what could be a bearish H&S pattern.
SPY AVWAP
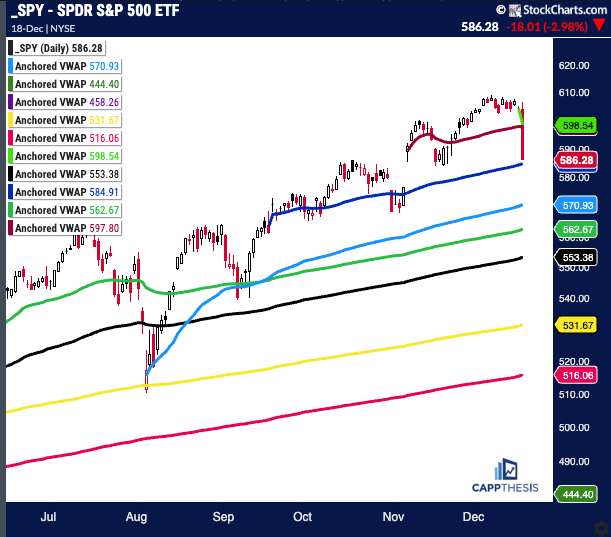
We cleaned up the VWAP lines and removed some points that no longer are relevant. SPY now is below the election day spike VWAP from 11/6 (red) and closed very close to the VWAP anchored to the first 50 bps-cut (blue), which is very appropriate to what happened yesterday.
Light Green: 12/18/24 – Hawkish Rate Cut
Red: 11/6/24 – Election spike
SPY
Blue: 9/18/24 – Fed cuts rates 50 bps
Light Blue: 8/5/24 – Pivot low
Red: 10/31/24 – Gap lower
Green: 5/31/24 – Pivot low
Yellow: 1/2/24 – YTD VWAP
Pink: 10/27/23 – October’23 low
Purple: 1/4/22 – 2022 high
Green: 10/13/22 – 2022 low
Daily Price Action
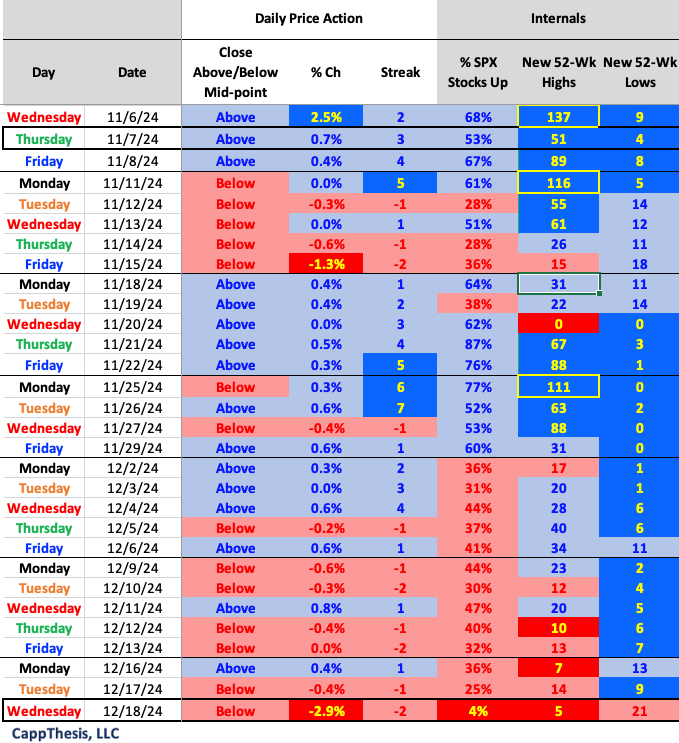
It was as bad as it felt, with the 21 new 52-week lows being the most since 23 from August 5th, among other bearish stats.
Breadth
The SPX and R2k got hit extremely hard with 4% and 3% advancing stocks, respectively.

Extremely Oversold
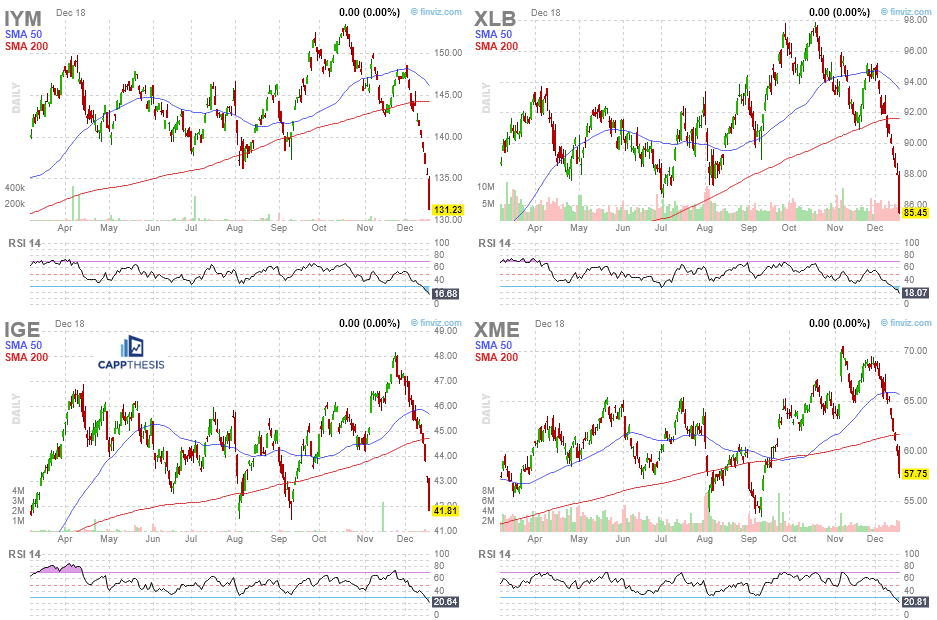
Four ETFs we track ended yesterday with 14-Day RSI readings of 20 or lower. IYM Chemicals, XLB Materials, IGE Natural Resources and XME Metals & Mining. While their charts now are wrecked, they are the most depressed ETFs we track and could bounce the most in a market-wide rebound.
SPX, US Dollar and 10-Year Yield
A major question after yesterday is whether rates and the US dollar will continue to advance. We’ve shared this chart before; it shows what the SPX has done after major trading lows in both the dollar and 10-Year Yield. In 2022 and 2023, the SPX suffered. In 2024, it hasn’t mattered… yet
The SPX has been able to withstand the uptrends in USD and the 10-Yr so far given that they have remained in the same ranges that have confined the price action since 2022. Yesterday, both the yield and the dollar made multi-month highs (multi-YEAR highs for the dollar). Simply put, if this continues, it will be challenging for equities… and vice versa.

Bitcoin
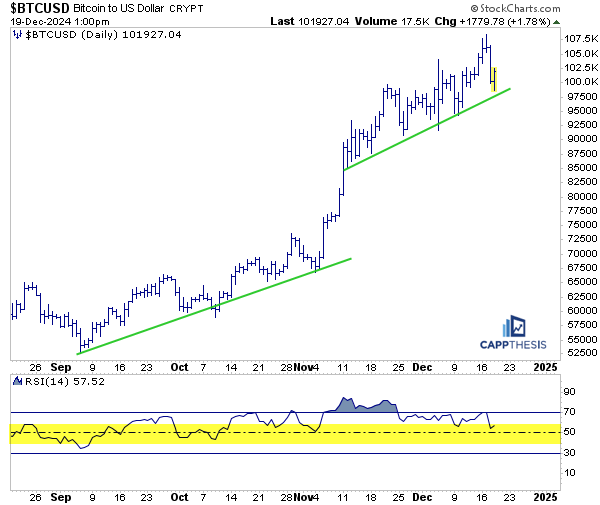
Bitcoin fell 9% from its most recent high, which is a lot – for anything that is NOT crypto-related that is. For BTC, this is the FIFTH drawdown of at least 8% since it bottomed in October…
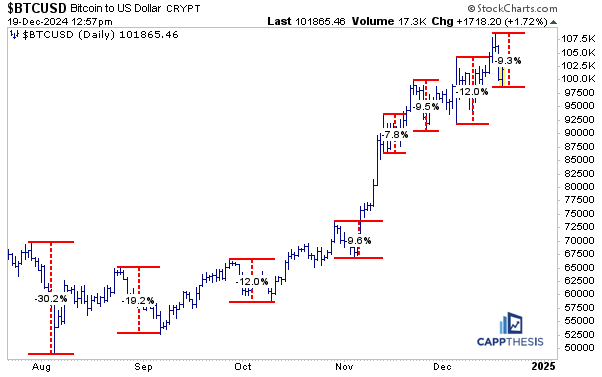
Thus, it’s most recent uptrend remains in play.
