Key Points:
1- We look at yesterday’s reversal vs. the one on 7/27 and how the response needs to be different over the short-term.
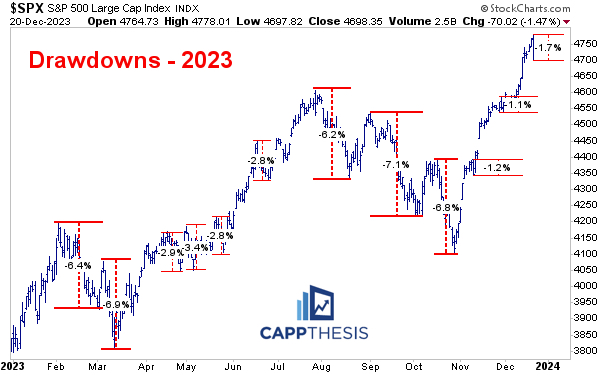
2- The SPX’s drawdown from the 12/20 high is 1.7%, which still is among the smallest of 2023.
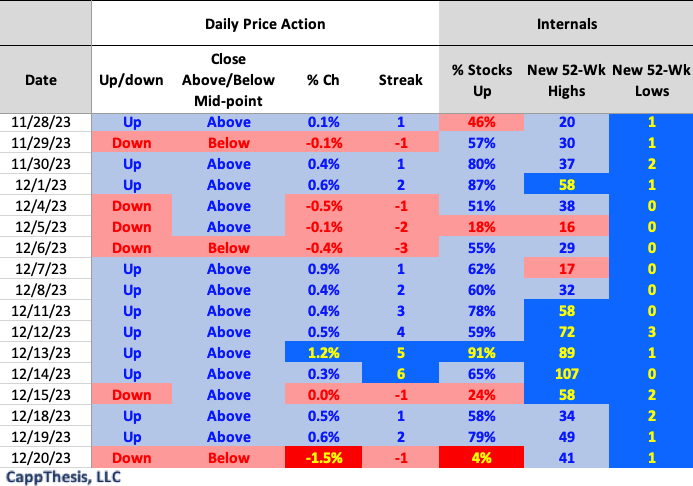
3- One metric we should watch closely from here is the number of new 52-week highs, which hit a high of 107 on 12/14.
Topics Covered:
Market
-1% declines
-Now vs. Late July
-Biggest multi-week rallies
-Bollinger Bands
-Breadth
-X Survey
-Patterns
-AVWAP
Stats
-Daily Price Action
-Index Breadth
-Sector Perf & Breadth
-Best & Worst ETFs
Key Charts
-SMH
-Bitcoin
-US Dollar, 10-Year Yield, SPX
SPX:
Yesterday’s late afternoon plummet caused quite a stir…
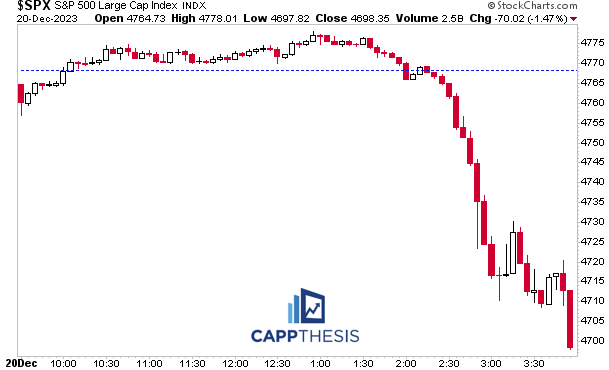
As late as 1:40 PM yesterday, the breadth among the major indices all were positive. The R2k had more than 75% of its components up on the day.
By 4:00, the numbers were as negative as we’ve seen for any trading session in 2023. Here is a side-by-side comparison.
Index Breadth – 1:40 vs. 4:00

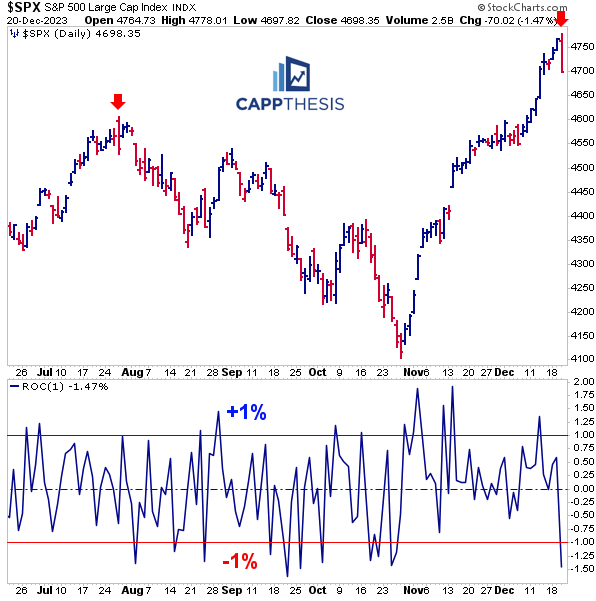
Given the unperturbed advance the last seven-plus weeks, yesterday’s 1.5% decline shook things up in a material way no matter where we look. First, it was the first 1% decline in 36 days, which ended the second-longest streak without a 1% loss of 2023 with authority.
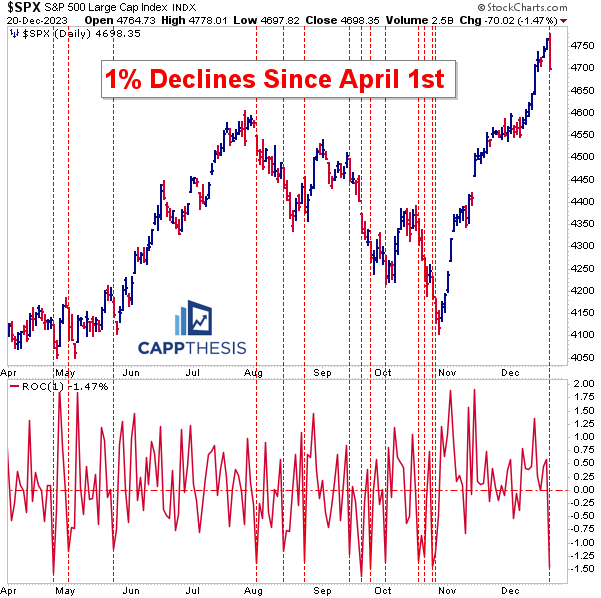
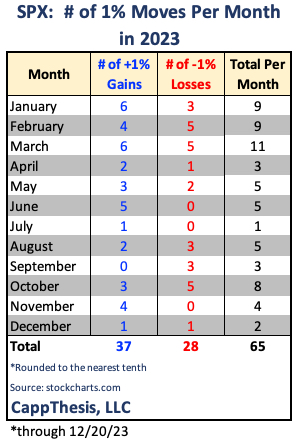
Thus, it also was the first 1% decline of December, which matches the one 1% gain so far this month (on Fed Day last week). With just over a week left of trading for the year, there’s still time to add to both tallies…
As mentioned just yesterday, the ultra-calm environment was due to end. It did.
The question now is whether this harbors in a reversal as swiftly as the last huge outside negative day did on July 27th.
That scenario is an obvious one to compare yesterday’s action to regardless of the different reasons blamed for the two downturns.
The follow through now is important.
As we’ll recall, the SPX followed the big reversal back then with two small gains. And while the index notched new closing highs for the year both days, it failed to reclaim the 7/27 intra-day peak. The August swoon quickly followed…
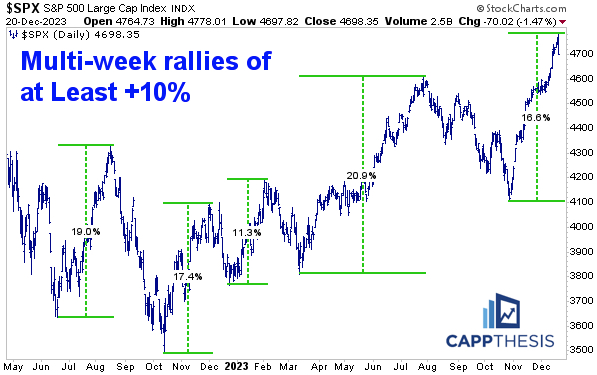
The SPX gained about 16.5% from the October 27th low through the 12/20 high, which is a lot in just over seven weeks. While we saw bigger moves this past spring-summer and last summer, as well, those rallies weren’t THAT much larger than this extension.
Again, when the reversal happened after August’22 and July’23 peaks, momentum quickly flipped. We’ll get an idea if this time is any different soon from this perspective.
Drawdowns
Intra-day, the damage felt really bad yesterday… but bigger picture, the drawdown still is less than 2% from its peak. And that’s still among the smallest of 2023.
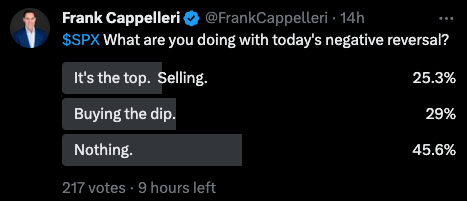
Sentiment
And because of that, many respondents to my latest X survey don’t feel the need to do anything just yet…
Indicators
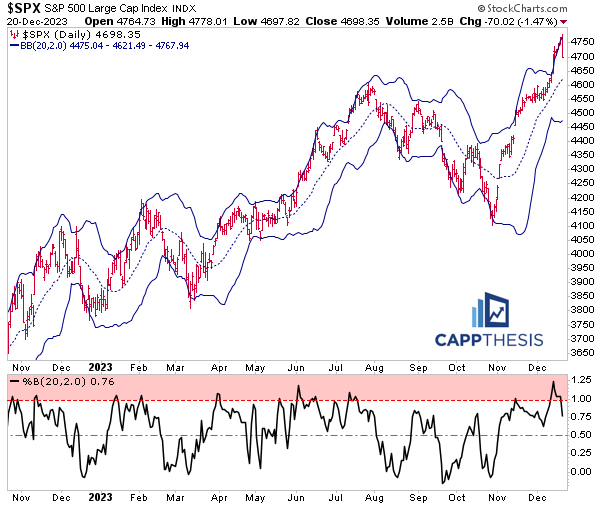
Most indicators now show the same kind of scenario after yesterday, with all now finally off of an extreme level. This includes the Bollinger Bands, as the SPX now is back under its upper band. Seeing the index hold near the middle line (the 20-day MA) would be the best-case scenario.
Again, in early August the downturn sliced right through the 20-day MA and hit the lower band, showing that momentum had flipped to negative – a scenario we’d like to see avoided this time.
Breadth
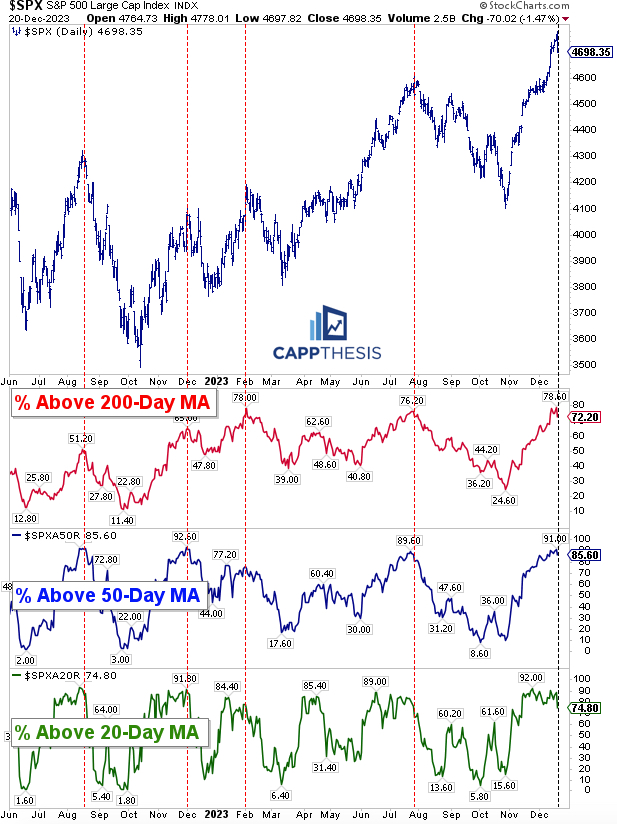
The % of SPX stocks trading above their 200, 50 and 20-day MAs all had gotten to extreme levels that eventually marked trading tops over the last 18 months. Again, it’s now about dealing with the first punch.
Patterns
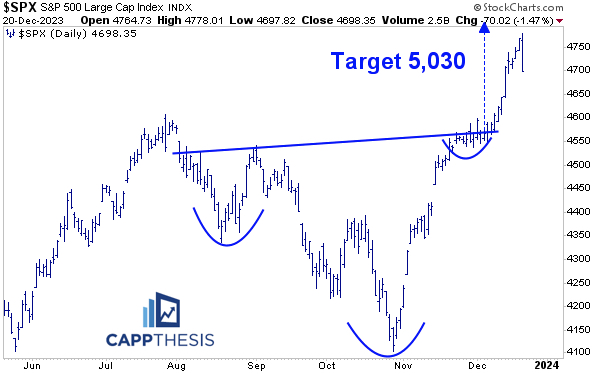
The big breakout still is in play, with a target near 5,030…

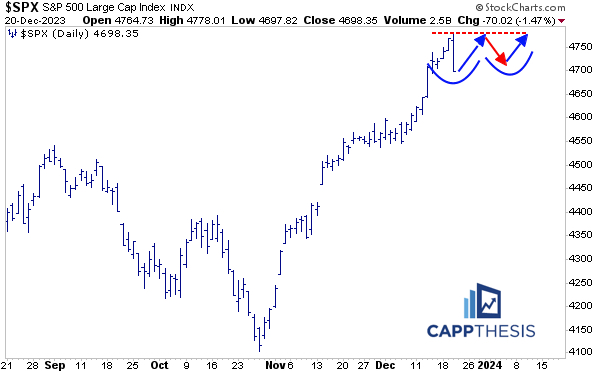
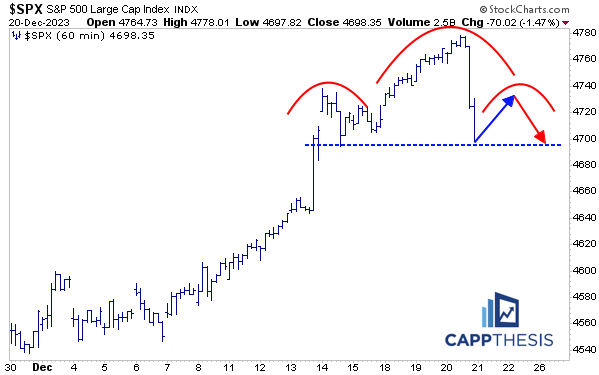
And now the SPX has a chance to form its next pattern… here are two potential bullish and bearish versions to monitor.
SPY AVWAP
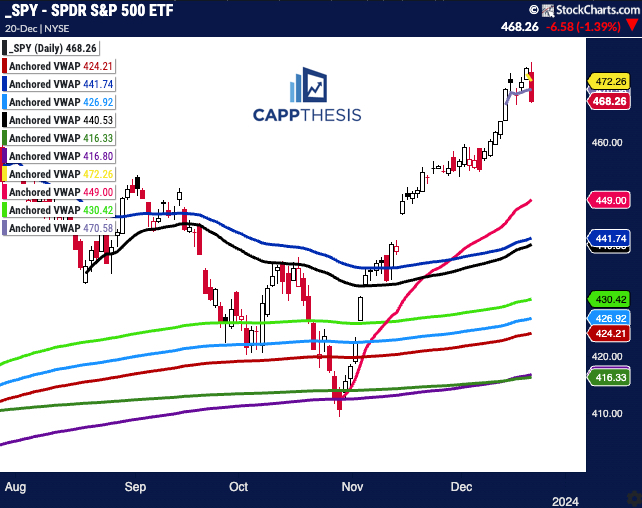
With the nasty reversal, the near-term VWAP levels will begin to matter again.
As such, we’ve adjusted this list to better reflect where SPY is in relation to the key lines. Currently, SPY is below the VWAPs anchored to yesterday’s high and the last FOMC day on 12/13. Staying beneath both would keep downside pressure on.
Yellow: 12/20 – Most recent high
Light purple 12/13 – FOMC
SPY
Pink: 10/27 – October low
Blue: 6/15 – FOMC negative reversal
Black: 8/18 – August low
Light Green 3/13 – March Low
Light Blue: 2/3 – Former high point
Red: 1/2/23 – YTD VWAP
Purple: 1/4/22 – 2022 high
Green: 10/13/22 – 2022 low
Daily Price Action
Yesterday’s red day sticks out like a sore thumb. One metric we should watch closely from here is the number of new 52-week highs, which, at the very least, should be subdued over the short-term as stocks try to regroup.
Breadth
Seeing a strong rebound in breadth soon seems important.

Sector ETFs
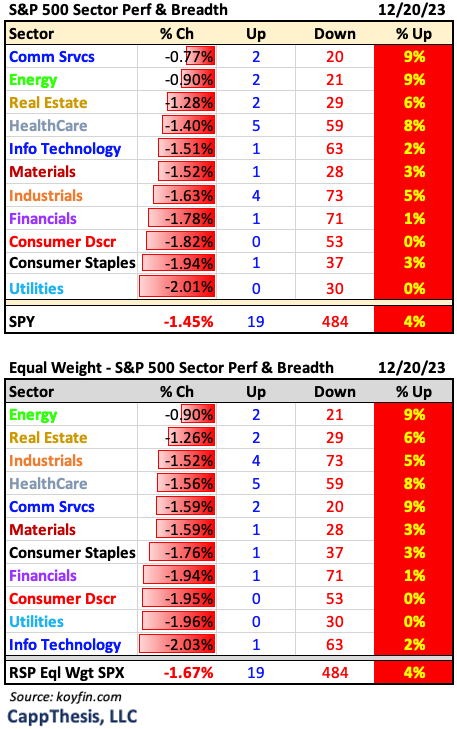
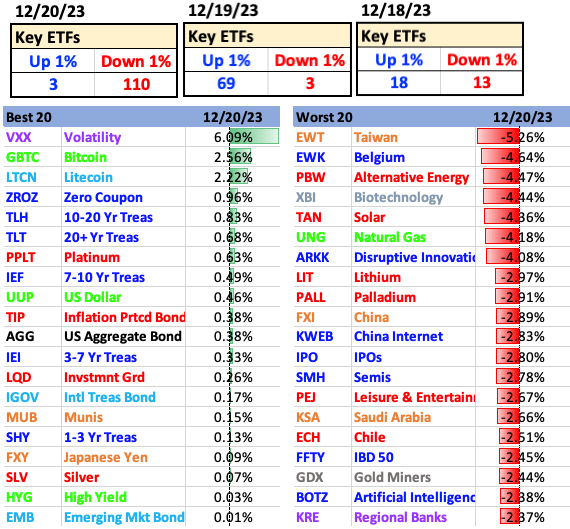
It couldn’t get much worse yesterday… Although, while it wasn’t surprising to see the dollar up, bonds finished with gains, too.
Best and Worst 20 ETFs
It couldn’t have gotten much worse yesterday… Although, while it wasn’t surprising to see the dollar up, bonds finished with gains, too.
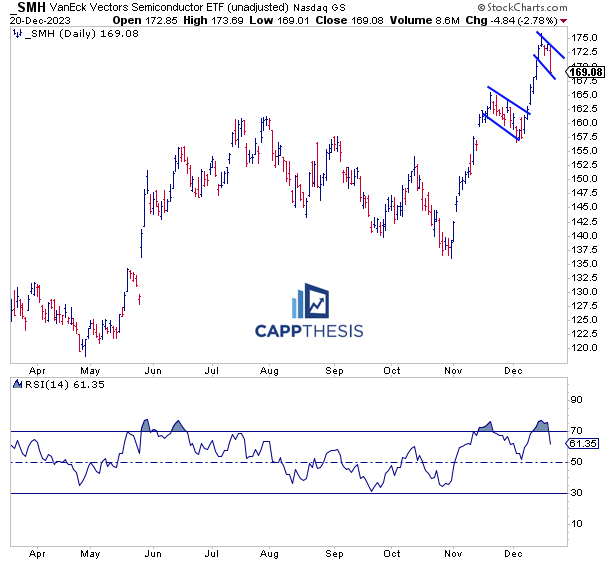
SMH Semis
SMH got hit harder than most during the middle of November before ripping higher in December. It will be trying to digest that strong move like it did a month ago now.
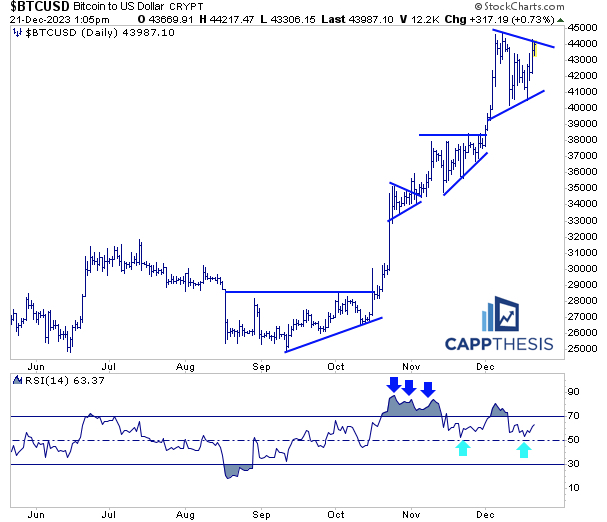
Bitcoin
Bitcoin was the first risky asset class to show signs of strength in mid-October. It fell yesterday afternoon with everything else, but it has been stabilizing since then. It now has a chance to break out from another pennant-like chart formation, which it has been doing for two months.
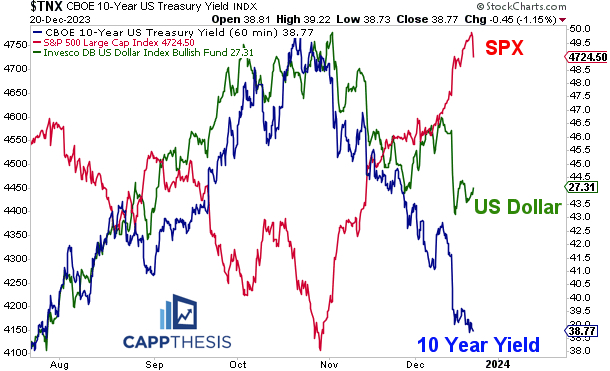
US Dollar, 10-Year Yield, SPX
Needless to say, the SPX is beholden to what the 10-Year Yield and US Dollar do from here. The dollar has been trying to bounce, but rates haven’t yet…
