Thank You
First and foremost, thank you ALL for supporting CappThesis in 2024. It was an epic year for a multitude of reasons. Our 6,100-price target was hit 11 months after being triggered. Even more impressive was that 10 different SPX bullish patterns achieved their upside objectives in 2024. This doesn’t happen every year, but identifying each pattern as it develops always will help align us with the underlying trend – up or down.
From a product side, we introduced Chart Trades, monthly webinars, and most recently, the CappThesis Slack channel in 2024. Each has been very well received. Those features all materialized based on your feedback on how to enhance the member experience.
With CappThesis over two years old now, it’s become very clear that running a business is very similar to actively trading. Rule #1: pay close attention to what the market is telling you and Rule #2: don’t forget rule #1.
Going forward, I can promise you that we’ll continue to add products where we need to, as well as change or eliminate areas that need to be replaced.
We don’t know what 2025 will bring, but we’ll be employing the same tools that have helped us navigate every year since I started writing daily market commentary many moons ago. Over two decades of trading and analyzing both bull and bear markets has left some scars but also valuable lessons, which we’ll continue to lean on this coming year.
Now, let’s get to the grand finale of 2024, starting with a Chart Trades section.
Chart Trades
The latest bout of volatility negated some budding breakout opportunities that had taken shape over the last few weeks… and it also created some new patterns worth paying attention to into 2025 and beyond.
Today we’re looking at one stock that has maintained its bullish structure (TSM) and one that has seen its positive momentum completely collapse but now is back to a confluence of support (EA).
Buys
Bullish Pattern Breakouts
TSM
Buy the dip in an uptrend
Severely oversold & near support
EA
Shorts
Bearish Pattern Breakdowns
Short the rip in a downtrend
Overextended to the upside
Earnings
TSM
I typically find tradable patterns via two ways – manually going through hundreds of charts and/or using screens to help reveal the better positioned setups. While doing one or both of these typically exposes at least a few compelling candidates, other times they pop up randomly throughout the trading day.
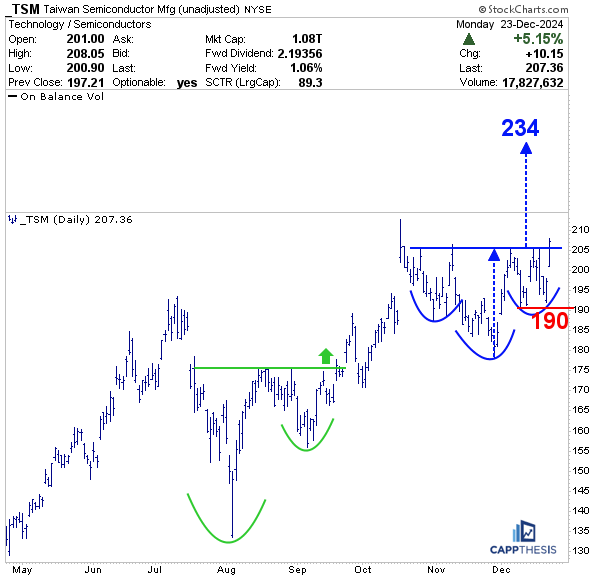
I noticed TSM last week an hour before the FOMC decision was announced. It was nearing a potential breakout attempt, and I was close to recommending it in the next Chart Trades piece. Of course, it cratered on 12/18 like many others, so I put it aside… until now.
TSM hasn’t gotten the kind of attention that NVDA and AVGO have lately, but it’s the second-biggest holding within the SMH ETF at nearly 14%.
The stock now has bounced back strongly the last two days. And while it’s already up over 6% from Friday through yesterday, the stock is just now trying to punch through the three-month bullish inverse H&S pattern and extend to new all-time highs. Continuing to hold above the breakout area would target the 234-zone.
TSM next reports earnings on 1/16/25.
SMH Semis
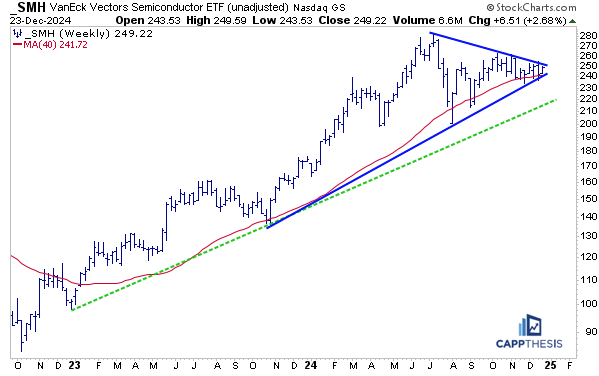
With SMH, itself, net flat since May, seeing TSM eventually break out clearly would help the ETF and potentially encourage traders to deploy capital back to the semiconductors space.
As we know, SMH has been flirting with breaking both above the long downtrend line and below the key uptrend line of what’s become a sizable triangle pattern. It’s just looking for a legitimate reason to push higher…
EA
EA clearly had trouble before, during and now, after, the FOMC announcement and lost ground for the eleventh straight day yesterday. Thus, it’s now fully retraced the impressive breakout from late September, which had produced an eight-day winning streak. With EA net-flat over the last three months, now comes the real test…
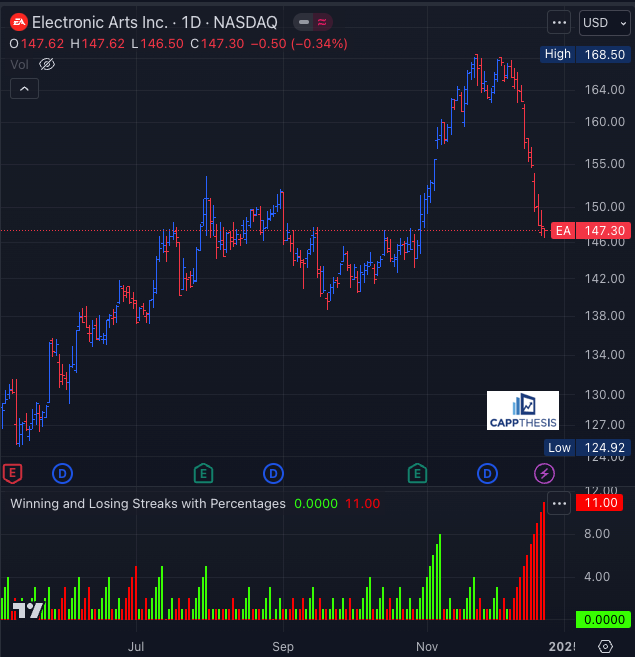
Thus far, there is no indication that EA wants to reverse higher, but it has dropped back to a confluence of support, which has increased its short-term risk-return ratio. Pictured on the chart are:
1-Its former breakout zone near in blue (147)
2-The uptrend line drawn from the May low in green (148)
3- The Fibo retracement levels in grey: 50% (146) and 61.8% (141)
4-The 200-day moving average in red (143).
For now, we’ll look to buy a potential price flip. A 61.8% retracement of the decline would yield an initial target of 160. The suggest stop would be 142 (which is between the last two support points mentioned above).
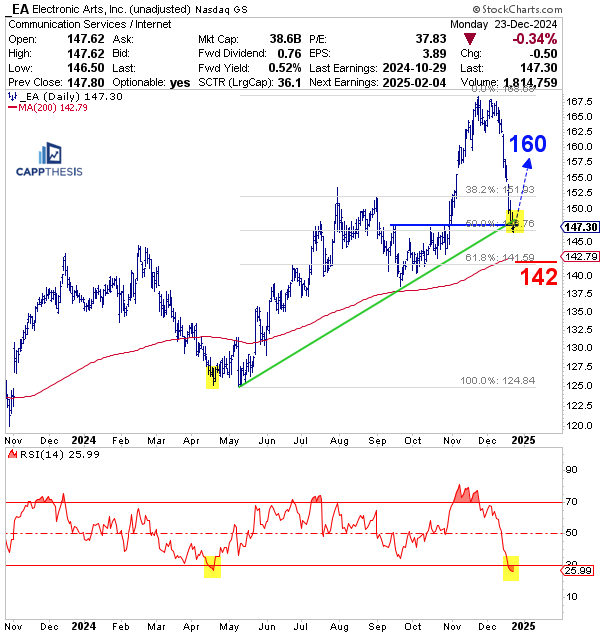
Also of note is that EA now is oversold for the first time since April. Back then, the condition lasted for a few days before a key low was etched.
The difference is that back in the spring, most stocks, ETFs and major indices looked similar to EA given the sell-off from late March. Currently, of course, the corrective price action has been felt by some areas, but not all.
In other words, in isolation, EA appears washed out enough to support a mean-reverting move, but if the bigger growth names suddenly lose their collective footing, other stocks that have already gone through a tough time could suffer further. That’s the risk for EA, too.
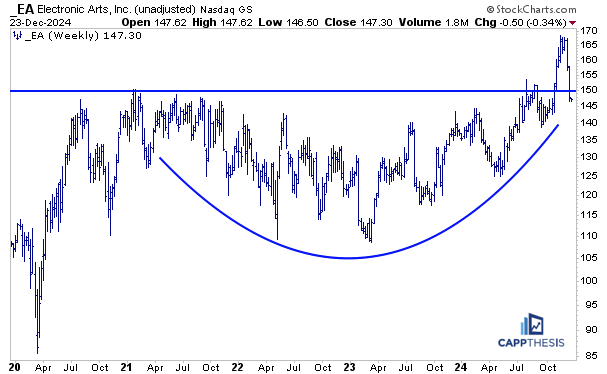
Bigger picture, this weekly chart shows that EA also now is back below a potentially very large bottoming formation, which it had broken above during the last push higher two months ago. A near-term bounce could help retrigger this pattern, as well.
Live Patterns
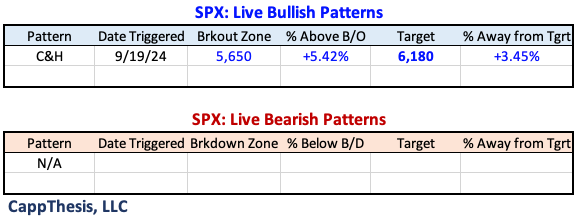
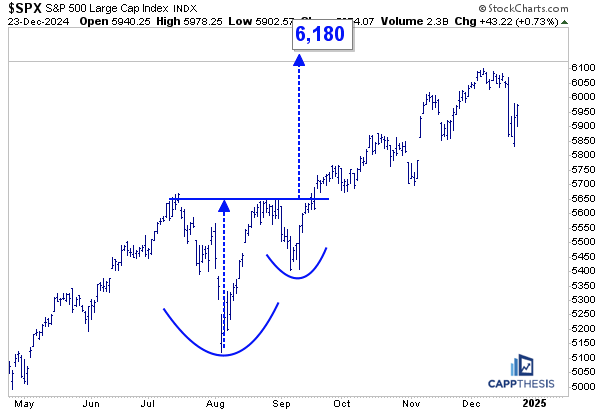
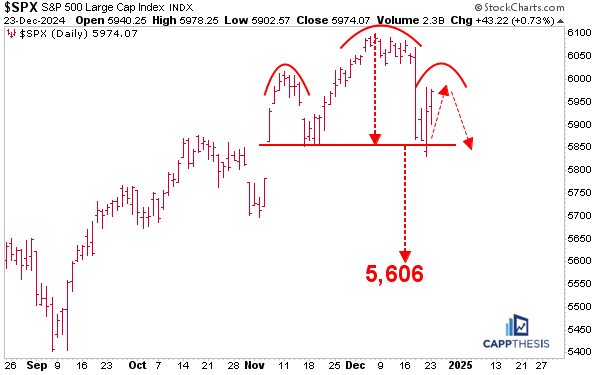
The SPX starts Christmas Eve with the same live bullish pattern – target 6,180.
Potential Patterns
The potential short-term bearish pattern remains a possibility, too. Again, seeing this bounce fade could further progress the head & shoulders formation.
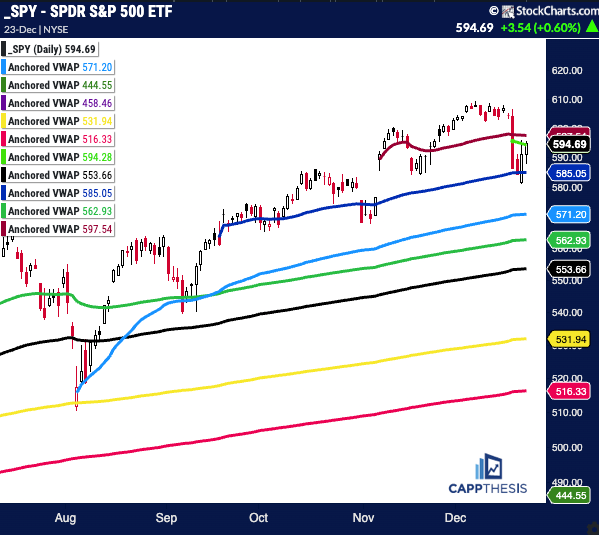
SPY Anchored VWAP
SPY closed just barely above the VWAP anchored to last Wednesday’s FOMC meeting (green), with just the election day spike VWAP from 11/6 (red) now overhead.
Red: 11/6/24 – Election spike
SPY
Light Green: 12/18/24 – Hawkish rate cut
Blue: 9/18/24 – Fed cuts rates 50 bps
Light Blue: 8/5/24 – Pivot low
Red: 10/31/24 – Gap lower
Green: 5/31/24 – Pivot low
Yellow: 1/2/24 – YTD VWAP
Pink: 10/27/23 – October’23 low
Purple: 1/4/22 – 2022 high
Green: 10/13/22 – 2022 low
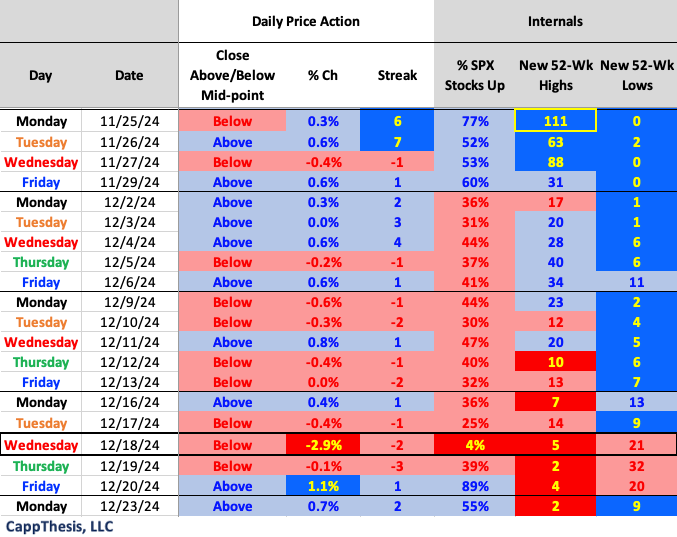
Daily Price Action
The SPX has logged two straight days of gains, positive breadth and closes above its intra-day mid-point. This combination last happened in consecutive days from 11/20 – 11/22 (three in a row).
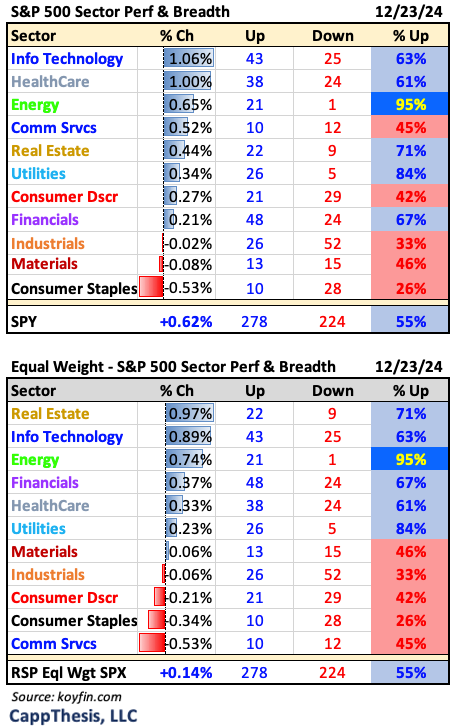
Sector ETFs
Technology led yesterday for the fourth trading day this month. Of December’s 16 trading sessions, Tech, Comm Services and Consumer Discretionary have each led four times, which amounts to 12/16 days or 75% of the time.
Breadth
The SPX and NDX had marginally positive breadth yesterday, while the R2k lagged.

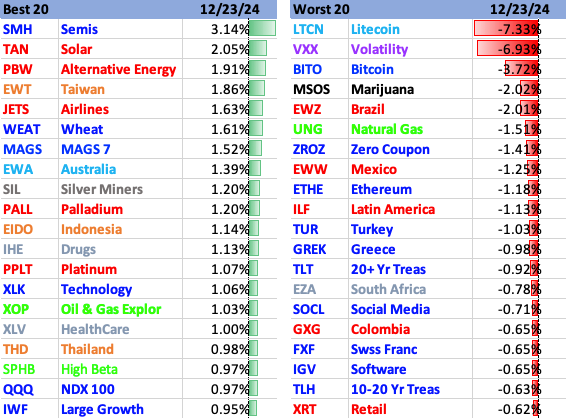
Best and Worst 20 ETFs
The largest of the large cap growth ETFs all appeared on the top 20 list (SMH, MAGS, XLK, QQQ and IWF). IGV Software quietly lagged.
