Topics Reviewed:
1- SPX Performance
2- Patterns
3- Breadth
4- Sector ETFs: XLE Energy
5- NASDAQ
6- NIB Cocoa
7- GREK Greece
8- OIH Oil Services
9- XLV Healthcare
10- Bitcoin
1-Performance
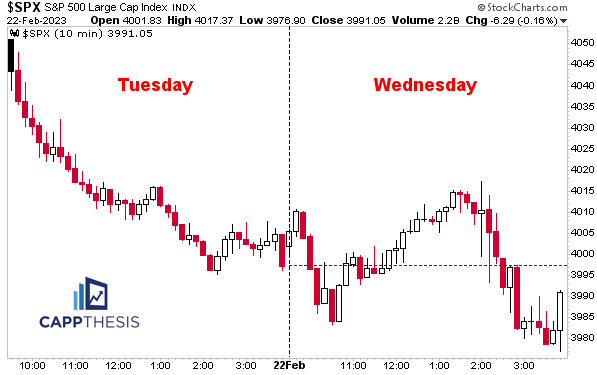
It was a back-and-forth day today, thanks to the Fed Minutes, which ultimately led to the SPX’s fourth consecutive decline, albeit a tiny one.
The last four day sell-off occurred from December 14-19. And while that December 4-day slide was worse at -5%, it wasn’t THAT worse. The current four-day decline is -3.8%, thanks mostly to yesterday’s 2% down session.
Regardless, the SPX must do a better job after big days if it wants to right the ship again.
2-Patterns
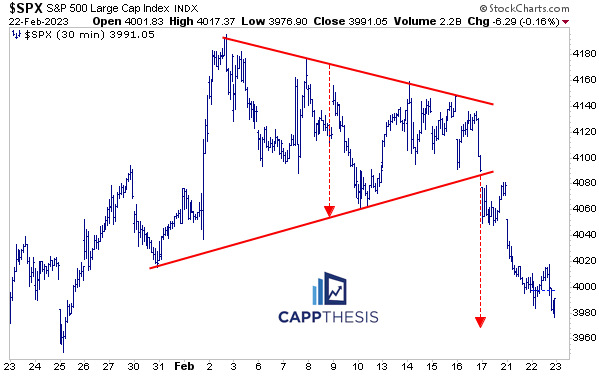
The only live pattern got to within 11 SPX handles of achieving its downside target (3,965).
3-Breadth & Style
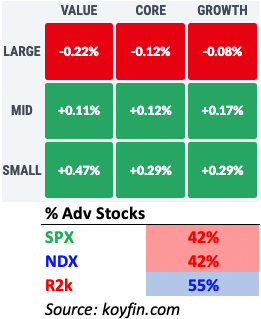
Small Caps outperformed, which was especially evident from a breadth perspective, helped mostly by Consumer Discretionary and Healthcare.
4-Sectors
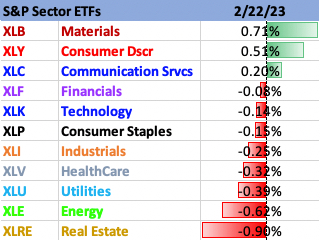
8/11 Sector ETFs declined today, but none moved more than +/-1%…
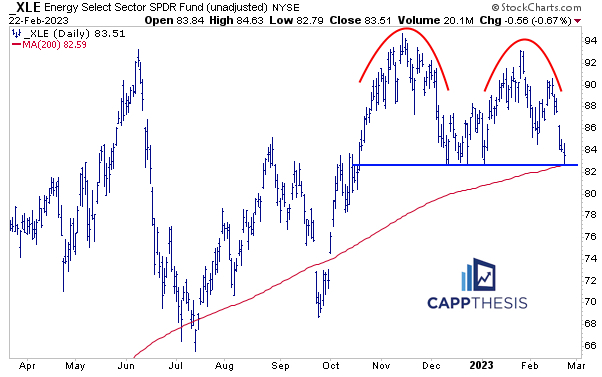
XLE Energy finished off its lows, but its potential double top formation remains in play. The 200-Day MA lines up with the would-be breakdown zone near 83.
While the 200-Day line hasn’t acted as “clean” support over the last year, XLE hasn’t spent much time below the long-term moving average either…something to keep in mind if we do see a downside break soon.
5- NASDAQ Composite
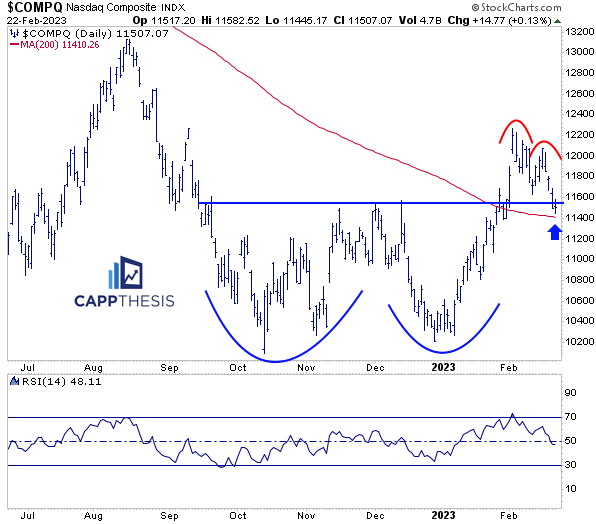
The NASDAQ was up marginally today, as it tries to avoid completing a four-week topping pattern. Like many others, this potential top has formed above a much bigger base, making the next move a significant one.
6- NIB Cocoa
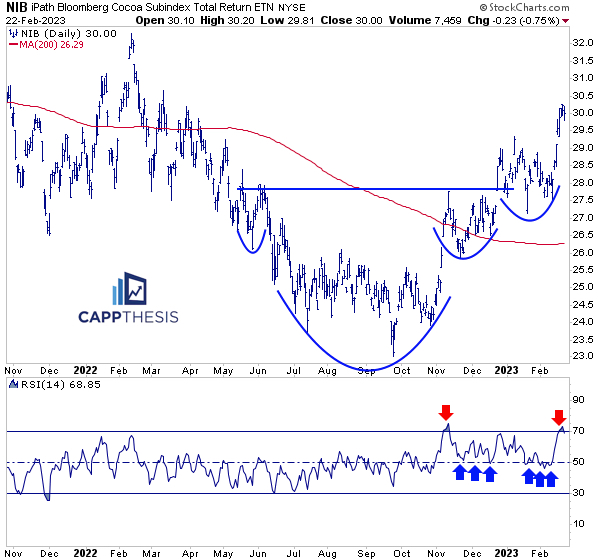
NIB Cocoa decline 75 bps today after logging seven straight gains. Its large bullish pattern breakout remains intact, but with it coming off a very stretched state, the short-term risk-reward profile isn’t compelling.
7- GREK Greece
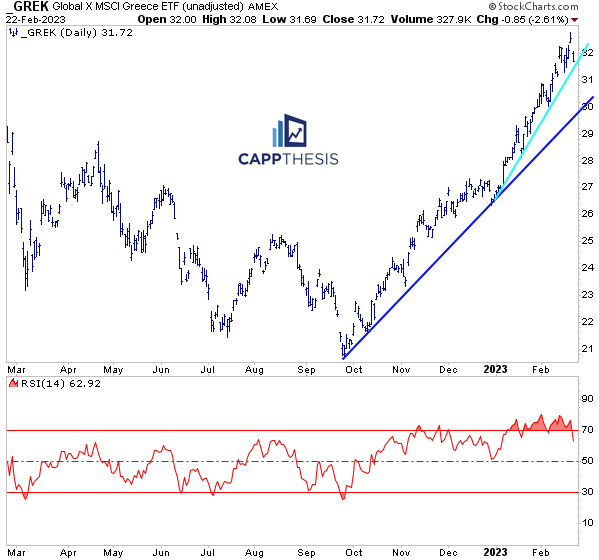
GREK finally got hit hard, as its 14-Day RSI now is below 70. That hasn’t happened much in 2023: it’s been overbought for all but three days this year so far.
Needless to say, it remains extended. Breaking the short-term uptrend line would target the longer-term line.
8- OIH Oil Services
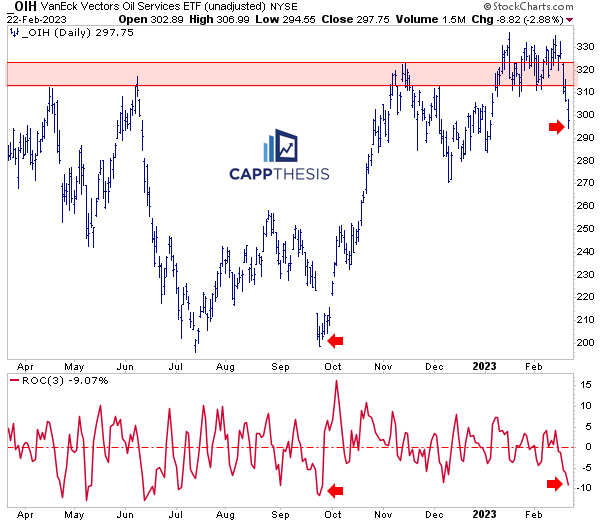
OIH’s three-day loss now equals -9%, which is the worst 3-day decline since late September. That sell-off marked a key low, but the ETF clearly was much lower back then vs. now.
The issue is that OIH logged various multi-day large losses from June through September BEFORE said key low was etched, which OIH clearly would like to avoid replicating now…
9- XLV Healthcare
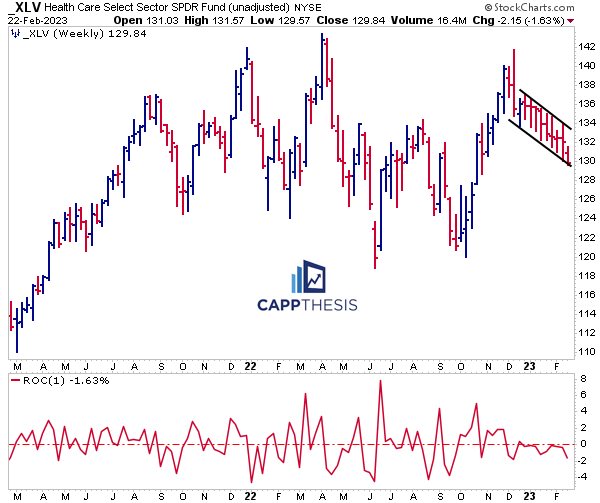
XLV currently is down eight straight weeks, which is very rare. Even stranger is that none of the weekly losses have been more than -2%. It’s just been a steady decline, as each down week has fit neatly inside the pictured downward sloping channel.
XLV closed slightly below its 200-Day MA today (not pictured) for the second straight day, which last happened in late October.
10- Bitcoin
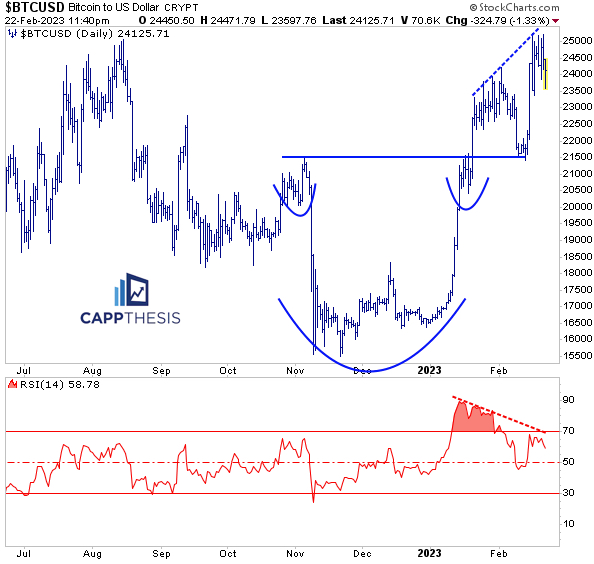
Bitcoin continues to oscillate near 25k, keeping hope alive that its large potential bottom can be completed on the weekly chart.
On this daily chart, though, a potential negative momentum divergence (in its 14-day RSI) has developed, which we should monitor if the 25k zone continues to be rejected.
