Key Points:
1- While the SPX’s bullish formations have taken time to develop lately, it’s just as significant to know that bearish patterns haven’t played out for the index in over three months now.
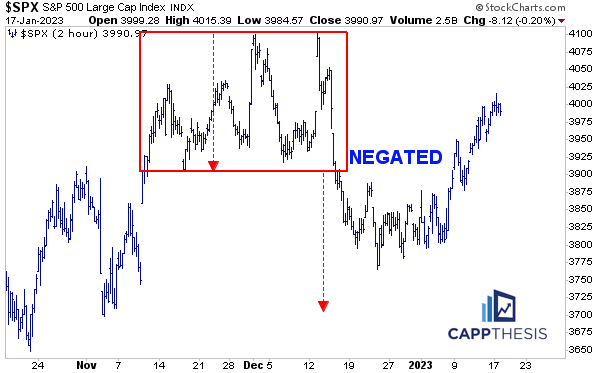
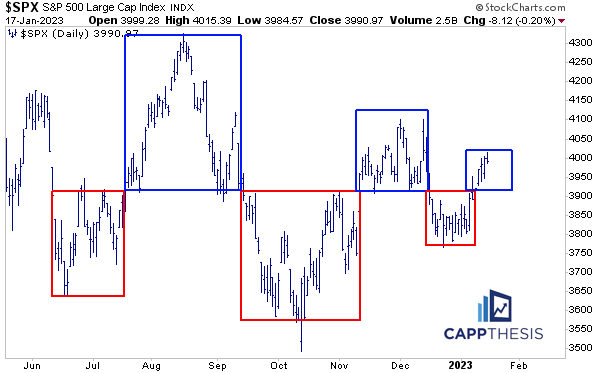
2- Since last June, once 3,900 has been broken (to either side), the SPX has made a habit of staying on the “new” side for weeks at a time. We’re five days into reclaiming the 3,900 level again this time…
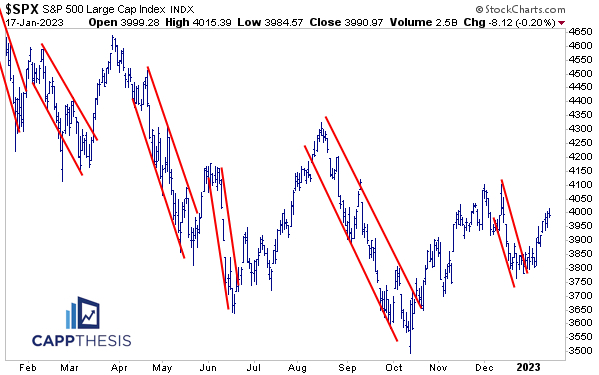
3- The SPX’s mid-December – early January sell-off resulted in the sixth downward sloping channel since the start of 2022. The index didn’t breakout from the prior channels until AFTER a new low was hit. The most recent upside channel break occurred 250 handles ABOVE the last low in October.
Topics Covered:
1- SPX: Bullish patterns
2- SPX: Failed bearish patterns
3- Trading boxes
4- Downward sloping channels
5- Silver
6- Copper
7- Crude Oil
8- USD/JPY
9- Nikkei 225
10- 10 Year Note
SPX
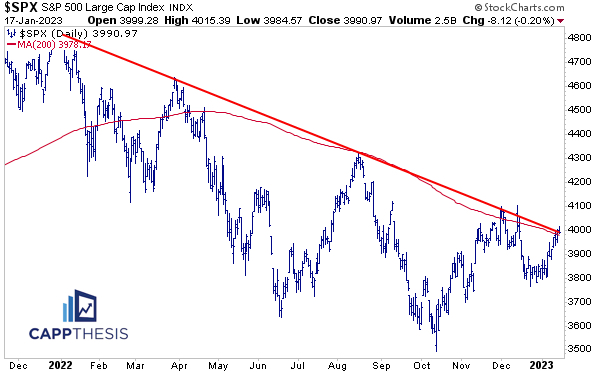
The SPX is coming off its second smallest move of 2023 after flirting with the 4,000 level for the second straight session. The 200-Day MA and the 13-month downtrend line are right here, too, of course – giving even the casual chart watchers plenty to talk about.
More importantly, the SPX remains above its recent breakout point.
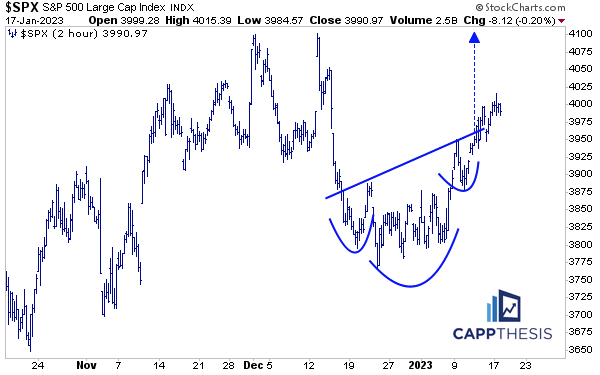
Though a quick downturn could negate the latest bullish pattern, it’s just as significant to know that bearish patterns haven’t played out for the SPX in over three months now.
We profiled each potential bearish set up along the way, including these last two. While this will change at some point again, we need to recognize the current environment as it presents itself. And right now, consolidation phases have been resolved higher more often than not.
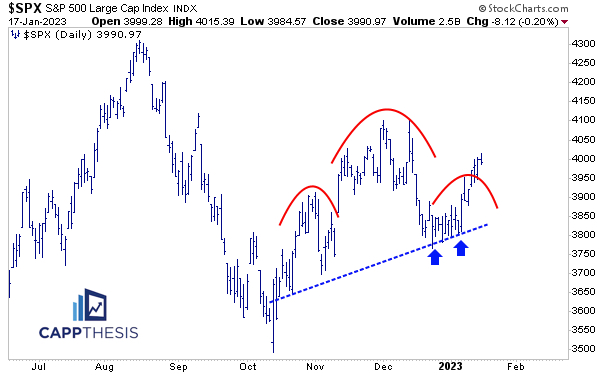
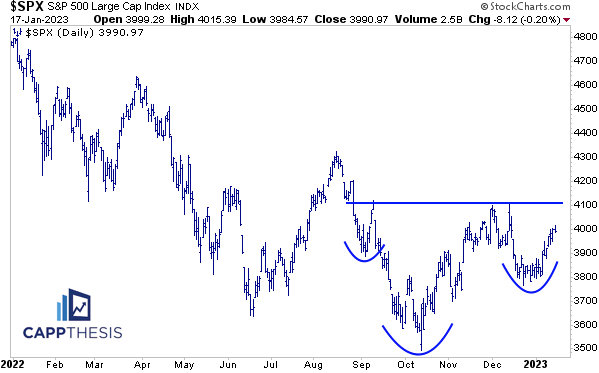
Indeed, we need continued accumulation-like price action for a REAL breakout to occur in the SPX, but as we’ve alluded to before, we can’t get the biggest bullish formations to work until the smaller ones prove successful.
Trading Boxes
Aside from the classical chart pattern work, here’s how a few other SPX charts we frequently reference currently look.
First, with the price action since last June having taken place either above or below 3,900, these trading boxes continue to capture the SPX’s path quite well.
Once 3,900 has been broken (to either side), the index has made a habit of staying on the “new” side for weeks at a time. We’re five days into reclaiming the 3,900 level again this time…
Downward Sloping Channels
The SPX’s mid-December – early January sell-off resulted in the sixth downward sloping channel since the start of 2022. The index didn’t breakout from the prior channels until AFTER a new low was hit.
The most recent upside channel break occurred 250 handles ABOVE the last low in October.
Undoubtedly, it won’t be easy from here, with whipsaws sure to happen again, but just recognizing the differences now vs. what repeatedly happened in 2022 is important.
Pre-market
Silver
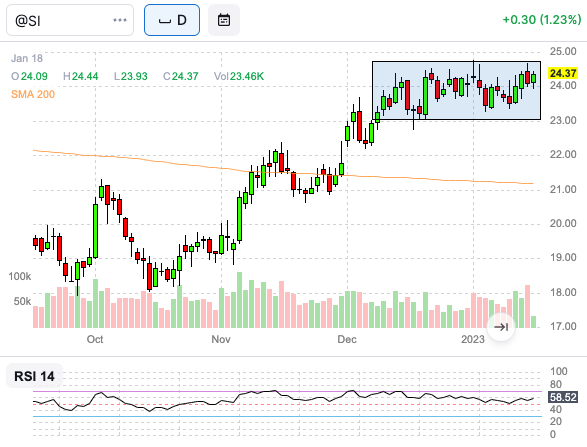
Up this morning, as it will be trying to break out of its recent high level consolidation pattern.
Copper
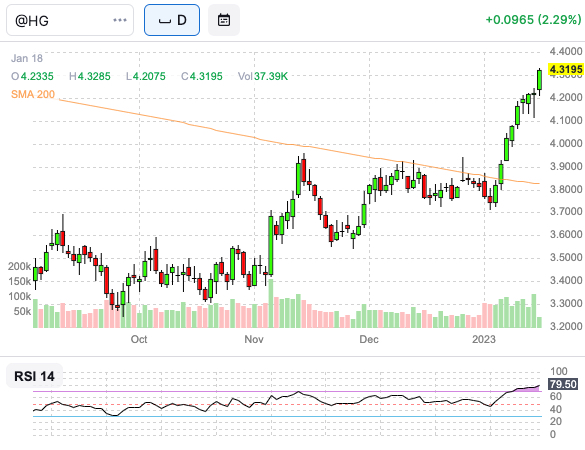
As noted in last night’s Last Licks, the 8-day move the JJC ETF makes it very short-term extended. We’ve seen that before and it reversed quickly… only to recover.
Copper, itself, is up again and now has an RSI near 80. That’s unsustainable, but a clear sign of positive momentum. Best-case, the next pause turns into a continuation pattern.
Crude Oil
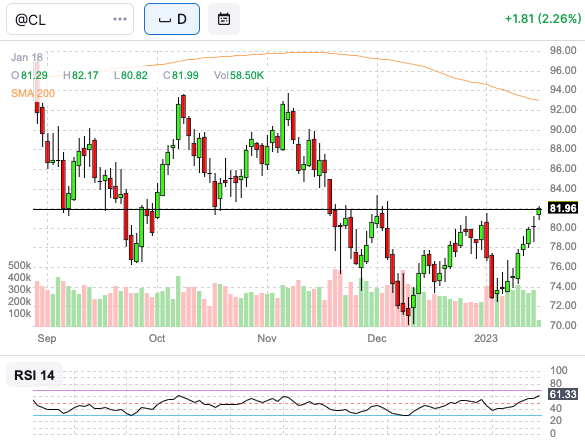
Back to the 81-82 zone, which has been key resistance recently… and key support during the fall. Getting through, and holding above, this zone will be important. But with Crude now up 8/9 days (potentially), a short-term breather would help its cause.
USD/JPY
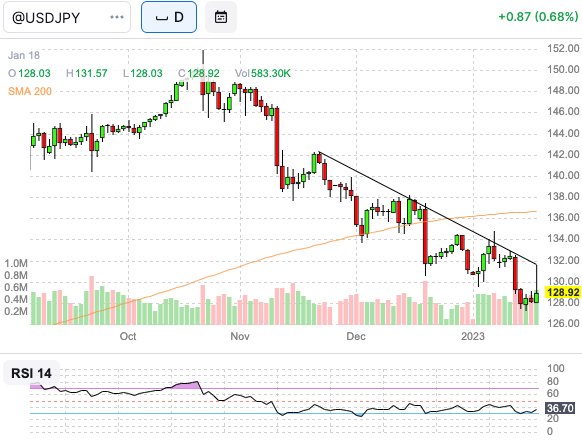
The BOJ-induced spike was short-lived, as the currency it didn’t even make a new reaction high on its daily chart.
Nikkei 225
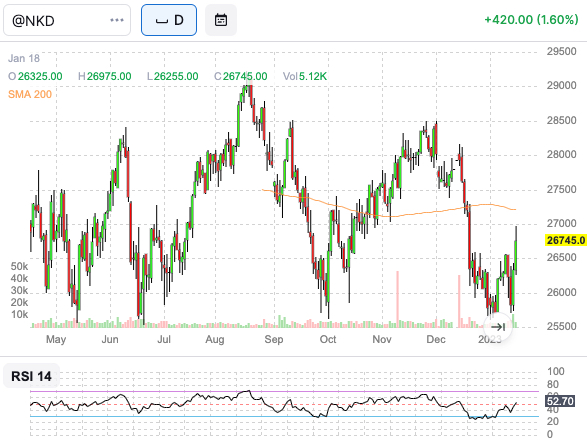
The big up-day extended yesterday’s bounce from significant support. The index has held near 25,500 various times since last May. The last three major rallies got to at least 28,500.
10-Year Note
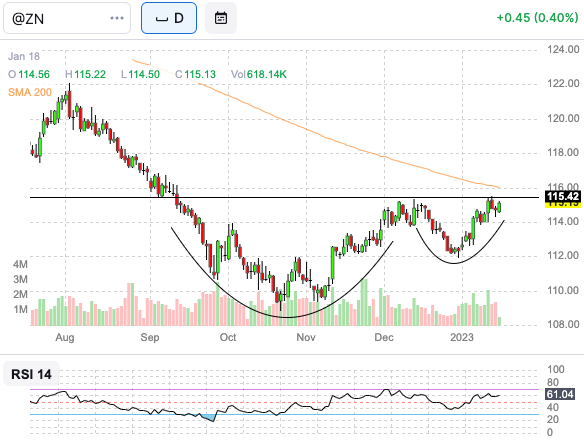
The potential inverse H&S pattern remains in play.
