Key Points:
1- The SPX logged its fifth 1% loss in October yesterday, which ties February and March for the most in 2023. The difference between this month so far is that we’ve only had two 1% gains vs. six and four in February and March, respectively.
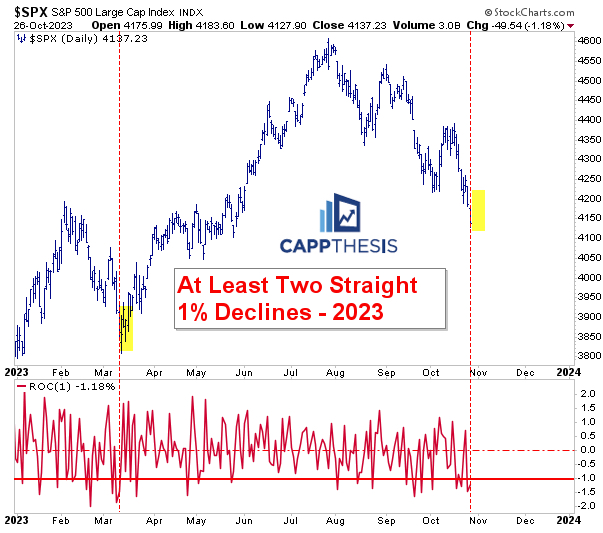
2- The SPX also just endured its second straight 1% decline for the first time since 3/9 – 3/10/23. The last longer streak of 1% down-moves occurred in 2022 from June 8-13 (four).
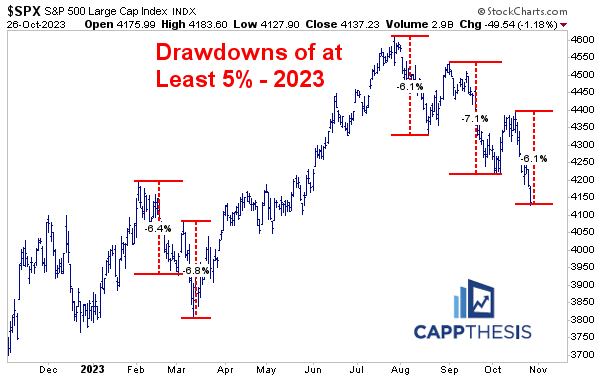
3- The SPX’s drawdown from the October high extended to -6.1% on Thursday, which is in line with the largest pullbacks in 2023. See more below.
Topics Covered:
Market
-Consecutive 1% losses
-Drawdowns
-Patterns
-Support
-AVWAP
Stats
-Index Breadth
-Sector Perf & Breadth
-Best & Worst ETFs
Key Charts
-NDX
-XLC
-XLK
-XLRE
-OIH
SPX:
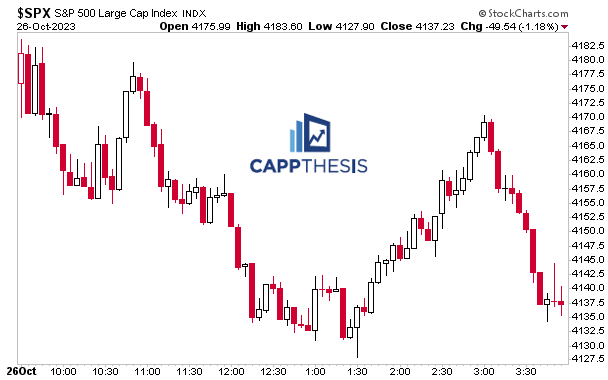
The SPX succumbed to another bad earnings reaction to large cap growth yesterday and fell 1.2%. From 1:30 to 3:00, it looked like an impressive positive reversal was in the cards. But just as momentum was building, sellers stepped back in, forcing yet another sour close.
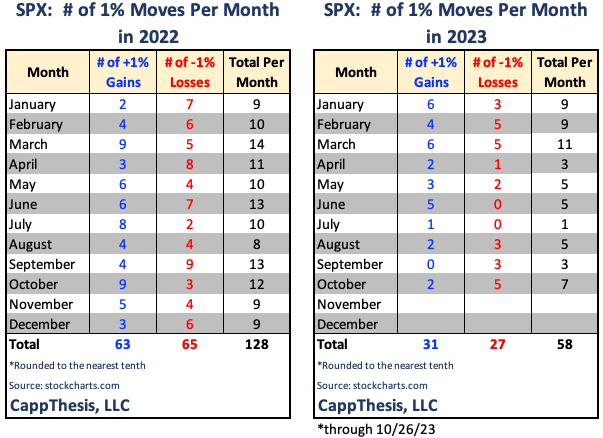
That amounted to the fifth 1% loss in October, which ties February and March for the most in 2023. The difference between this month so far is that we’ve only had two 1% gains vs. six and four in February and March, respectively.
It’s rare to see 1% moves occur mostly in one direction, as the 2022 table shows. This being the case, it’s probable that a face-ripping rally will happen again soon. It’s just a matter of when…
However, the bigger question is how will the market follow up a big up day? We’ll dive into that more below…
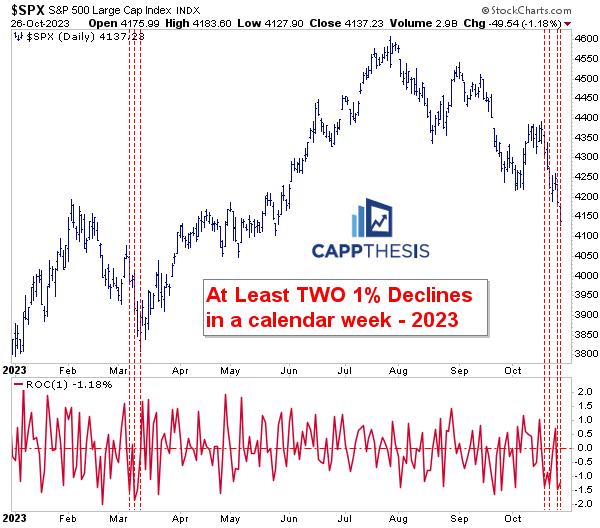
Two Declines in a Week
Yesterday also marked the second 1% decline of the week. We had two 1% losses last week, as well. Again, this had not happened since March in 2023. In March, THE low was etched soon thereafter. Not this time, at least not yet…
Consecutive 1% Declines
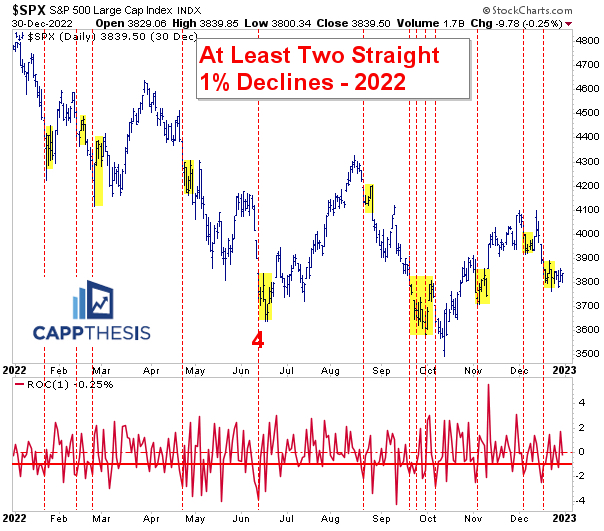
It also now is the first set of consecutive 1% declines since March 9-10… which, again, occurred a few days before the low. The last longer streak of 1% down-moves occurred in 2022 from June 8-13 when the SPX had FOUR in a row. For some context, the index had THIRTEEN 1% losing streaks in 2022 vs. TWO so far in 2023…
Looking more closely at 2022, here are all 13 instances. Incidentally, that four-day sell-off in June of last year was the only streak that extended beyond two.
Further, highlighted in yellow are the ensuing days after each 1% streak. As is clear, short-term relief followed each time. Again, as the table above distinctly displays, there were nearly just as many 1% advances as declines last year, and many of them appeared right after 1% declines.
That’s another reason why a big up day most likely is around the corner soon…
Drawdowns
At the lows yesterday, the SPX’s drawdown from the October high extended to -6.1%, which is in line with the largest pullbacks in 2023. As we know, only once did an ensuing bounce lead to a major uptrend (March).
The prior two rallies the last two months were between +4% and +5% and were aggressively faded. In other words, let’s take this one step at a time if/when the next rally attempt materializes.
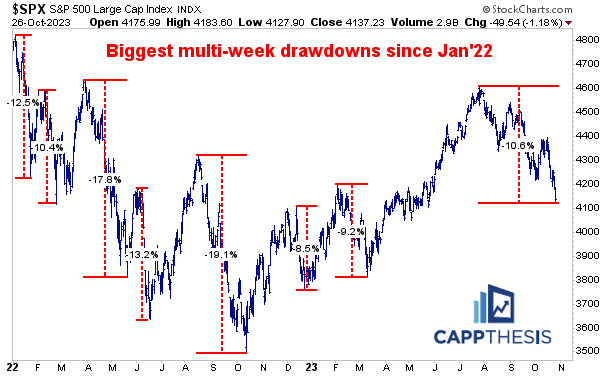
Here’s a different perspective that captures the major drawdowns since the start of 2022. The current pullback passed the popular -10% “correction” threshold yesterday, which now is the biggest drop since the August-October decline.
However, this downturn differs in one major way – it has lasted a lot longer than any we’ve seen in the last two years. Yes, we’ve gotten those two quick bounces, but they were short-lived and relatively small. We’ll need a better effort going forward.
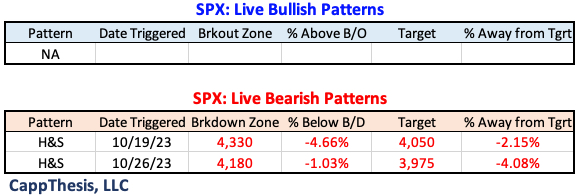
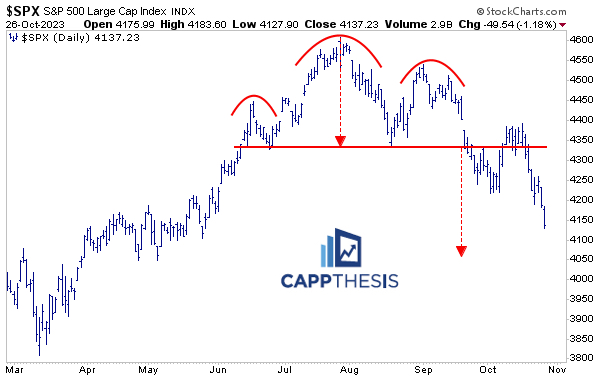
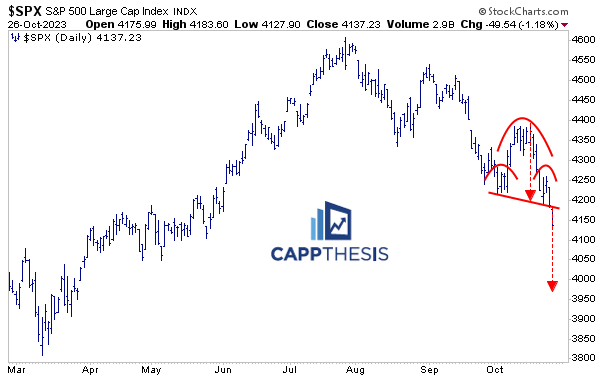
Patterns
Yesterday’s decline triggered the second bearish pattern we cited. Like all patterns, this one will remain alive as long as the breakdown zone isn’t violated. Both live bearish patterns are below.
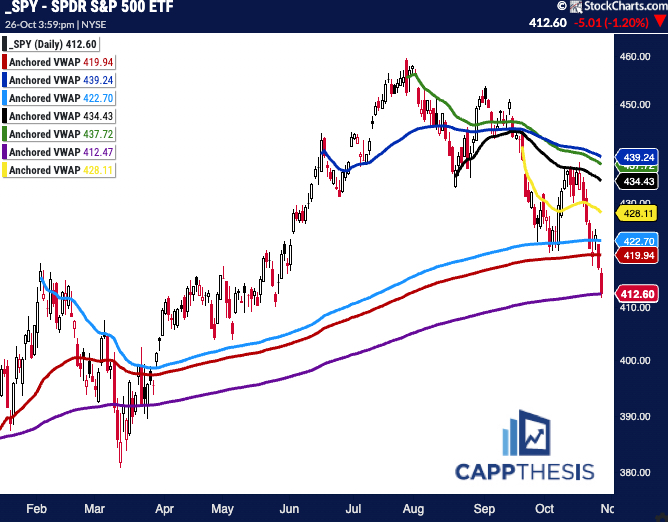
SPY AVWAP
SPY closed right on the purple AVWAP line anchored to the 10/13/22 pivot low, a key support area to hold now.
Red: 1/2/23 – YTD VWAP
Light Blue: 2/3 – Former high point
Purple: 10/13/22 – 2022 low
Yellow: 9/20 – FOMC Meeting
Black: 8/18 – August low
Green: 7/27 – FOMC negative reversal
Blue: 6/15 – mid-June high
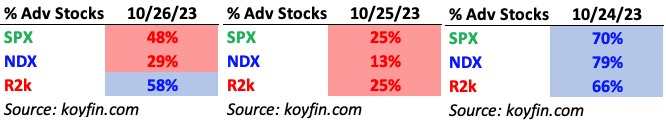
Breadth
Small caps did a lot better on Thursday.
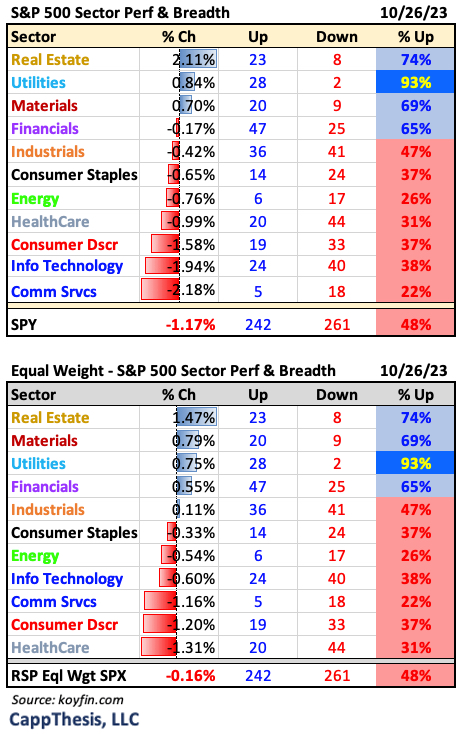
Sector ETFs
8/11 sector ETFs fell yesterday, including the ones containing the most influential growth names. Thus, the RSP outperformed SPY by a wide margin.
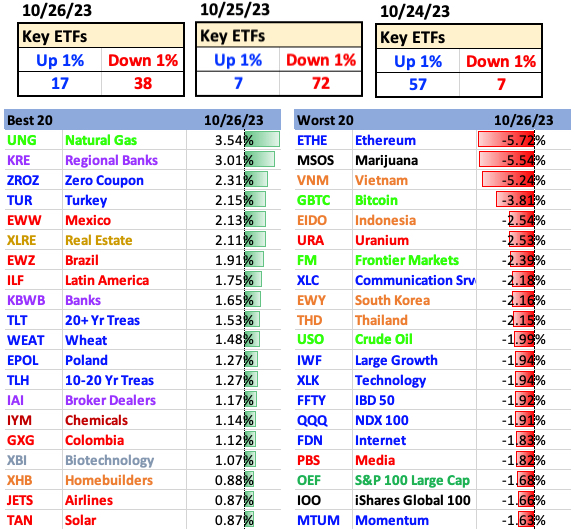
Best and Worst 20 ETFs
Big declines dominated our ETF list, as well.
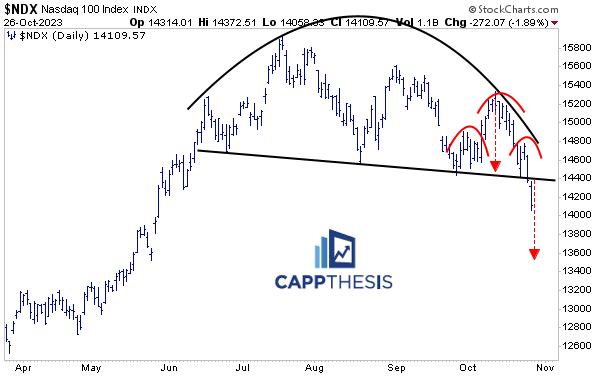
NDX
The NDX broke below the bearish pattern we cited yesterday. With no near-term support now, there’s nothing in its way down to the downside target. Once the next bid returns, it will be important to see how it reacts to the big congestion zone that the index now is below.
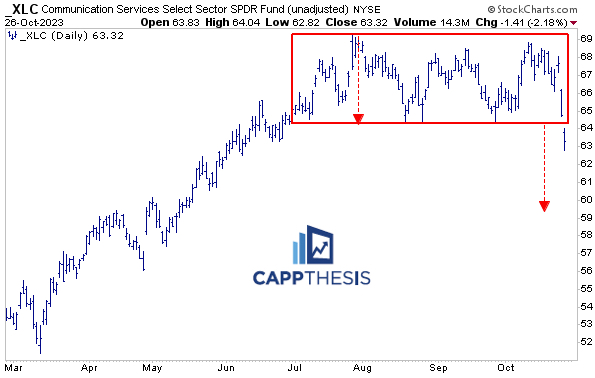
XLC Comm Services
XLC now has logged its biggest 2-day decline since 10/27/22 – exactly one year ago. Like the NDX, any rally effort from here will have to contend with obvious resistance starting at 64.
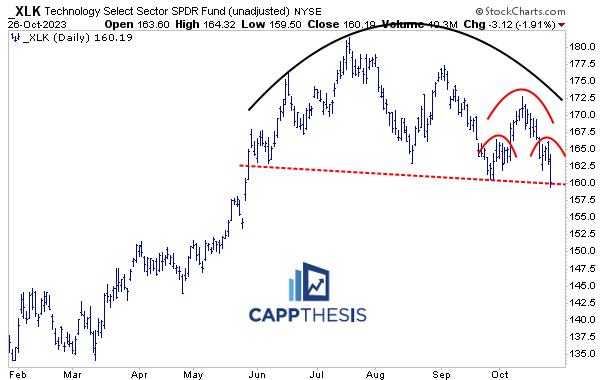
XLK Technology
XLK hit its lowest point since 5/25 yesterday and now is teetering on a downward sloping support line (similar to the NDX yesterday). However, it has NOT broken down yet. To put it bluntly, if we see XLK break down, as well, downside momentum will continue…
XLRE Real Estate
XLRE outperformed yesterday and logged its biggest gain since 4/27. It’s also now trying to leverage a positive divergence in momentum. It has three downtrend lines to contend with next, thus, like so many others, it needs follow through next.

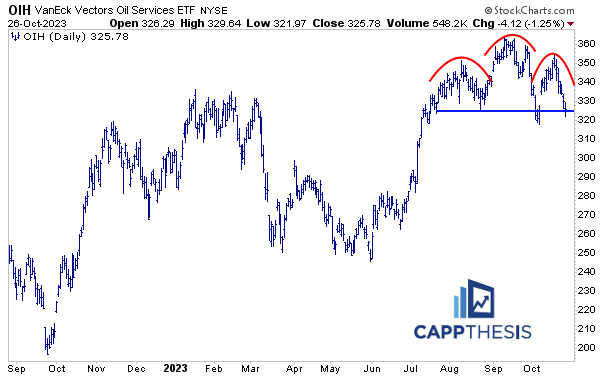
OIH Oil Services
OIH logged its seventh straight decline yesterday, which now is the longest since eight from mid-June’22. The downturn literally has formed the right shoulder of this potential multi-month H&S pattern. With very little near-term support under current levels, seeing demand come back soon is critical.