Depressed Stocks
After four straight days of losses, many stocks have taken a hit. So how do we identify the best candidates for a potential mean-reverting move?
With literally thousands to choose from, we need a structured approach. Using the finviz.com database, we begin with 5,506 common stocks (excluding ETFs).
To refine the list:
Filtering for stocks with at least 500K average daily volume and a price of $10 or higher narrows it to 1,649.
Looking at only oversold stocks (RSI below 30) reduces it further to 151.
To focus on uptrends, we can filter for stocks trading above their 200-DMA, bringing the number down to 35…
Among those 35, only eight are S&P 500 members.
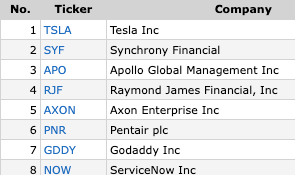
Three of those are in the NDX.
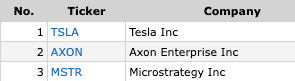
And that means that just two are in both the SPX & NDX: TSLA & AXON.
TSLA
Is there a more polarizing stock led by a more polarizing figure out there? That’s a rhetorical question, but one that we all know the answer to.
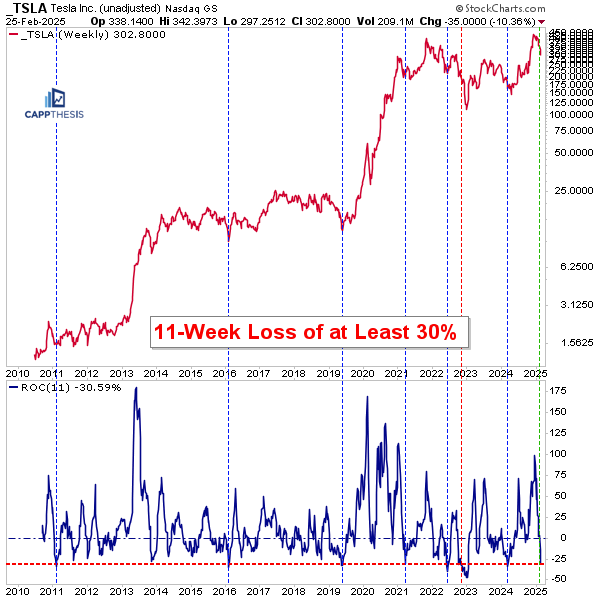
The bigger question is whether the stock is ready to bounce. Let’s take a closer look.First, TSLA’s 11-week rate of change is now at -30%, and the decline looks even worse when factoring in intraday data. This kind of severe drawdown has only occurred seven times before in its history (excluding overlapping instances). Notably, all but one of those instances (fall, 2022) led to strong rebounds and/or major trading lows.
While this decline is particularly concerning given that it has occurred immediately after TSLA ripped to new highs, history suggests it’s not unprecedented. The stock has endured similar sharp pullbacks following highs in 2016, 2019, and 2021, only to regroup and eventually surge higher.
The key question now: Can history repeat itself, or is this time different?
When stocks crater, the selling pressure often becomes relentless, and TSLA has been no exception. The stock has now retraced 50% of its entire 2023-2025 advance in just under three months.
Adding to the significance of this level, TSLA is now sitting near former resistance from the summer of 2023, a potential technical pivot zone. Whether this area acts as a stabilization point or merely a pause in the selling remains to be seen, but given the magnitude and speed of this retracement, it’s clearly an important spot for the stock.
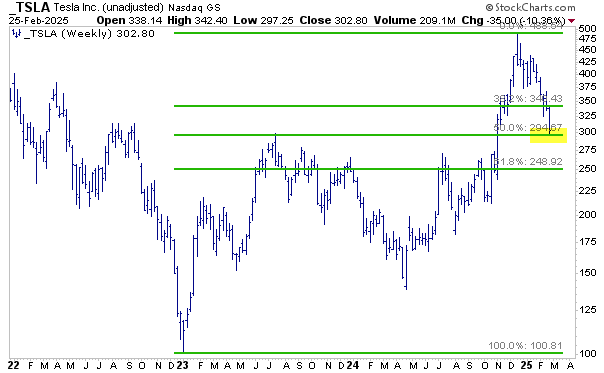
We don’t claim to be Elliott Wave experts, as we understand there are specific rules and structures that must be followed. However, the overall ebb and flow of TSLA’s decline suggests that the final down leg resembles wave 5 of 5 in progress.
That said, we’re still waiting for a price flip to confirm a potential reversal. Given the sharp decline, seeing some demand emerge near the aforementioned 50% retracement level would be encouraging and could reinforce the idea that this final wave is nearing exhaustion.
Whether TSLA finds support and stabilizes at this key technical area remains the next critical test.

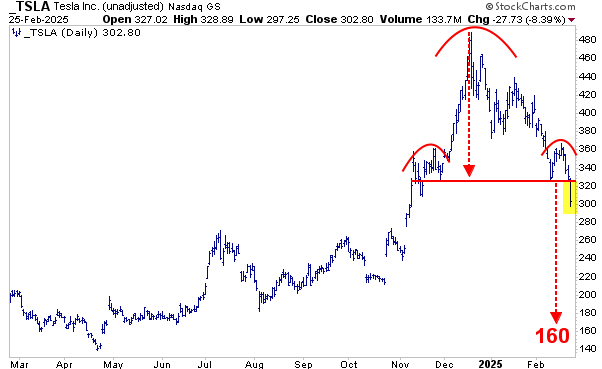
If demand fails to emerge despite TSLA’s deeply depressed state, the large bearish pattern will remain intact. A confirmed breakdown from this structure would have clear negative implications not just for TSLA, but also for the XLY Consumer Discretionary ETF and the broader market. The neckline of this pattern sits near the 325-326 zone, making it a crucial technical level to watch.
However, if TSLA can stage a rally back to that zone, it could invalidate the bearish breakdown, making yesterday’s decline appear like a bear trap and potentially encourage the snap back discussed above.
PNR
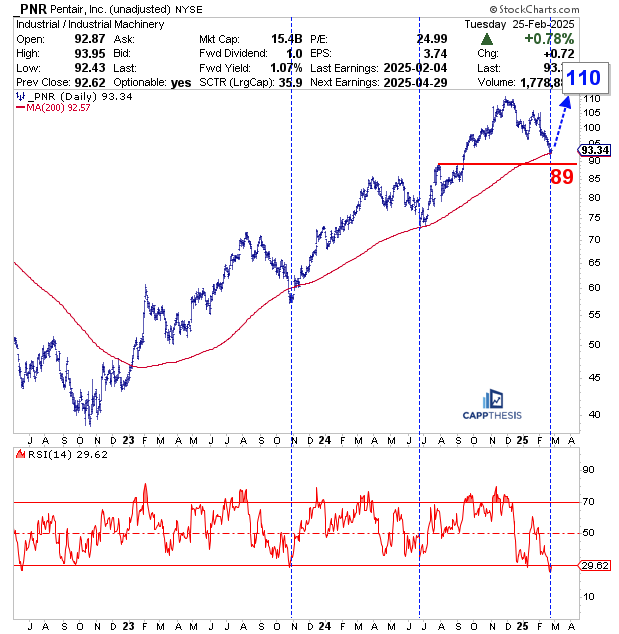
Among the other seven SPX stocks identified by our screen, PNR stands out as it is currently sitting right on its 200-day moving average. Since reclaiming this long-term support in early 2023, the stock has tested the 200-DMA twice—October 2023 and June 2024—both times using it as a launching pad for a reversal higher that ultimately led to new highs.
Also, PNR’s 14-day RSI has just hit its lowest level since summer 2022, highlighting how short-term oversold the stock has become. If this pattern plays out like it has in the past, a bounce could materialize soon, with an upside target near its former highs around 110.
AXON
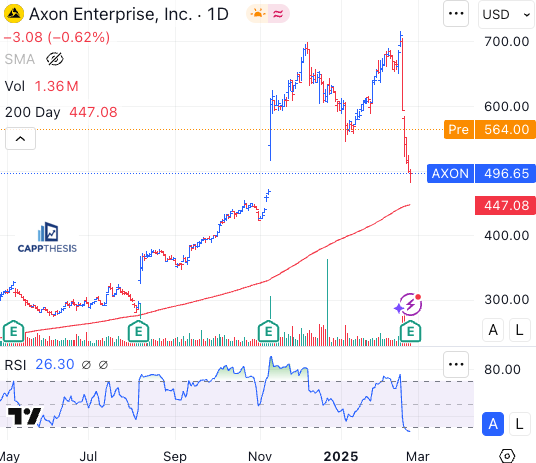
As noted earlier, alongside TSLA, the other two NDX stocks flagged by our screen were MSTR and AXON. AXON is ripping higher post-earnings.
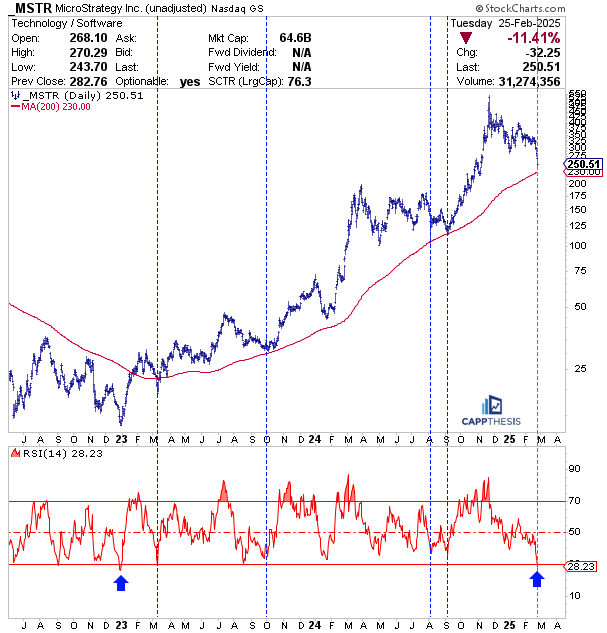
MSTR
Believe it or not, despite MSTR’s substantial volatility, the stock has remained above its 200-DMA nearly every day since reclaiming it in early 2023. On the few occasions when MSTR approached its 200-DMA after sizable pullbacks, it quickly bounced. While it didn’t always mark the exact low, past instances suggest that buying near the 200-DMA has been a better strategy than selling.
Given MSTR’s extreme price swings, pinpointing precise upside targets is challenging, making risk management the top priority. Using a stop-loss somewhere close to the 200-DMA is recommended.
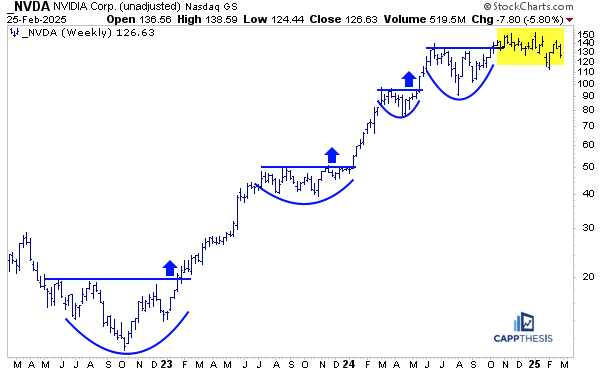
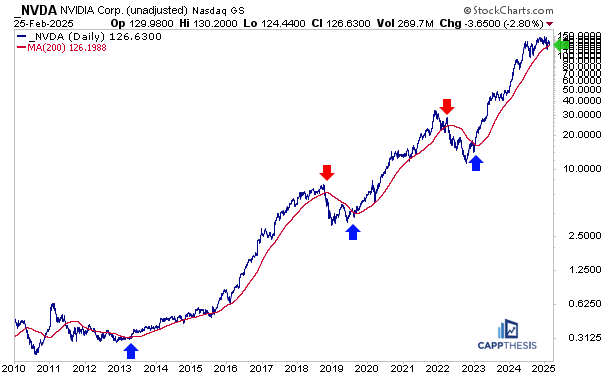
NVDA
While NVDA’s stock split on 6/10/24 didn’t mark the absolute top, a major short-term peak occurred shortly after on 6/20, and the stock’s character has noticeably shifted since then. Despite experiencing big downturns and sharp rebounds, NVDA has ultimately made no net progress over the past eight months.
NVDA did not appear on our simple screen outlined above, as its 14-day RSI has yet to enter oversold territory. In fact, the last time the indicator dipped below 30 was in September 2022. If nothing else, “holding until oversold” would have been a great strategy since then… but we digress…
The stock HAS been flirting with its 200-DMA recently though, which it hasn’t tested since late 2022. Looking at the last 15 years of NVDA’s history, the stock has undergone five distinct phases—three major uptrends and two downtrends.
In each case, breaking decisively above or below the 200-DMA marked the early stages of those trends. While some shorter-term false moves occurred, the biggest reversals always coincided with breaking the line.
That makes NVDA’s next move important. If momentum continues to fade, a sustained break below the 200-DMA could accelerate downside pressure.
Conversely, if the past few months have merely been a pause in a long-term uptrend, then NVDA will need to decisively reclaim the line and create distance from the 200-DMA. There’s precedent for that—NVDA rallied for five years from 2013-2018 before finally slicing through its 200-DMA.
Lastly, this weekly chart shows how NVDA has had difficulty capitalizing on its latest long-term pattern breakout. That’s a change of character vs. the prior breakouts, which saw immediate upside follow through. Again, seeing how this recent consolidation is resolved will be telling.