Key Points:
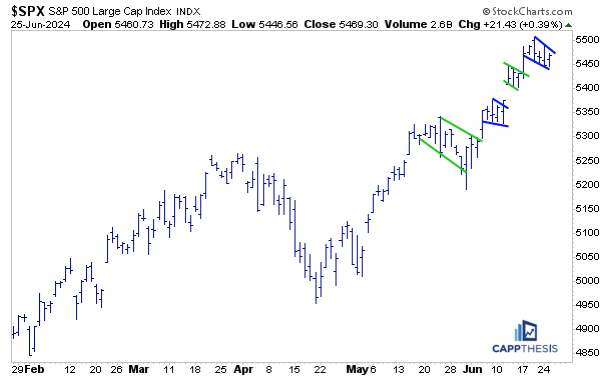
1- We’ve seen the same kind of mini pattern play out throughout June for the SPX: A big one-day move, a pause, and another large move.
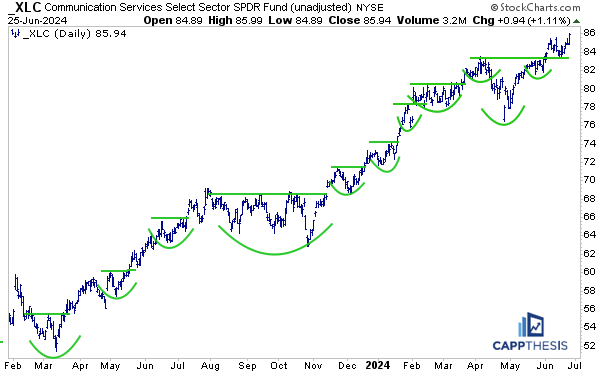
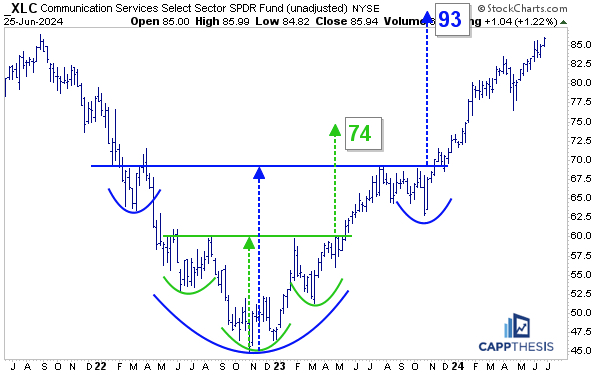
2- XLC Comm Services extended the breakout from early June yesterday, which has a pattern target up near 93.
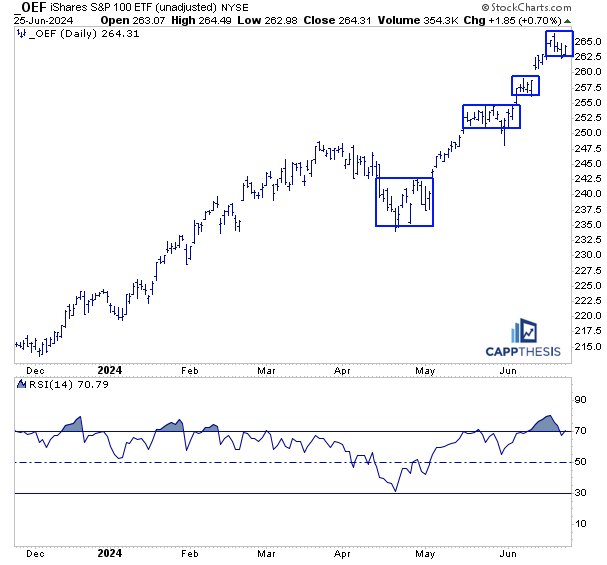
3– OEF SPX 100 is the only ETF we track that has a 14-day RSI above 70. Not surprisingly, it looks a lot like the SPX, as it tries to take advantage of its latest trading box.
Topics Covered:
Market
-Intra-day
-Patterns
-AVWAP
Daily Stats
-Daily price action
-Index breadth
-Sector performance
-Best & worst ETFs
Key Charts
-XLC Comm Srvs (2)
-XLK Tech
-PEJ Leisure & Entertainment
-XHB Homebuilders
-OEF SPX 100
-EWJ Japan
-WEAT Wheat (2)
-TLT
-HYG vs. SPX
SPX
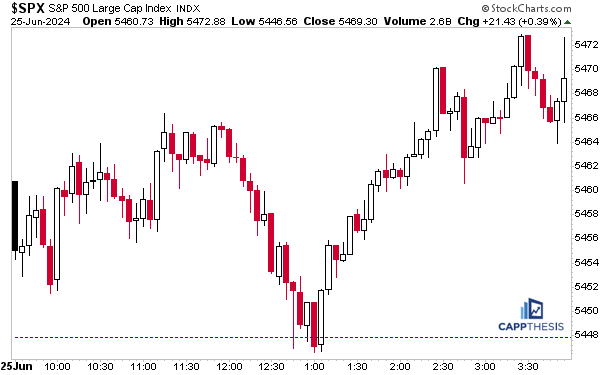
The SPX utilized the growth bounce yesterday to break the modest 3-day losing streak and finished near its intra-day highs.
Live Patterns
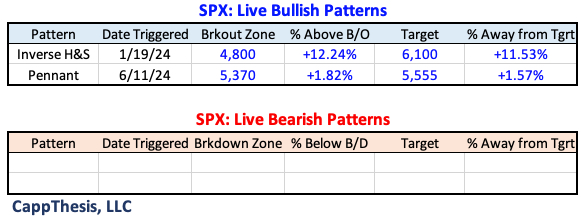
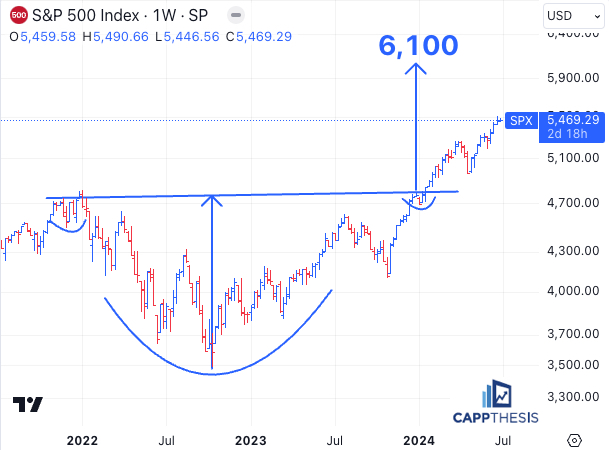
The small move did not affect the SPX’s pattern work, as both breakout targets remain in play.
Potential Patterns
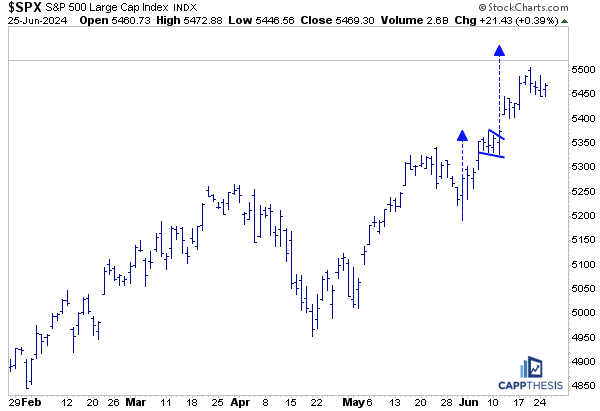
Overall, we’ve seen the same kind of mini pattern play out throughout June: A big one-day move, a pause, and another large move. We can call these falling wedges, flags, pennants, or trading boxes – or anything else. The behavior must be respected until it changes.
SPY AVWAP
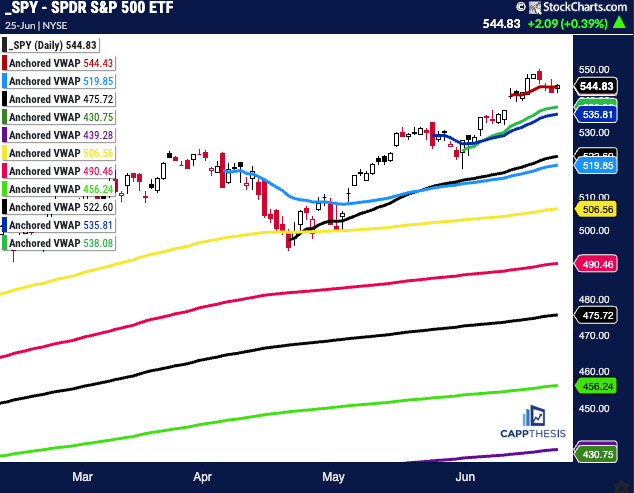
SPY closed right on the VWAP line anchored to 6/12 yesterday, which remains a meaningful line.
SPY
Red: 6/12/24 – CPI/FOMC
Green: 5/31/24 – Pivot low
Blue: 5/23/24 – Pivot high
Light Blue: 4/4/24 –negative reversal
Black: 4/19/24 low
Yellow: 1/2/24 – YTD VWAP
Pink: 10/27/23 – October’23 low
Black: 8/18/23 – August low
Light Green 3/13/23 – March Low
Purple: 1/4/22 – 2022 high
Green: 10/13/22 – 2022 low
Daily Price Action
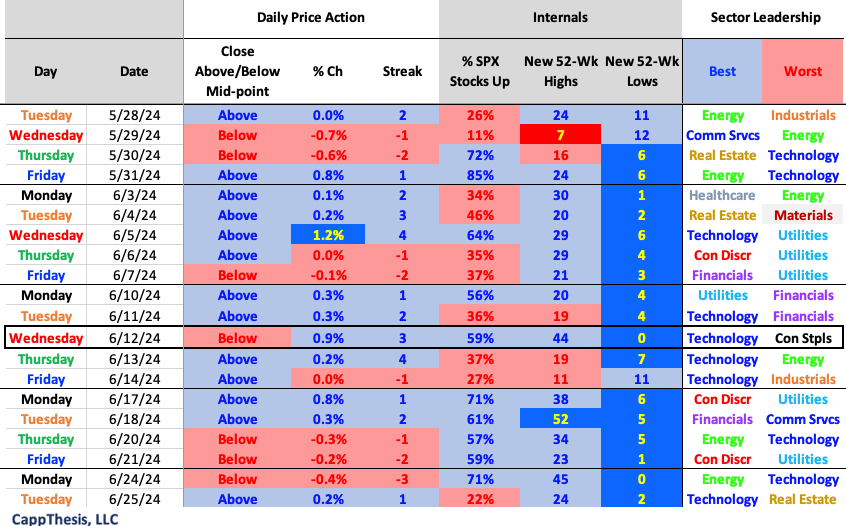
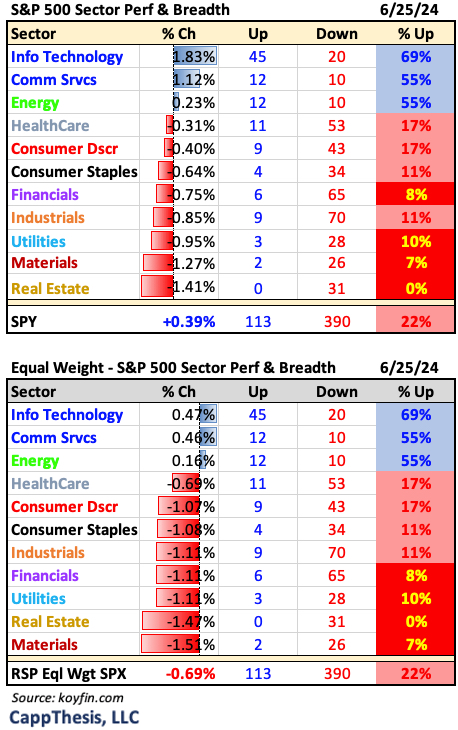
With the rest of the market retreating yesterday, only 22% of the SPX advanced. This was the worst breadth day of June.
Breadth
The NDX outperformed by a wide margin.

Sector ETFs
Energy maintained its relative strength even as the other value sectors got hit.
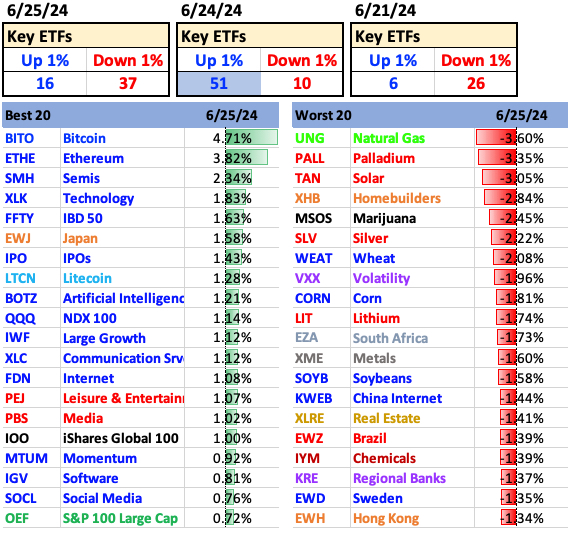
Best and Worst 20 ETFs
It was back to all growth on Tuesday.
XLC Comm Services
XLC was the leading sector ETF after Tech and made a new high on Tuesday. The last new high happened on 6/12. This helped XLC extend the breakout from early June, which has a pattern target up near 93…
… the huge multi-year pattern breakout from late-2023 also has an objective up at 93.
XLK Technology
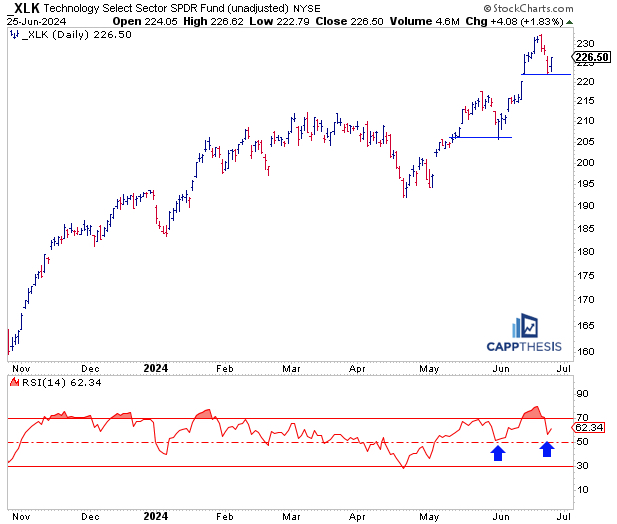
XLK broke its three-day losing streak yesterday with authority, which helped keep the ETF’s RSI above the mid-point so far. The indicator hit a low of 58 on Monday after tagging 80 at its highs last week. The RSI last bottomed out just above 50 in late May, which gave way to the most recent up-leg. The next test will be seeing if it can avoid logging a lower high.
XHB Homebuilders
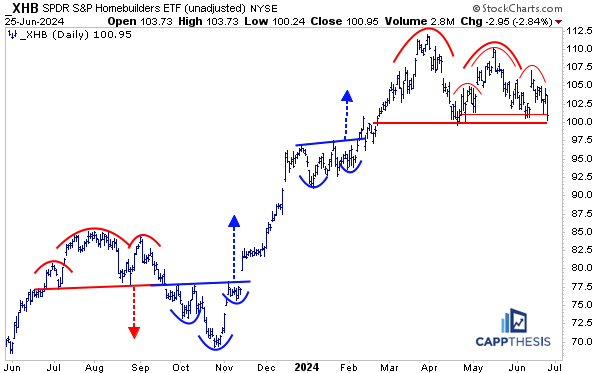
XHB got hit hard yesterday and now is back down to key support near 100 after failing at its declining 50-day moving average recently (not pictured). The ETF now is close to triggering two bearish patterns. XHB has leveraged both bearish and bullish patterns since last summer, so we should be watching closely on any potential breaks.
PEJ Leisure & Entertainment
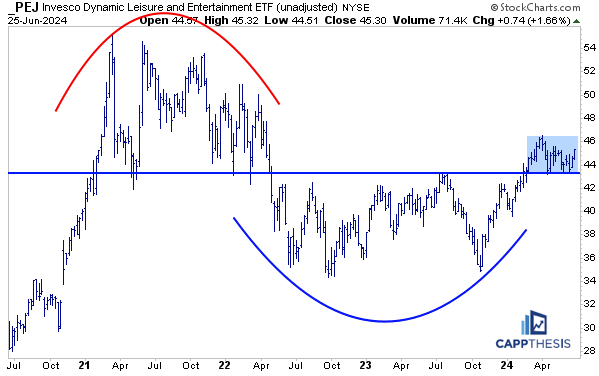
PEJ was one of the only non-Tech ETFs among the leaders yesterday. It’s now up 4/5 days and testing the upper zone of a two-month trading range. On the weekly chart, the ETF has been sitting above the very important area between 43-44. If this persists, the big bottoming formation can remain in play.
EWJ Japan
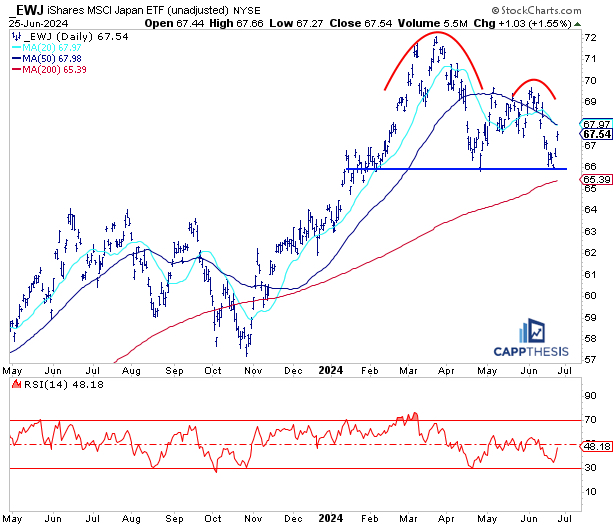
With the Nikkei 225 bouncing recently, EWJ has, too. But it has a lot of supply to still deal with: declining 20- and 50-day moving averages and resistance between 69-70.
OEF S&P 100 ETF
OEF is the only ETF we track that has a 14-day RSI above 70, though other large cap growth ETFs are close. Not surprisingly, it looks a lot like the SPX, as it tries to take advantage of its latest trading box.
WEAT Wheat
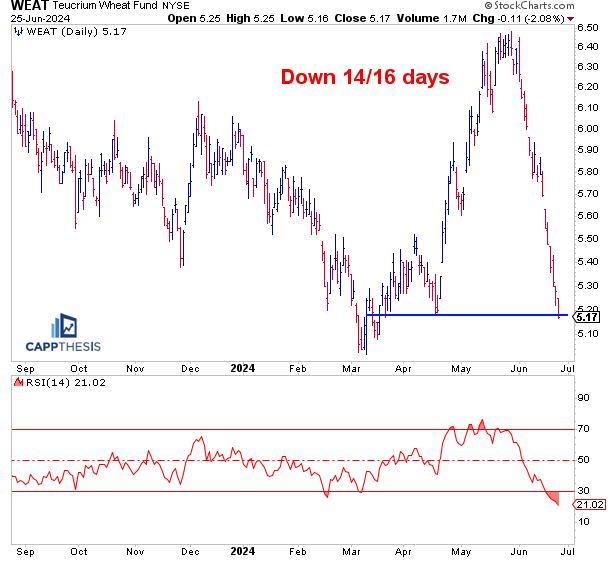
WEAT now is down 14/16 days and is deeply oversold, completely retracing the prior spike.
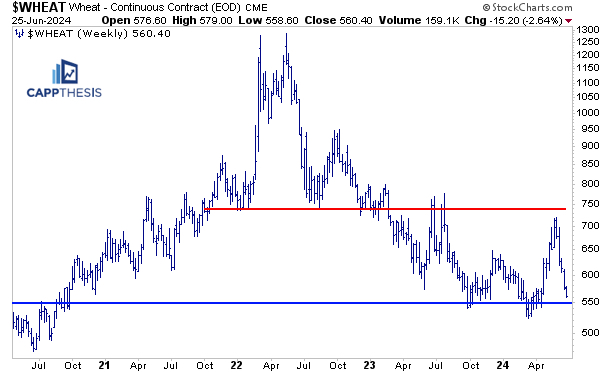
…. Bigger picture, it has been trading in this wide range since 2023. It’s now back down to key support near 550.
TLT
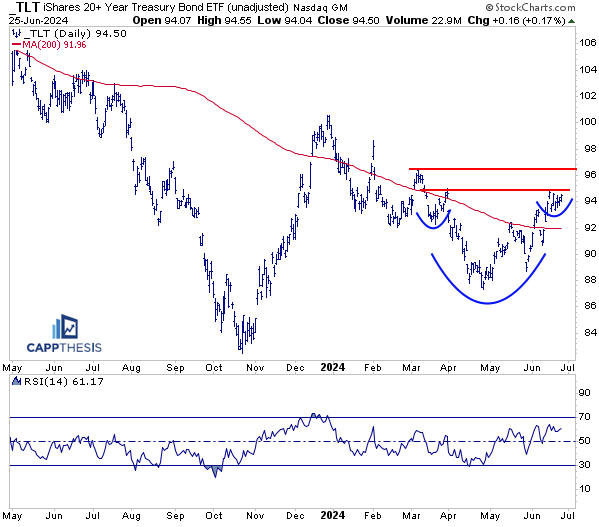
TLT has been forming a potential inverse H&S pattern. But it must get through the mid-90s for this to be triggered.
HYG vs. SPX
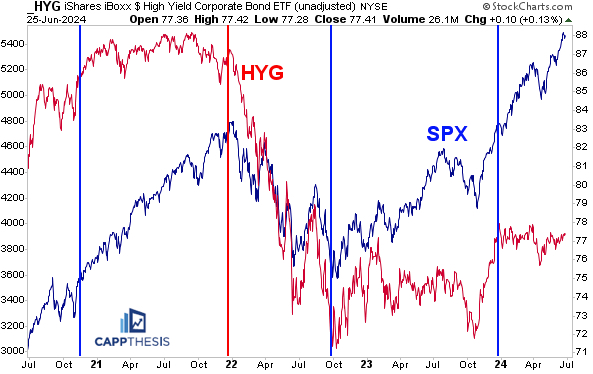
HYG has done nothing in 2024, and that has been bullish for equities. As the chart shows, we should be concerned if HYG suddenly loses its footing like in 2022.
