Key Points:
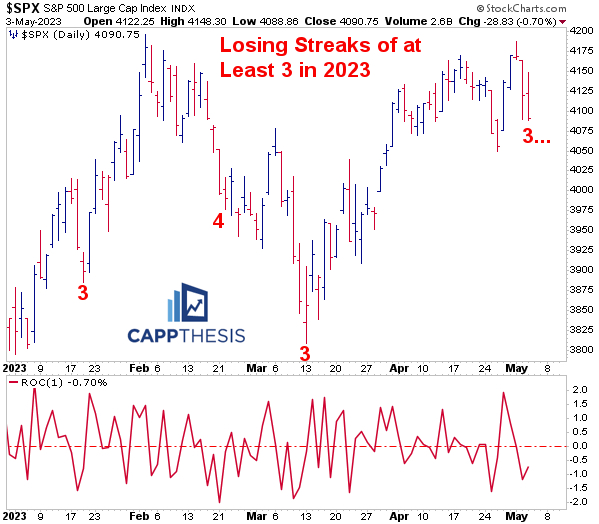
1- This is the SPX’s fourth losing streak of at least three in 2023. The difference this time is that the current sell-off has commenced after the index just made a new short-term high.
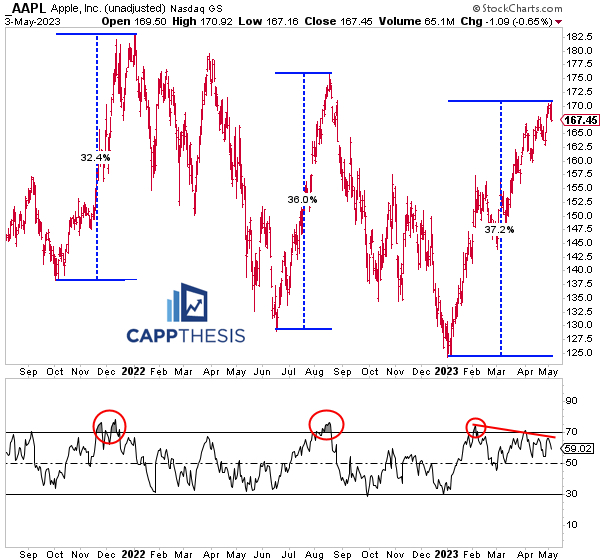
2- Coming into its earnings release this evening, AAPL is +37% from trough to peak from the recent lows, which now is the best of the three huge runs since late 2021.
3– XBI Biotech completed a clear bullish cup and handle pattern yesterday. It needs to hold above the 82 zone now, but with so many other growth-related names struggling, its relative strength shouldn’t be ignored.
Topics Covered in today’s Morning Trends:
1- SPX Losing Streaks
2- Short-term top
3- Bullish Pattern Update
4- SPX vs. 50-Day MA
5- AVWAP Levels
6- AAPL (4 charts)
Last Licks
1- Major Indices, Breadth
2- Wednesday’s Best & Worst 20 ETFs
3- IWC Micro Cap Leaders
4- XBI Biotech
5- OIH Oil Services (D & W)
6- Sectors Perf & Breadth
7- Sectors: XLB
8- XLRE, XLY
9- Bitcoin
SPX:
We come into Thursday after three straight SPX declines, three consecutive closes below the mid-point, the FOMC meeting behind us, more regional bank pain and AAPL’s earnings tonight.
This is the fourth losing streak of at least three in 2023 so far. The longest run has been four consecutive losses.
The three prior streaks happened 1. During the January uptrend 2. In the middle of the February-March downturn and 3. At the very END of the February-March sell-off. No edge there…
One difference this time is that the current sell-off has commenced after the SPX just made a new short-term high. The technical damage has been limited so far. The index is – from Monday’s high point.
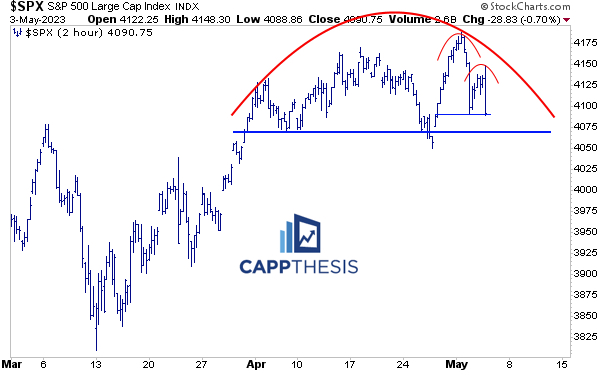
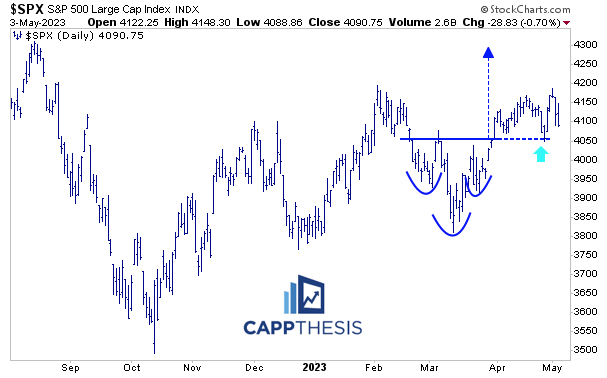
And while the resultant pattern isn’t exactly textbook, the various pullbacks over the last few weeks have created a potential short-term topping pattern.
And that has prevented the bigger bullish pattern from being triggered.
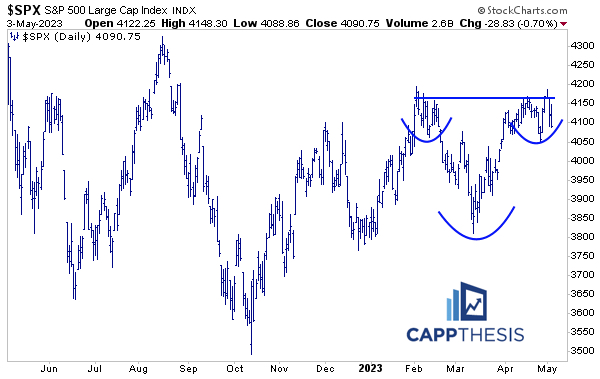
The bullish pattern that was triggered on 3/31 remains in play. It was challenged with last week’s big down day, and the SPX starts today about 90 bps above it.

SPX vs. 50 Day MA
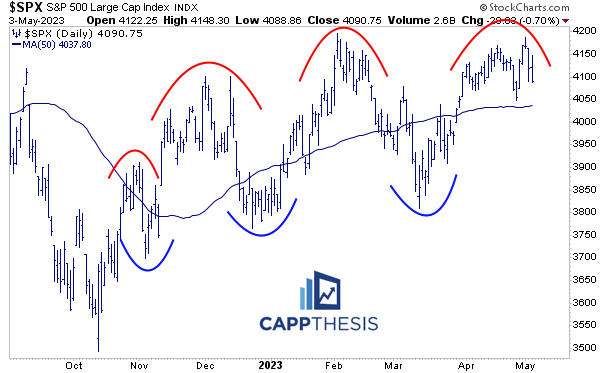
Last week’s strong bounce to conclude April also kept it above the 50-Day MA. We’ve shown this before… no rally has been strong enough to hold above the line for longer than a few weeks.
And none of the ensuing pullbacks have been bad enough to keep it below the line either.
SPY Anchored VWAP
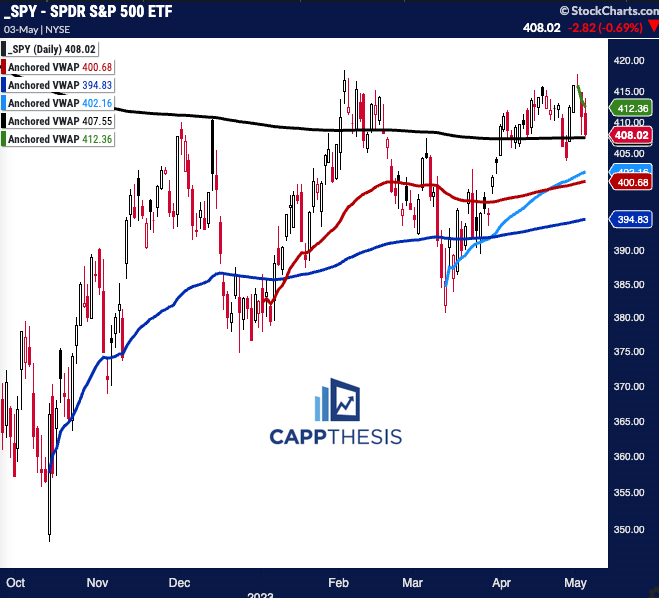
To reiterate, here are five VWAP lines that we’re watching. The two most relevant for today are tied to:
5/1/23 – the most recent intra-day high and negative reversal (green)
1/4/22 – the all-time high (black)
The red line is the YTD AVWAP, while the blue lines are anchored to the 2022 low (dark blue) and the 2023 low (light blue).
AAPL
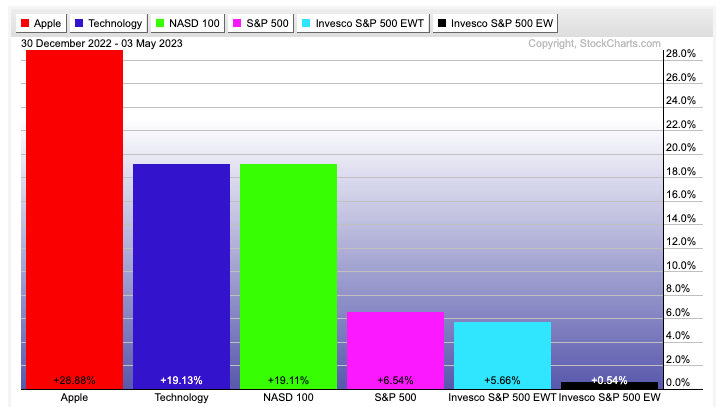
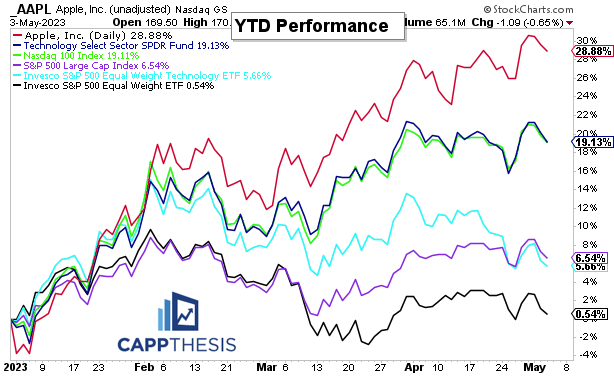
As you may have heard, AAPL is pretty influential. At nearly +30% YTD, it’s pulled every market cap weighted index along with it. It hasn’t been the best Tech name (NVDA is +90%), but consider this: The XLK Technology ETF is +19.1% YTD; the Equal Weight Technology RYT ETF is +5.7%.
Here are two charts showing the distinct performance differences.
AAPL is +37% from trough to peak from the recent lows, which now is the best of the three huge runs since late 2021.
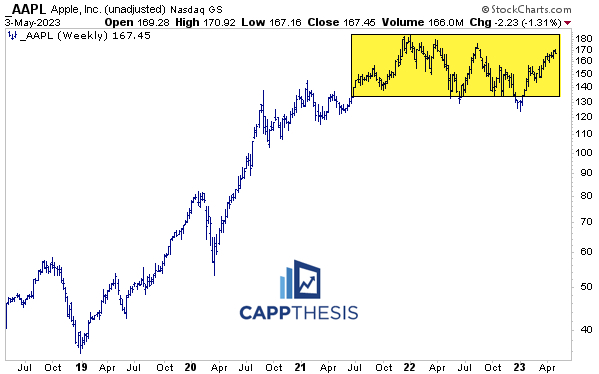
Longer-term, the last two years have been one big trading range. It looks like a massive continuation pattern, but for now, each rally up to the 170-180 zone has been faded.
Last Licks for Wednesday, 5/3
Major Indices, Breadth

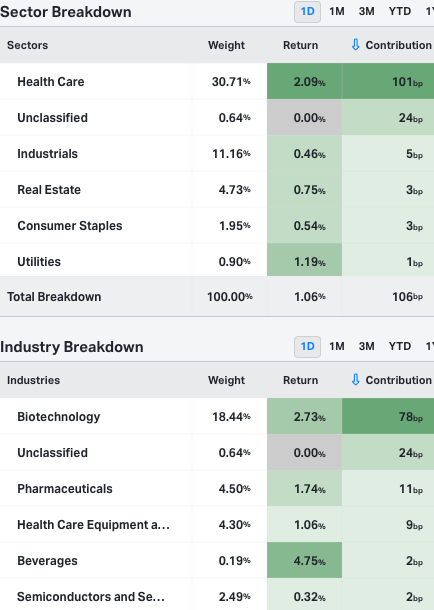
Yesterday, big decliners again outpaced big gainers on our ETF list. However, small and micro caps outperformed, thanks mostly to Biotech’s distinct relative strength.
Best/Worst 20 Yesterday
ETFs UP at least 1%: 12
ETFs DOWN at least 1%: 26
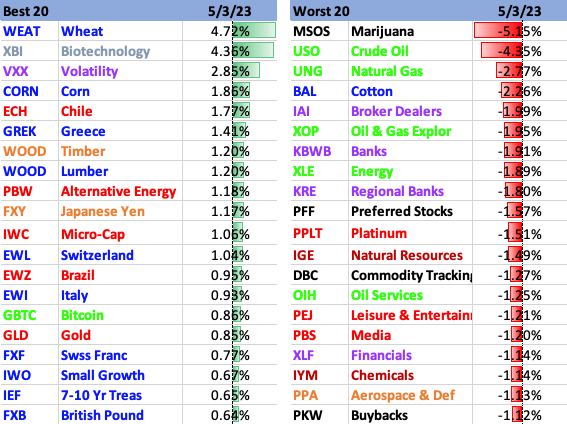
This was clear on IWC’s sector and industry breakdown.
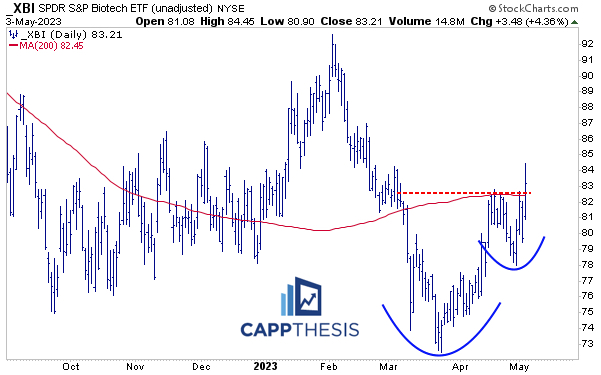
XBI
We’ve talked about XBI’s comeback lately, and yesterday, it completed this clear bullish cup and handle pattern. Indeed, it needs to hold above the 82 zone now, but with so many other growth-related names struggling, this relative strength shouldn’t be ignored.
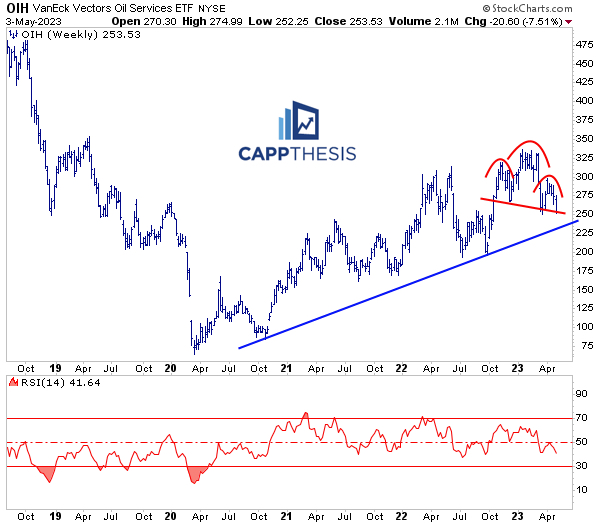
OIH
The potential bearish pattern remains a concern on the weekly chart…
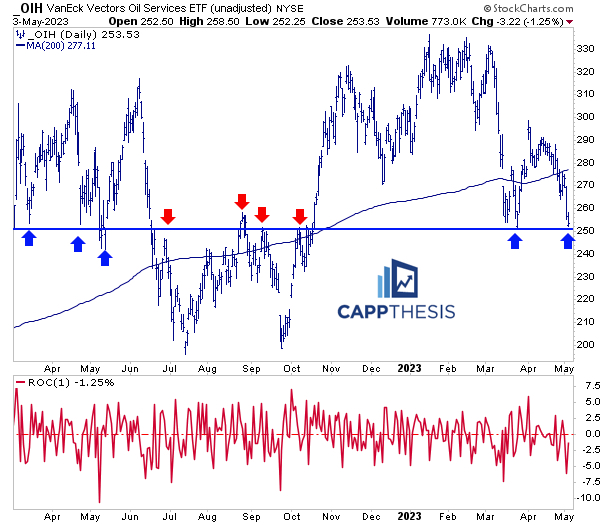
But from a daily perspective, OIH has a chance to bounce near the 250 zone again, which has been an important support (and resistance zone) for at least a year now.
Sectors
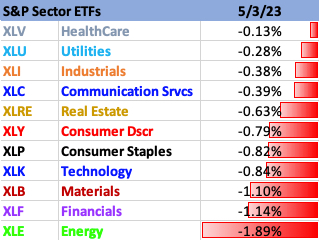
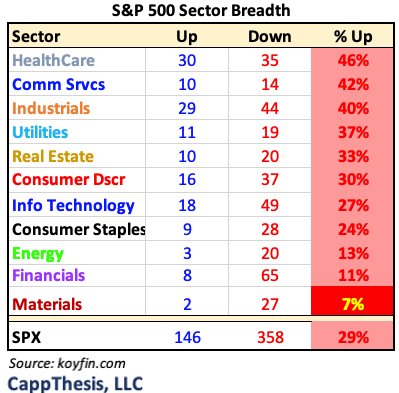
All 11 Sectors fell yesterday, with Materials, Financials and Energy all dropping 1%.
XLB Materials
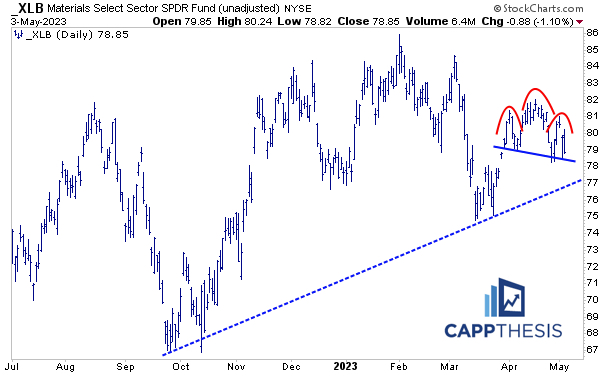
XLB had only two of its names up, and it’s now sporting this six-week topping formation. It’s still in an uptrend, but it’s struggled to do anything more than bounce after downturns lately.
XLRE and XLY aren’t mentioned together a lot, but they stand out given that both have flat-lined since late March. Keep them on the radar screen for the next moves…

Bitcoin
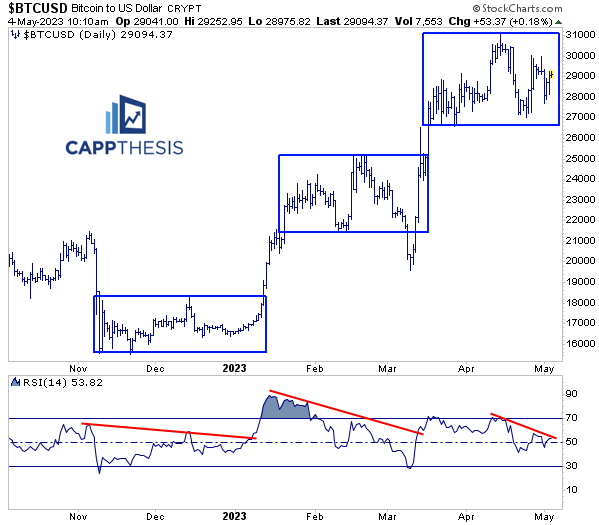
BTC’s recent back and forth movement has frustrated bulls and bears alike. Here’s another perspective. Continuing to consolidate – and not break lower – makes it appear similar to the prior trading ranges since late 2022, both of which were resolved higher.
BTC broke out both times soon after seeing its 14-Day RSI break above a downtrend line. It could be getting close to challenging a similar line again now.
