Chart of the Week – NFLX
Within the Chart Trades report, we’ve started to do write ups for key stocks before and/or after earnings for key stocks. Here’s the note from Friday’s piece that highlighted NFLX. Upgrade to a premium membership to receiving Chart Trades, which hit your inbox early in the morning twice a week.
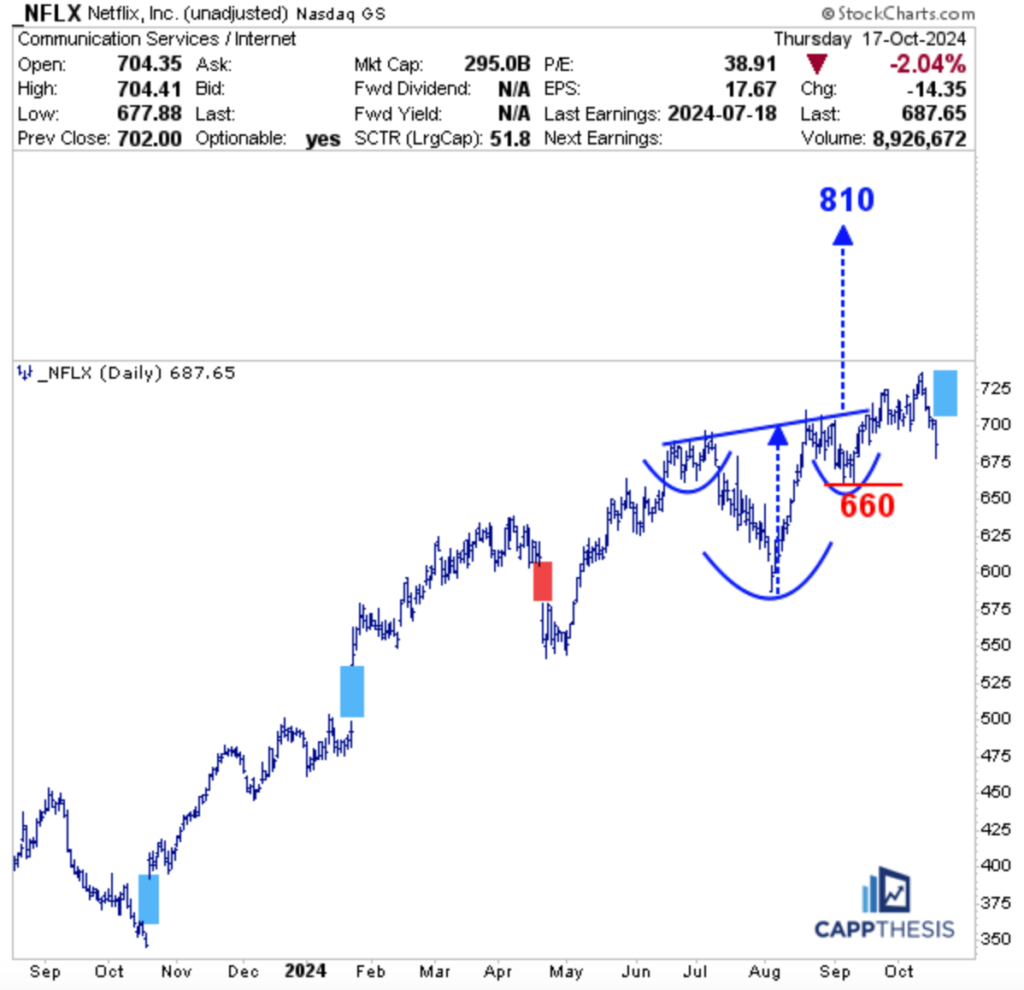
We last recommended NFLX on 9/17, as it was close to completing the inverse H&S pattern. While the stock got through the noted breakout point, real upside follow through has been lacking the last few weeks. The early reaction to last night’s earnings has the stock trading near all-time highs. Thus, the upside target of 810 still is in play.
Going forward, we’ll need to watch how the stock does vis-à-vis the apparent opening upside gap. It’s had noticeable gaps post earnings in three of the last four quarters – Two up and one down. NFLX respected the upside gaps from last October and January, with the stock trending higher over the ensuing three months.
Conversely, it filled the downside April gap within a few weeks and rallied through mid-July. Thus, the next two weeks of action will prove important once again, with NFLX trying to hold above and, potentially, extend from today’s gap.
Bigger picture, the question that will need to be answered for NFLX and hundreds of stocks over the next few weeks is this:
How will the market view the current technical state?
1-Too extended from its August low to reward a solid earnings report.
Or…
2-Net flat since the last earning cycle, with a budding bullish pattern breakout ready to be leveraged.

While the MAG 7 has replaced FAANG (of which NFLX was a member), as the market’s favorite acronym, NFLX always is highly watched given that it’s the first large cap growth company to report numbers. Like many other growth names, it has come back from the August depths, but it hasn’t extended too much beyond its highs.
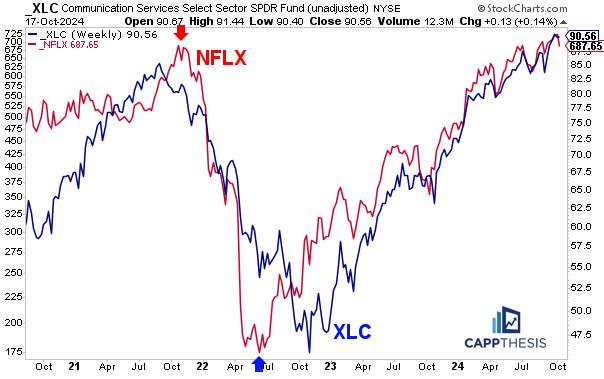
NFLX is a member of the XLC Communication Services group, of which is has a 6% weight. That’s the third biggest among the 32 holdings, but it’s much smaller than META (20%) and the two classes of Alphabet – GOOGL and GOOG, which have a combined weight of 19%.
However, it has matched XLC’s track over the last three years. It held on longer than XLC in 2021/22 before rolling over. And it made a key low a full three months BEFORE XLC and the general market in 2022. Thus, we should watch it closely, whether we have a position in it or not.

Interviews, articles and social media
CNBC Pro Article
What the charts say about whether the S&P 500 can continue higher into year-end
YouTube
Strong Breadth & Extreme Sentiment
Spotify
Strong Breadth & Extreme Sentiment
Talking with Traders Podcast
Sticking to a disciplined approach to investing is key
CappNotes
CappThesis Premium Content
Starter, Trader & Professional
Tuesday
Chart Trades: 10/15/24 – 2 buys
Chart Trades: 10/18/24 – 2 buys & Earnings
Trader & Professional Only
Monday
Opening Look: Weekly Charts
Tuesday
Opening Look: Strong Breadth & Stretched Sentiment
Wednesday
Opening Look: New Highs & a Bearish Engulfing Pattern
Thursday
Opening Look: Small Caps – Now vs. July
Professional Only
Monday
Roadmap: Week of 10/14/24
Thursday
Breaking Out Video
Client meetings & calls


