Key Points:
1- The SPX has formed a small bullish pattern over the last few days, which could provide a foundation for a bigger upswing.
2- On the arithmetic chart, the SPX remains inside a year-long upward channel, bouncing the lower line near its lows a few days ago.
3- XLC Communication Services outperformed yesterday and again held above its August lows. See more below.
Topics Covered:
-Small bullish pattern
-Pattern update
-Key support
-AVWAP
-Index Breadth
-Sector Perf & Breadth
-Best & Worst 20 ETFs
-XLRE, XLU
-TLT
-XLC
-XHB
-JETS
Bouncing
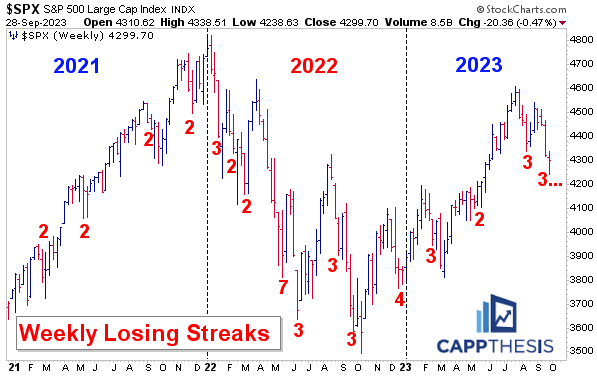
The SPX comes into the final day of the week, month and quarter up three of four days, but still down for the week. That’s not exactly encouraging given that it would be the fourth straight weekly decline…
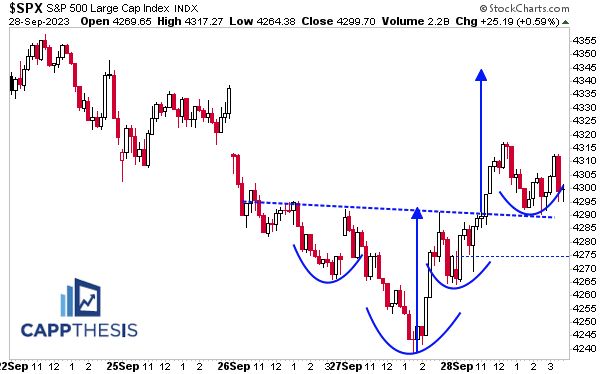
…but over the last few sessions, the index has been constructing a small foundation in the form of this inverse H&S pattern.
It’s tiny and only can be seen via an intra-day view, but with the unrelenting selling up to this point, it’s a step in the right direction. The target near 4,345 very well may be hit on the open if this pace keeps up. However, we care more about what it could lead to from here.
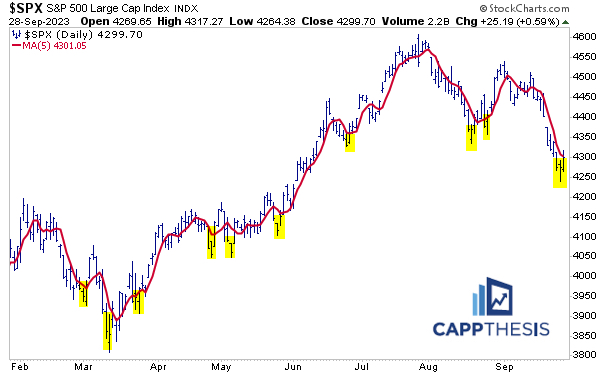
The bounce also started after the index had gotten extended to the downside vs. its 5-D Moving Average. The next step from this perspective would be to push above the line.
More importantly, enough positive action could prompt the line, itself, to start going up again. That’s a necessity. Afterall, we can’t have an uptrend if the shortest trend is moving straight down.
While the SPX didn’t HIT any of the five major support zones we highlighted this week, it got close. And this provided reason enough for at least some buy interest to emerage where it has been sorely lacking the last two weeks.
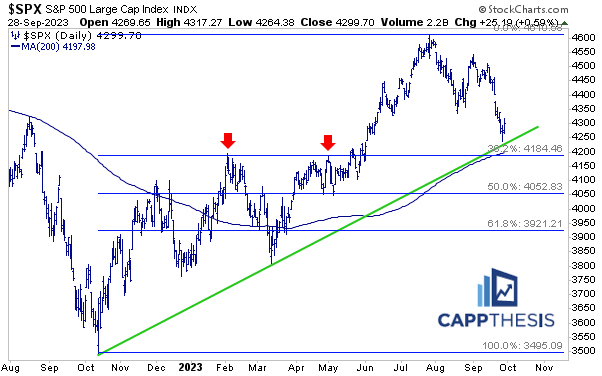
Of course, it won’t be THAT easy.
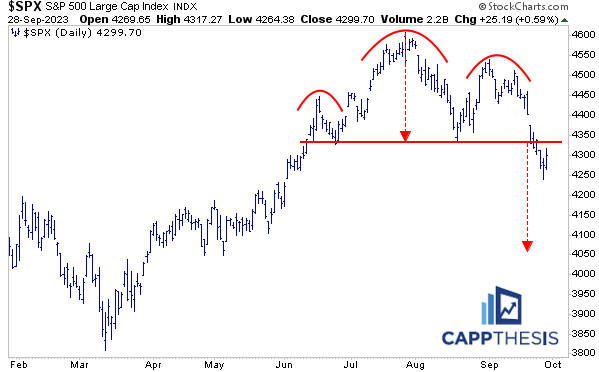
The big bearish formation remains, well, big and bearish. Given that the sharp rally to conclude August was sold so aggressively, any bounce from here would take some convincing.
So, while the pattern’s breakdown zone could be reclaimed with a strong upside follow through from here, we’ll next need to see a more substantial bullish formation take shape.
This could take some time to develop.

Weekly Channels
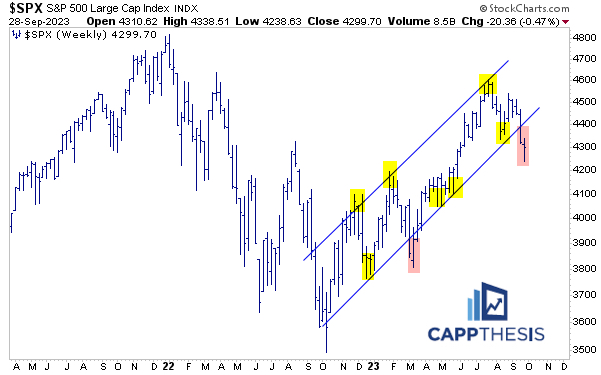
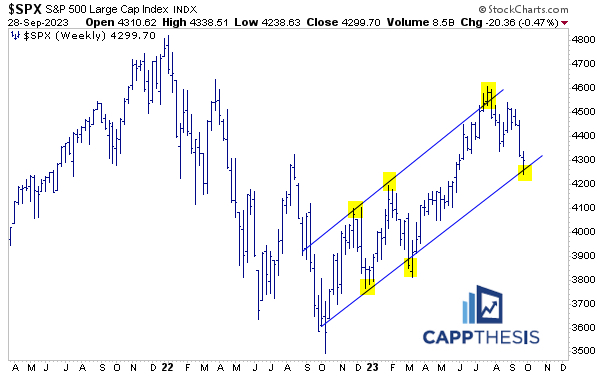
Here are two weekly charts.
The first one is in log scale, the second in arithmetic scale.
The SPX extended farther below the lower threshold of its channel in the log-scale version this week. That’s certainly not bullish, but this also happened in March, and a strong run resulted in the following months.
On the arithmetic chart, the SPX remains inside the channel, bouncing the lower line near its lows a few days ago. We can see clearly how similar pullbacks to the line led to strong bounces over the last year.
SPY AVWAP
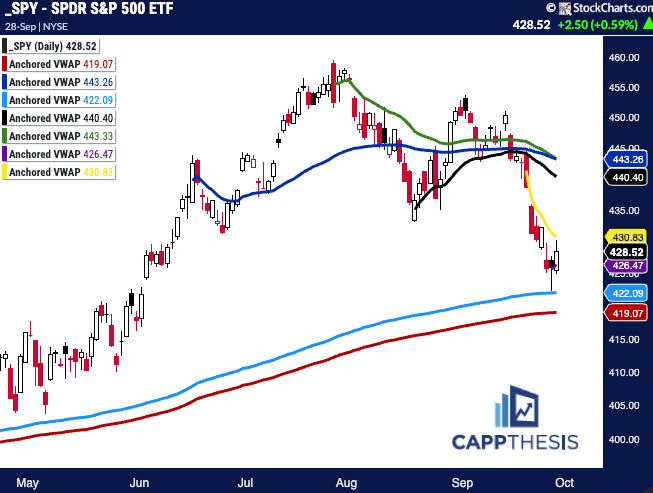
Despite yesterday’s bounce, SPY remains below the VWAP anchored to the FOMC decision from 9/20. Reclaiming this mark would be a big accomplishment from a short-term perspective.
We’ve added a new (purple) line here, as well, tied to Wednesday’s pivot low. The light blue line it successfully tested is anchored to the 2/2/23 high.
Breadth
Breadth has improved all week, as this progression shows. The SPX had been lagging up until yesterday.

Sector ETFs
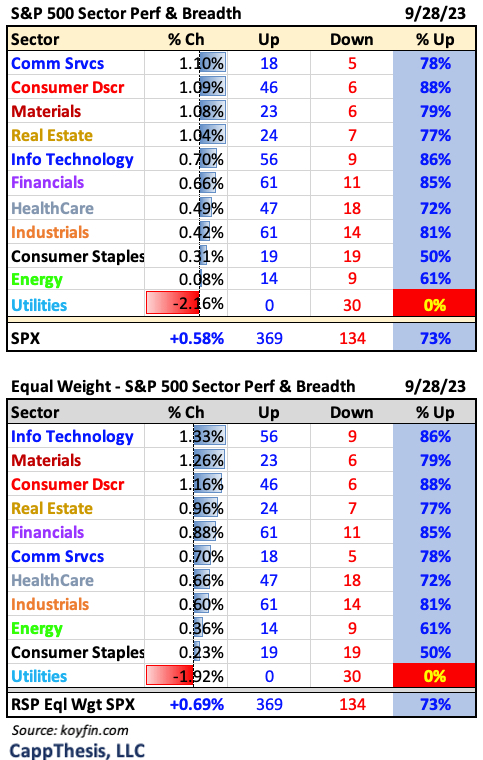
Four Sector ETFs were up at least 1% yesterday, while 10/11 had positive breadth. XLU stood out like a sore thumb – down 2.2% with all 30 names down. More on this below…
Best and Worst 20 ETFs
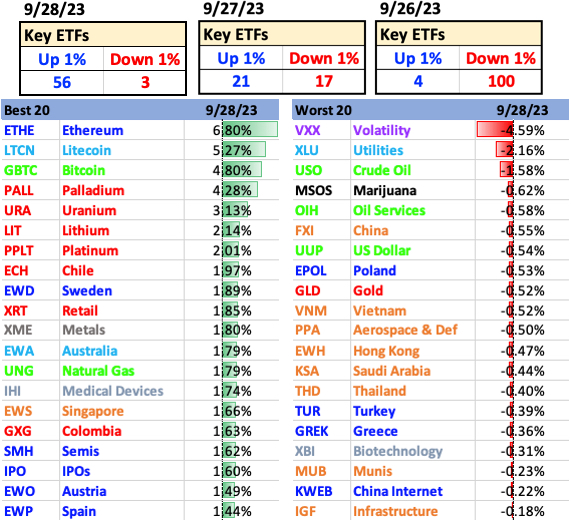
The number of 1% gainers went from 4, to 21 to 56 yesterday over the last three days, as the number of 1% decliners dropped from 100 on Wednesday to three yesterday.
XLRE, XLU & Bond ETFs
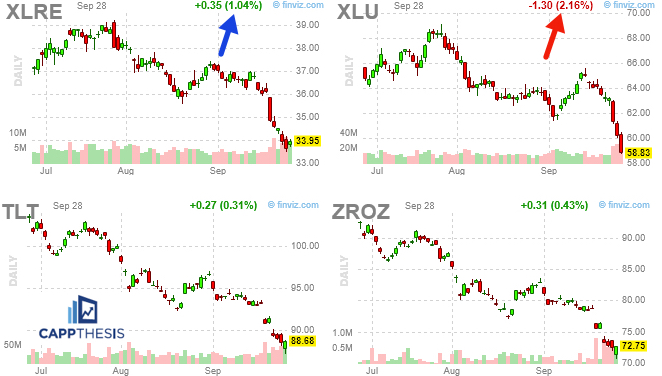
With XLRE +1% yesterday and XLU down 2%, it was an odd performance discrepancy. However, judging by how the popular Bond ETFs did, it’s apparent that XLRE’s gain was a better read on what happened than XLU’s big loss.
TLT
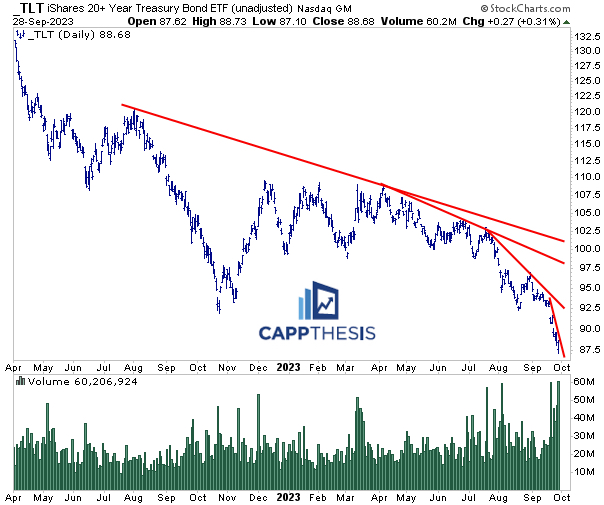
As we know, TLT has been killed with rising rates. Volume has exploded, and the downtrend has gotten steeper and steeper. We see this clearly by the four trendlines below. The last few weeks have produced a line that’s nearly vertical. At the very least, we know this pace can’t continue.
XLC Communication Services
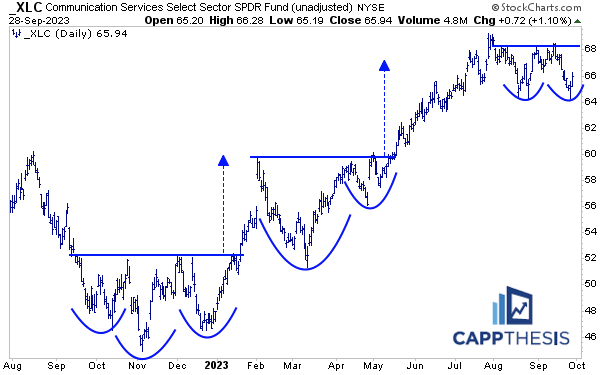
XLC outperformed yesterday and again held above its August lows. As a result, it has another chance to form a bullish pattern – after the mid-September breakout failed.
XHB Homebuilders
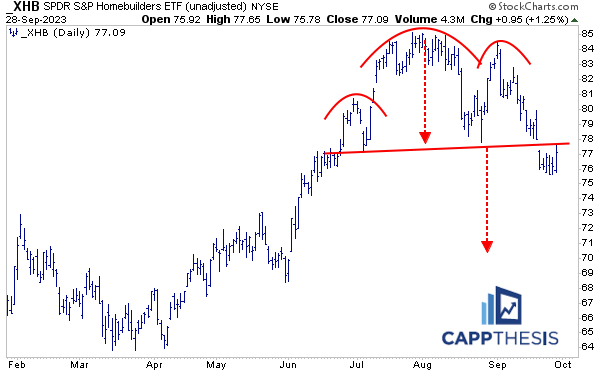
XHB – like many others – continues to sport a big bearish pattern. This will be tested on a continued rally effort. Again, it’s all about what comes AFTER the oversold bounce…
JETS
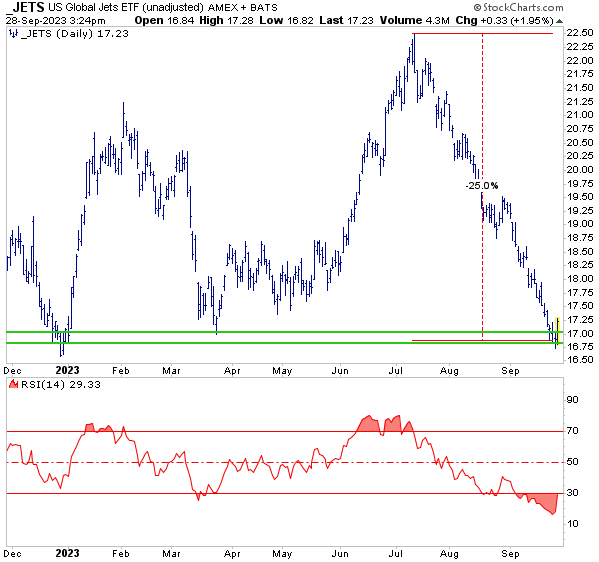
Some areas have gotten hit a lot harder already, like JETS, which we’ve brought up a few days ago. Regardless of the reasons it has fallen, it’s rare to see an RSI go from above 80 to sub-20 in two months. If the market is going to extend the mini bounce, the most beaten up areas like JETS could benefit the most.
