Key Points:
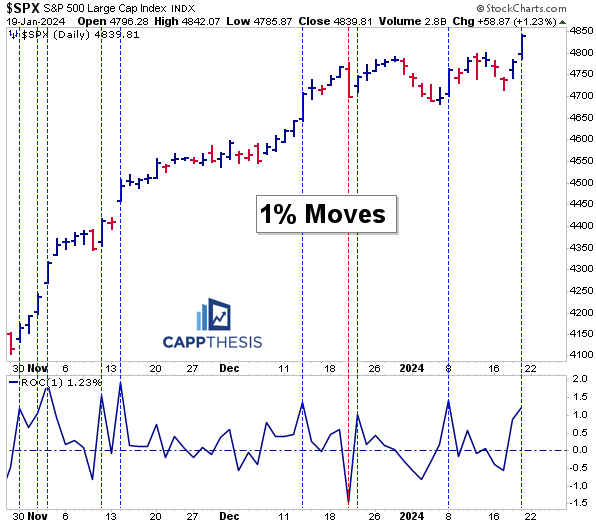
1- The SPX now has logged nine 1% gains vs. one 1% decline since 10/26/23 – or 57 trading sessions. Of the eight prior 1% advances, the SPX has logged another up move the next day seven times.
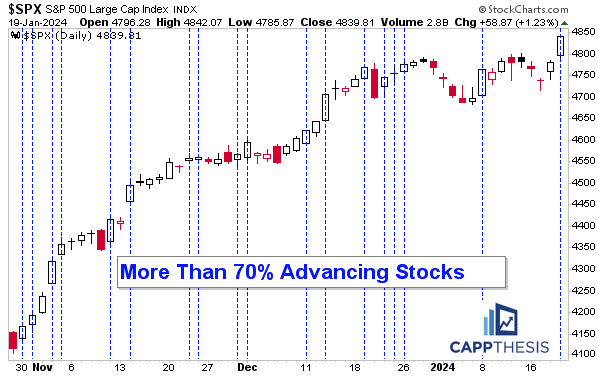
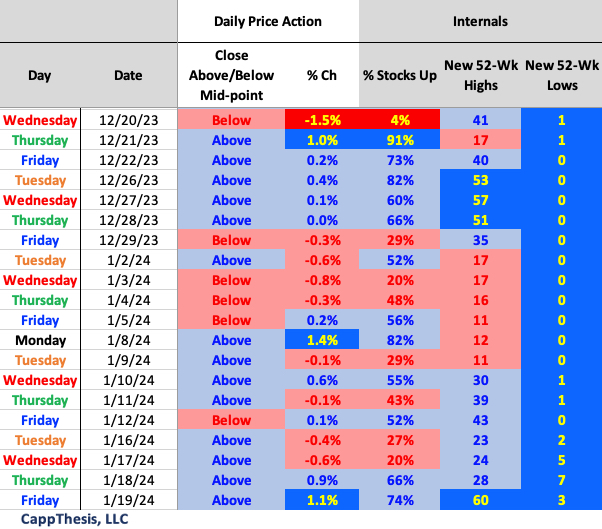
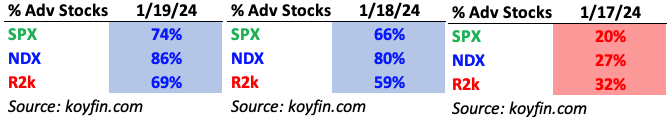
2– With 74% of the index up on Friday, it was the first 70%+ day since 1/8 and just the second since 12/26.
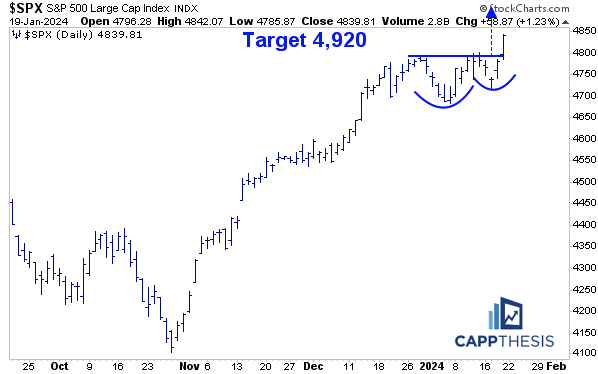
3- The SPX broke out of the small bullish pattern we’ve been tracking and already is 1% above its breakout point. The target is 4,920.
Topics Covered:
Market
-1% moves
–Short-term
-SPX vs. 20-Day MA
-Breadth
-Pullback scenario
–New live bullish pattern
-AVWAP
Stats
-Daily Price Action
-Index Breadth
-Sector Performance
-Best & Worst ETFs
Key Charts
–KRE
-KIE
-ACWI
-XHB
SPX:
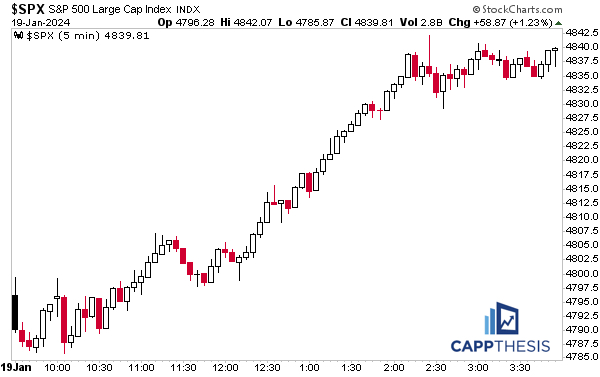
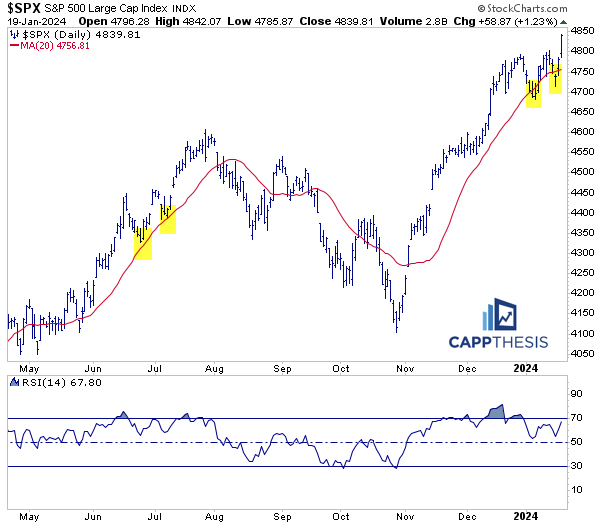
The SPX finally followed through, gaining 1.2% on Friday, its second 1% advance of 2024 (vs. zero 1% losses).
Traders had been flirting with a big session with afternoon buying sprees occurring in the four prior sessions. However, we had not seen that effort extend into the next morning until Friday, which started flat but quickly turned higher and didn’t look back. Momentum kicked in the rest of the way… along with new all-time highs.
That makes it nine 1% gains vs. one 1% decline since 10/26/23 – or 57 trading sessions. Of the eight prior 1% up-moves on the chart, the SPX has logged an advance the next day seven times. The only time that did not happen was from 1/8 – 1/9/24. We saw consecutive 1% gains once – from 11/1-11/2.
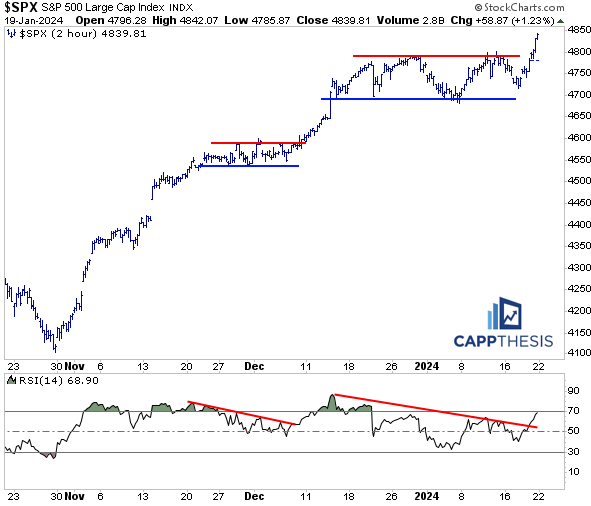
The potential negative momentum divergence on the 2-hour chart, thus, ended up being a non-event. In other words, it ultimately proved to be a pause, which adequately prepared the market for the next breakout – just like we saw from late-November to early-December.
Indeed, a divergence still is present now, with the 14-period RSI still not overbought yet. This is important to monitor… however, while indicator readings give us an idea of the backdrop, the price action always tells us the true story.
The bounce, thus, also pulled the SPX back above its 20-day moving average – despite the index flirting with breaking below the short-term line twice in the year’s first few weeks.
When the SPX first touched the average three weeks ago, we noted that the same thing happened in late June and early July. The index rose for another three weeks after the second bounce from the line back then before the bottom dropped out.
In the most consistent and longest uptrends, though, the SPX has proven it can continue oscillate to around the 20-day. In fact, buying dips after seeing the index undercut the line can be a rewarding strategy. See the 2020-21 period for an example…
With 74% of the index up on Friday, it was the first 70%+ day since 1/8 and just the second since 12/26. We see this clearly on the updated chart below that we first talked about last week. There’s nothing wrong with the breakout but seeing more participation would help quell the crowd who isn’t comfortable with the biggest names leading.
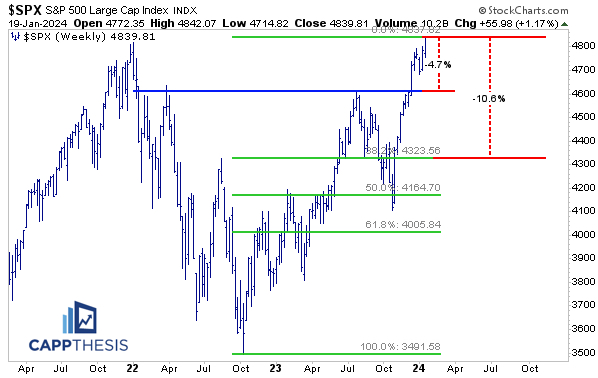
So, what if things stop going up soon?
Here are two quick reference points to consider.
A drawdown back to the 4,600 zone would be about -4.7% from current levels. A potential drop back to the 38.2% retracement level of the entire October’22 – January’24 advance (near 4,320) would equate to approximately -10.6%. This isn’t a prediction, but even with many bullish patterns still out there, we can’t ignore what an inevitable drawdown greater than 2% could look like if/when it finally happens.
Patterns
Off of Friday’s large advance, the SPX broke out of the small bullish pattern we’ve been tracking and already is 1% above its breakout point. The target isn’t too far away either – 4,920.
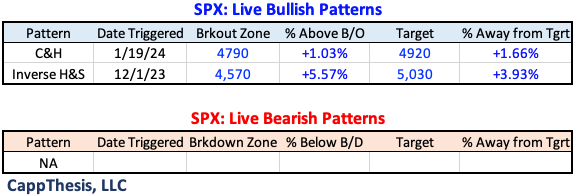
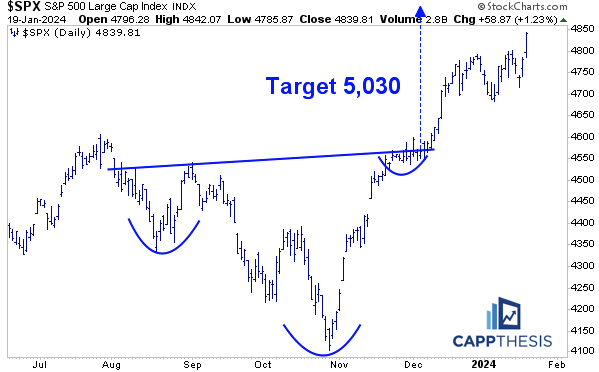
And that means that the SPX now is less than 4% away from the 5,030-target.
SPY AVWAP
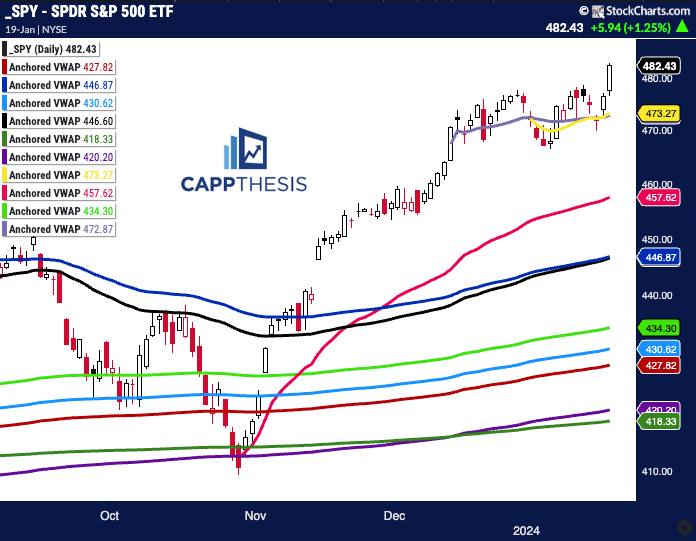
Needless to say, SPY did, in fact, extend after bouncing off the two short-term VWAP lines on Thursday.
SPY
Yellow: 1/2/24 – YTD VWAP
Light purple 12/13 – FOMC
Pink: 10/27 – October’23 low
Blue: 6/15 – FOMC negative reversal
Black: 8/18 – August low
Light Green 3/13 – March Low
Light Blue: 2/3 – Former high point
Red: 1/2/23 – Start of 2023
Purple: 1/4/22 – 2022 high
Green: 10/13/22 – 2022 low
Daily Price Action
The 60 S&P 500 stocks making new 52-week highs were the most since the 107 high from 12/14, which is clearly constructive.
Breadth
Breadth was positive across the board for the second straight session, with the NDX leading both days.
Sector ETFs
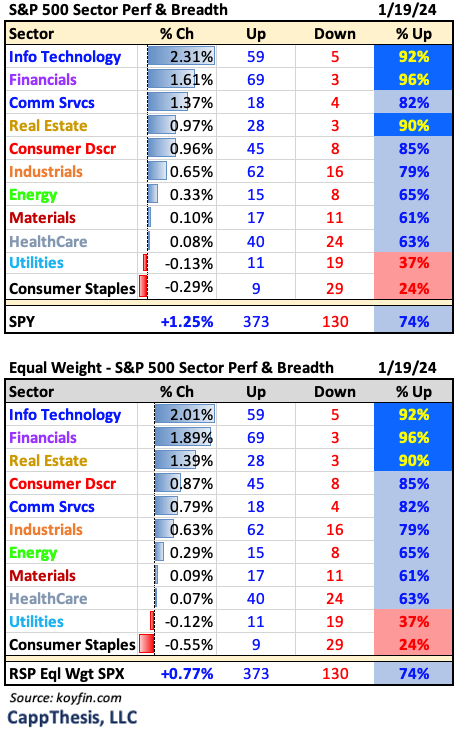
With Tech and Financials both seeing more than 90% of their holdings advance, the SPX greatly benefited and again outperformed the RSP Equal Weight SPX ETF.
Best and Worst 20 ETFs
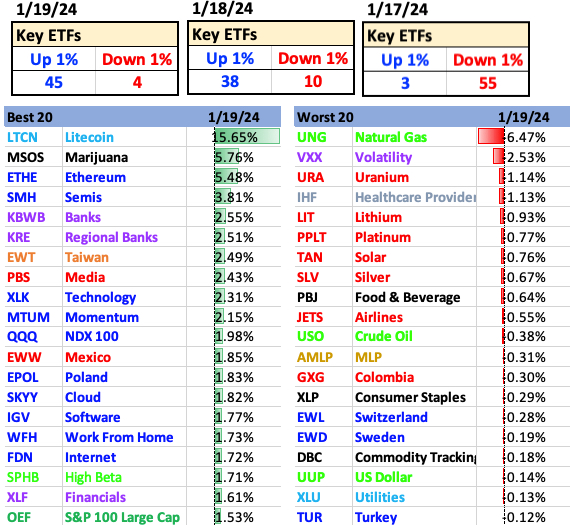
The Tech and Financial leadership were evident on our ETF list, as well.
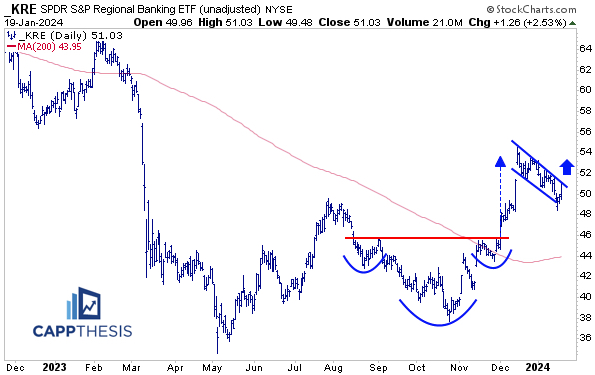
KRE Regional Banks
KRE was up 2.5% on Friday, its best gain since 12/14/23. The pullback the last few weeks has taken place after the ETF hit its bullish pattern target in mid-December… and above that breakout area.
It now has a chance to leverage the Friday’s bounce and make last week’s action appear like a legitimate higher low. From a pattern perspective, this appears like a bullish falling wedge pattern.
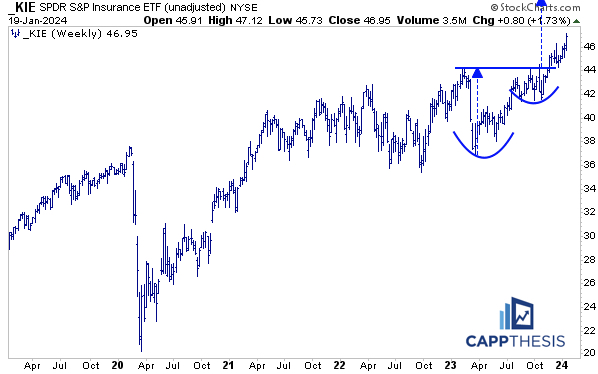
KIE Insurance
KIE was up 1.7% on Friday, made another new all-time high and continued to extend its bullish breakout. The target is up near 52.
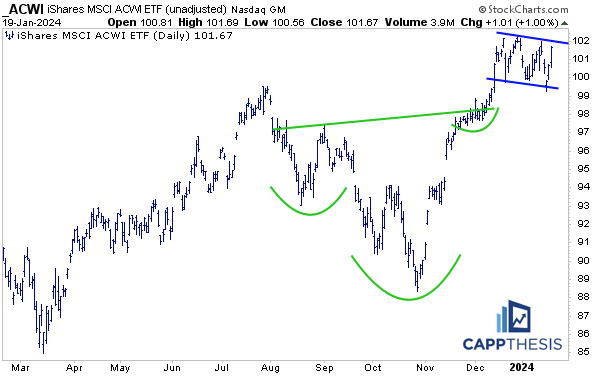
ACWI MSCI ETF
According to MSCI the ACWI (all country world index ETF) “captures large and mid cap representation across 23 Developed Markets (DM) and 24 Emerging Markets (EM) countries. With 2,921 constituents, the index covers approximately 85% of the global investable equity opportunity set.”
From a chart perspective, ACWI has been consolidating above a big pattern breakout from December (like the SPX), but it has yet to break out. The next attempt could happen soon.
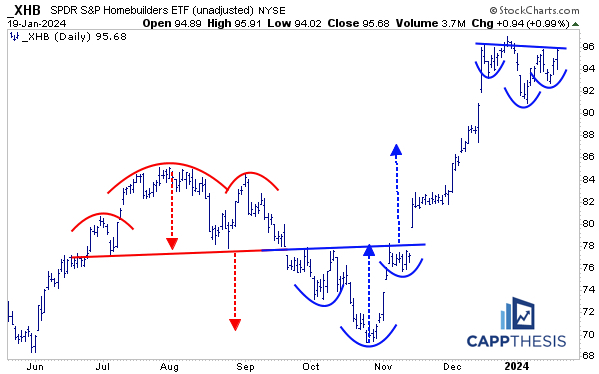
XHB Homebuilders
XHB has had a wild ride since last August, but along the way, it’s formed and taken advantage of very clear technical patterns. It hit both downside and upside targets from September through December. And with it having constructed another potential inverse H&S pattern now, it has an additional chance to breakout again. If it happens soon, the target would be near 101.