Key Points:
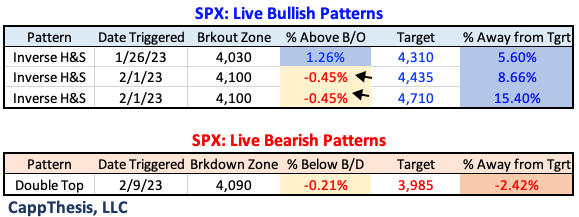
1- Yesterday’s continued sell-off nudged the SPX below the 4,090 zone and produced a short-term double-top. The downside target measures to 3,985.
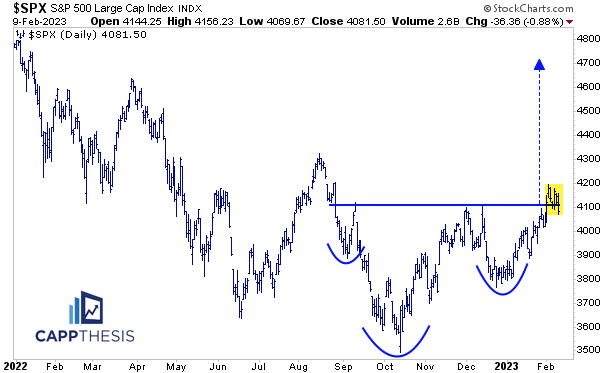
2- This presents a pattern conundrum because the SPX also starts the day slightly BELOW the breakout zones of the two recently triggered bullish patterns – both of which broke out through 4,100.
3- The last bearish pattern was constructed last month, but with the SPX holding instead, it never was triggered, and the January 26th breakout took the reins. See more below.
Topics Discussed:
1- SPX New Bearish Pattern
2- SPX Bullish Patterns being tested
3- Updated Pattern Grid
4- US Dollar
5– 10-Year Yield
6- Crude Oil
7- COP
8- AAPL
SPX
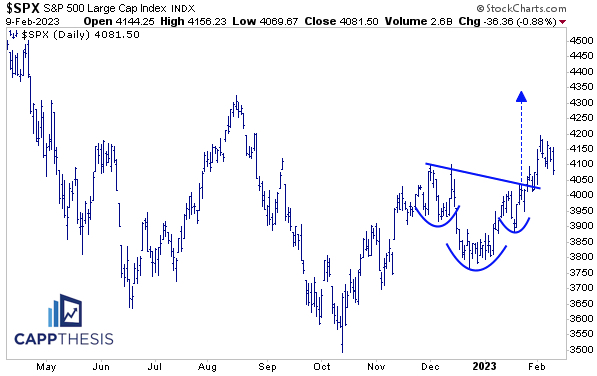
Over the last few weeks, the SPX has made a habit of finishing near its highs – both on a daily and weekly basis. That has kept the positive momentum going and prompted the SPX to break out of three bullish chart formations, which we’ve discussed here every morning.
The index closed near its intra-day lows the last two days, and as of now, it is sitting near its weekly low point, too. Should this last, it would connote a change of character, which also eventually could result in a change of trend.
As noted in Wednesday’s Morning Trends piece, a trend change would require two things to happen from a pattern point of view: We would need to see the plethora of bullish formations fail and finally see topping patterns start to work.
Right now, there still are a lot more potential bases than tops across the market landscape, but nothing is static in the world of trading. Thus, we can’t ignore the potential signs, even if they don’t end up playing out.
For example, yesterday’s continued sell-off nudged the SPX below 4,090 zone and produced this short-term double-top. The downside target measures to 3,985.
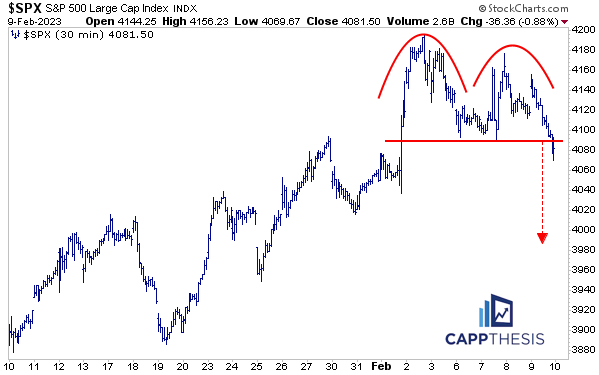
And this presents a pattern conundrum.
That’s because the SPX also starts the day slightly BELOW the breakout zones of the two recently triggered bullish patterns – both of which broke out through 4,100. As noted in last evening’s Last Licks piece, we’re giving both breakouts the benefit of the doubt for now, but additional downside follow through officially would negate them.
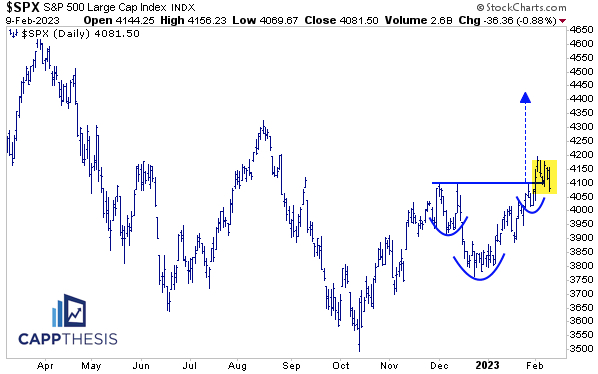
The bullish formation triggered in late January has a bigger cushion of which to work.
It’s not often that both bullish and bearish patterns appear on our pattern grid, but when they do, it often can mean that an inflection point is imminent.
We noted this exact scenario last month when this last potential bearish pattern materialized. But with the SPX holding instead, it never was triggered, and the January 26th breakout took the reins… the market took off from there.
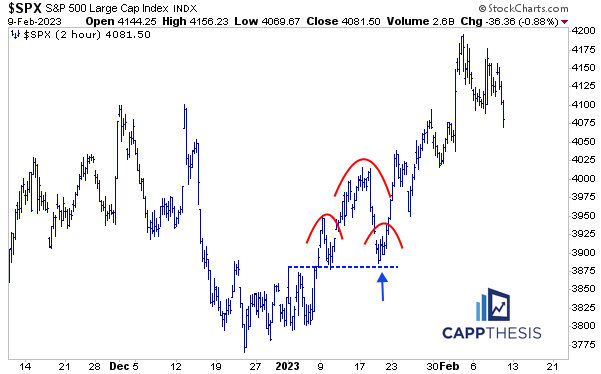
In fact, the last SUCCESSFUL bearish pattern took place from late September through early October, so the bears have some work to do.
US Dollar & 10 Year Yield
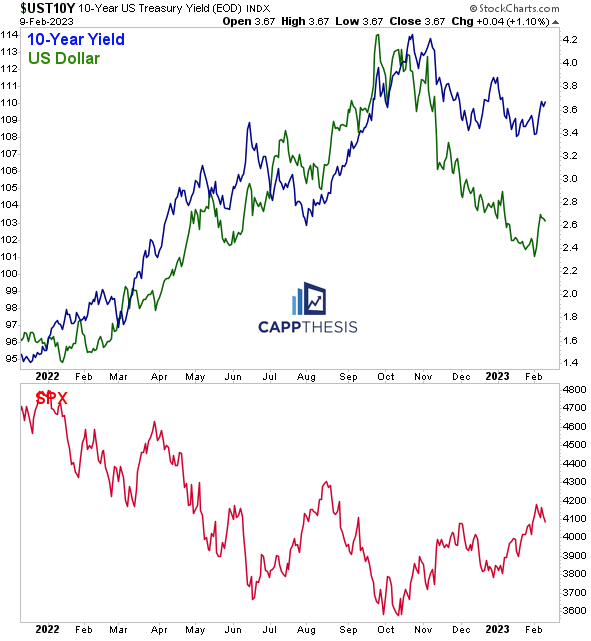
That didn’t happen by coincidence, of course. The Dollar topped back then, as did the 10-Year Yield a few weeks later. And with both moving higher so far in February, it’s not surprising to see the SPX sputter.
It’s a simple correlation, but it’s defined the risk assets space for over a year, thus, it remains the single-most important relationship.
If the Yield and Dollar start to log higher lows, we’ll then be able to identify bullish formations, which could have an adverse effect on the SPX…
Pre-Market
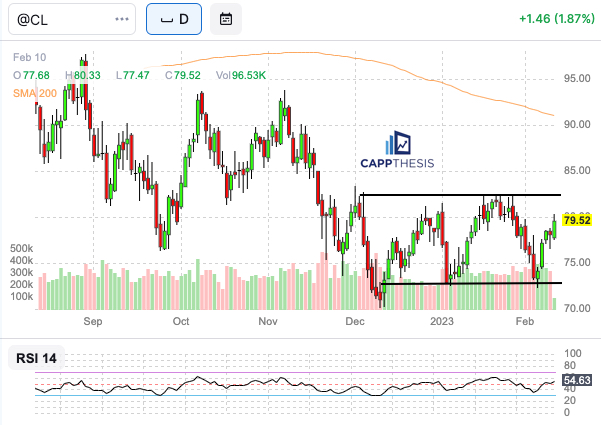
Crude Oil
Potentially higher for the fourth time in five days this week. Crude has proven it can bounce at support, with the next obvious step being to garner demand near resistance in the low 80s.
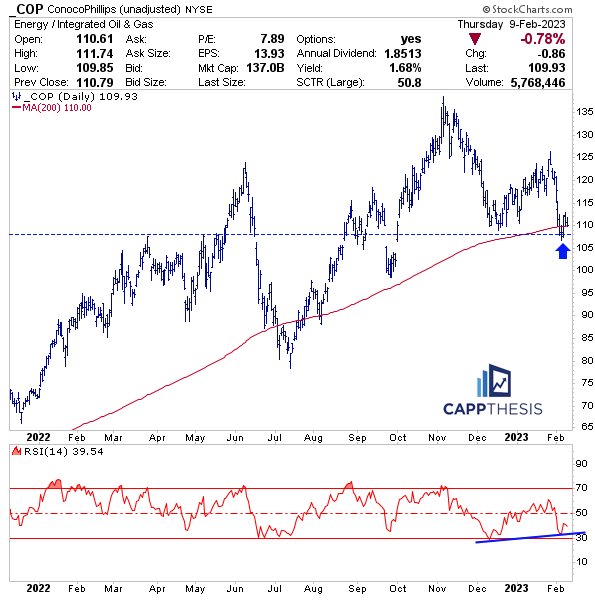
COP
Post-earnings, COP has been flirting with an important support level and its 200-Day Moving Average. Its 14-Day RSI made a higher low as the stock made a lower low, which has produced a positive momentum divergence. This is a potentially bullish sign for a name that remains in a long-term uptrend.
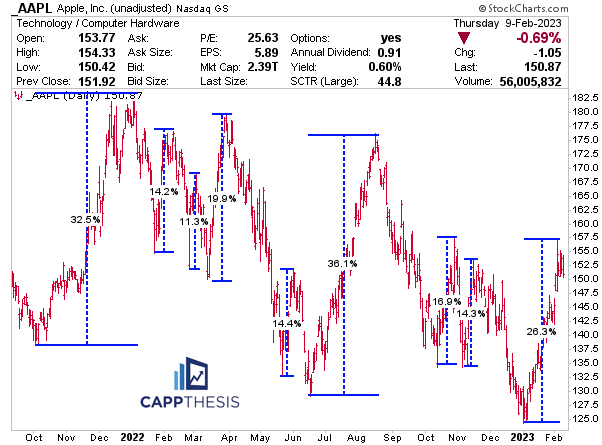
AAPL
AAPL is coming off a sizable +26% rally, its ninth extension of at least +10% since late 2021. Each of the prior eight were followed by sharp downside moves. To change that behavior now, a higher low would be a necessity.