Key Points:
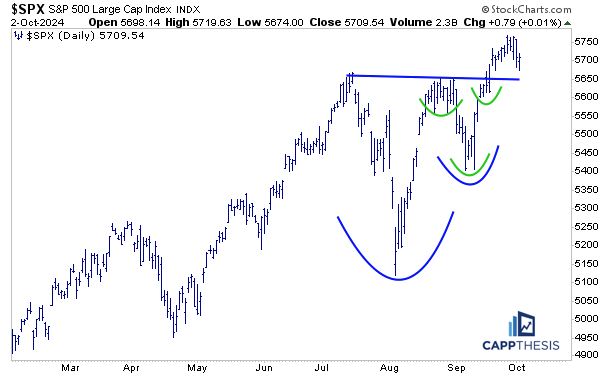
1- The SPX remains above its most recent pattern breakout zone (5,650), having moved sideways over the last two weeks.
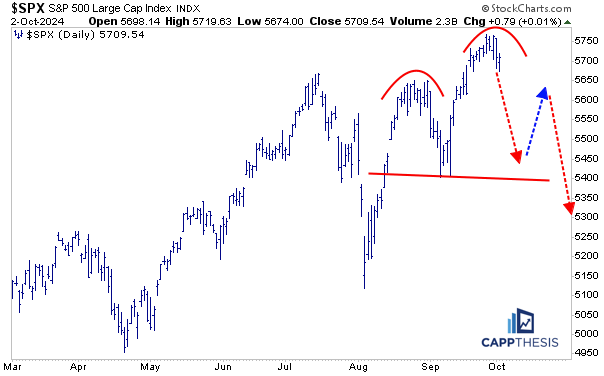
2- The index’s biggest drawdowns all happened as the index cut through key uptrend lines. It’s getting close to testing another line now, stemming from the August lows.
Topics Covered:
Market
-Intra-day
-The biggest breakouts
-The biggest drawdowns
-MACD
-Live patterns
-Potential patterns
-AVWAP
Daily Stats
-Daily price action
-Index breadth
-Sector performance
-Best & worst ETFs
Key Charts
-WEAT Wheat
-LIT Lithium
-NDX
Intra-Day
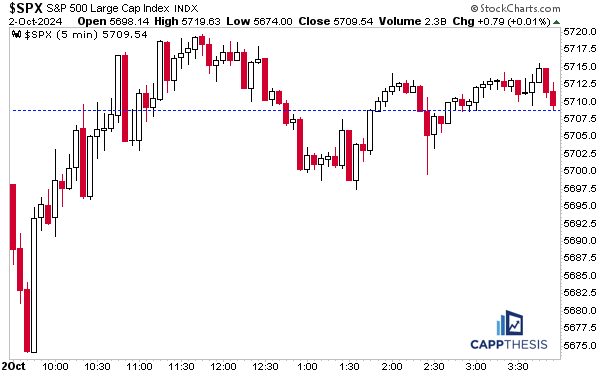
The SPX utilized a strong morning rally to notch the smallest of advances yesterday (+0.13%). It’s now the first time in three months that the index has not started a month with a losing streak… not that the negligible up-move is anything to brag about. Overall, it was the ninth straight absolute move less than 1%, as the quiet trading continued.
The Biggest Breakouts
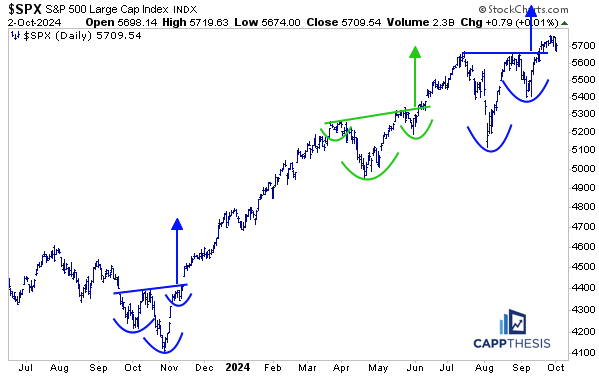
Needless to say, not much changed from a technical perspective after yesterday’s non-movement. And with the price action having noticeably slowed ever since the breakout to new highs on 9/19, momentum has stalled, too.
Again, this isn’t a negative, at least not yet. Two weeks ago, we talked about the potential next phase – one of lower two-way volatility. We pointed to the November’23 and May’24 periods as recent examples: calmer, consistent price action followed big pattern breakouts.
The Biggest Drawdowns
That said, it IS October, thus, there’s another very important angle to consider…
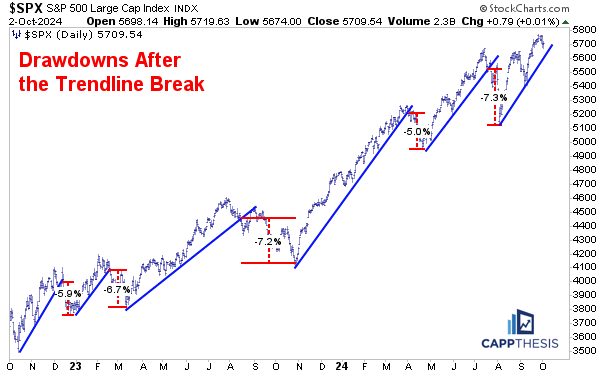
With the SPX simply moving sideways the last two weeks, it’s quietly crept closer to the uptrend line that connects the August and September lows. Since the October’22 low, it’s clear that the biggest drawdowns all happened as the index cut through key uptrend lines. We’ve shown this chart before, and it’s a significant one to keep in the back of our minds again now.
This is more useful than a chart showing the total peak-to-trough declines because there’s no way to know when any particular high point is the actual peak… until after the fact.
As is clear, most of the downside action happened after the trendline breaks over the last two years, thus, it makes sense to wait for the breach. This approach would have kept us in the longest runs in the spring’23 and from November’23 – March’24… while allowing us to get out before the larger part of the decline took hold.
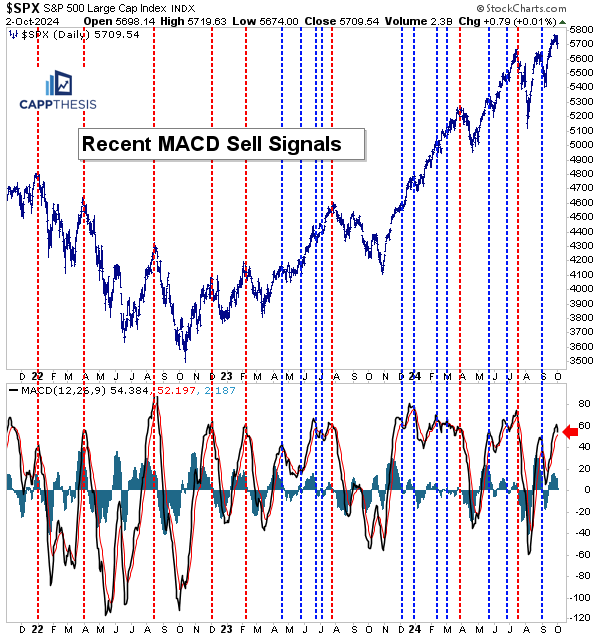
MACD & Drawdowns
We’ve discussed how most MACD sell signals have not worked well since spring’23. However, the times that they have worked all coincided with the SPX breaking below the uptrend lines mentioned above. As the red arrow below depicts, we’re very close to getting another sell signal now simply because momentum has slowed from the strong mid-September pace.
Translation: a trendline break combined with a MACD sell signal triggering would be a bearish short-term set up.
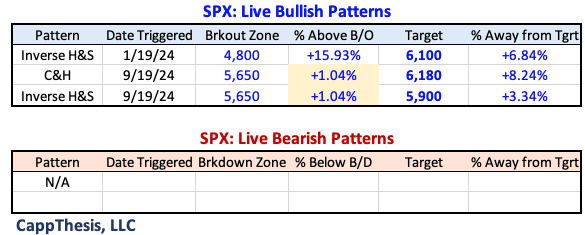
Live Patterns
And if all of that happens, then the 5,650-breakout zone (of the two bullish patterns) would be at risk.
Potential Patterns
Let’s continue to watch this potential bearish scenario.
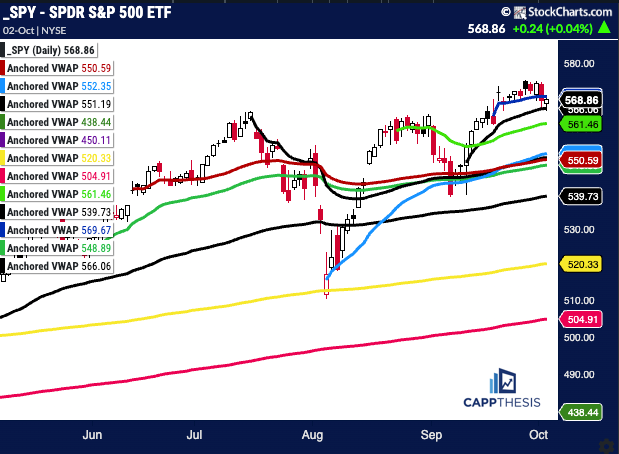
SPY AVWAP
SPY remains slightly below the 9/18/24 VWAP line and above the line anchored to the CPI/positive reversal day on 9/12.
Blue: 9/18/24 – Fed cuts rates 50 bps
SPY
Black: 9/12/25 – CPI, positive reversal
Light Green: 8/22/24 – Bearish engulfing pattern
Red: 6/12/24 – CPI/FOMC
Black: 7/16/24 – July’24 high
Green: 5/31/24 – Pivot low
Black: 4/19/24 low
Light Blue: 8/5/24 – Pivot low
Yellow: 1/2/24 – YTD VWAP
Pink: 10/27/23 – October’23 low
Purple: 1/4/22 – 2022 high
Green: 10/13/22 – 2022 low
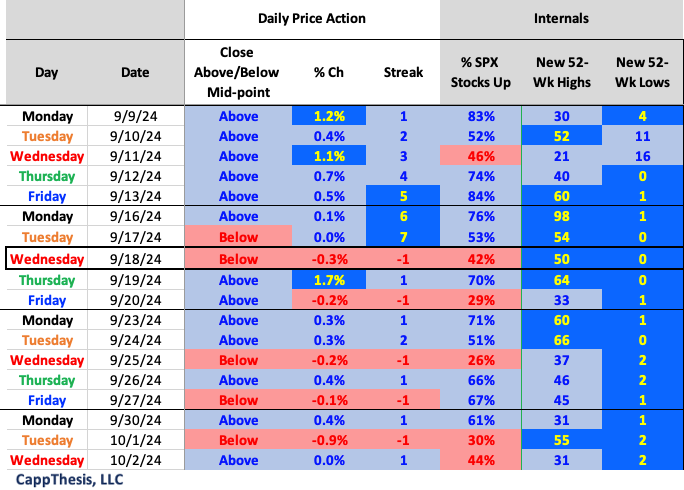
Daily Price Action
The SPX now has had two straight negative breadth days for the first time since four in a row to start September.
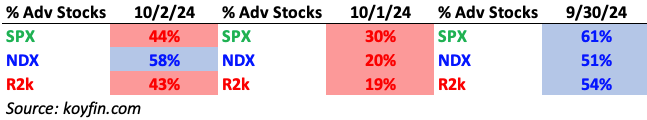
Breadth
Yesterday, the NDX had the best internals vs. the SPX and R2k for the first time since 9/26.
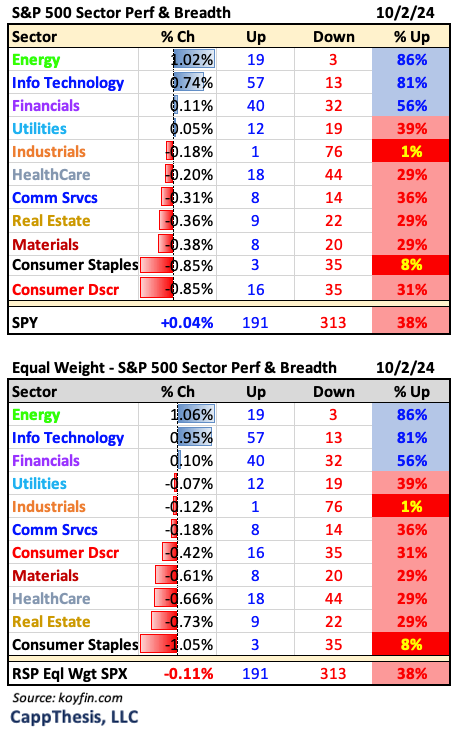
Sector ETFs
Energy, Tech and Financials all had positive breadth on Wednesday.
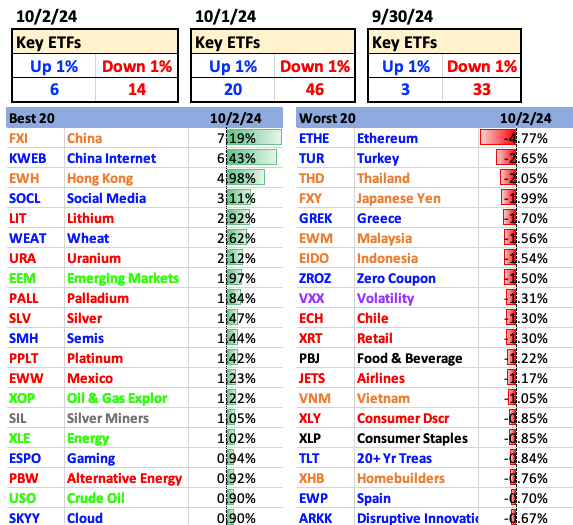
Best and Worst 20 ETFs
China and commodities led again yesterday.
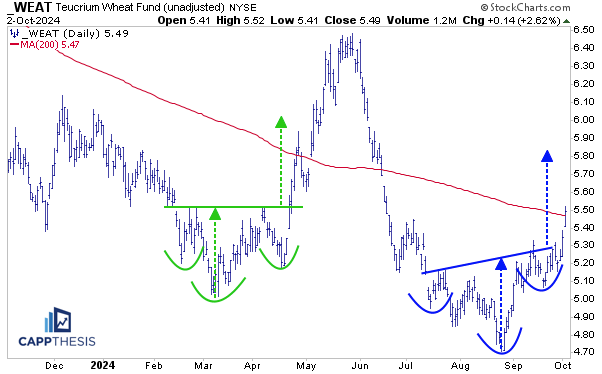
WEAT – Wheat ETF
WEAT was one of the biggest movers yesterday (after the China and Hong Kong ETFs), as it continues to extend from the pattern breakout we recently referenced.
The ETF now is +16% from its late-August low and trading above its 200-dma for the first time since mid-June. It spent about six weeks above the line from May-June overall, but ultimately failed to hold the line. It’s struggled near the 200-day since undercutting it in June’22, thus, it must prove it can do a better job this time.
We won’t know if it will be any better for a while, but the commodity’s consistent upswing from mid-2020 through mid-2022 was a clear inflation gauge, thus, we should watch it closely.
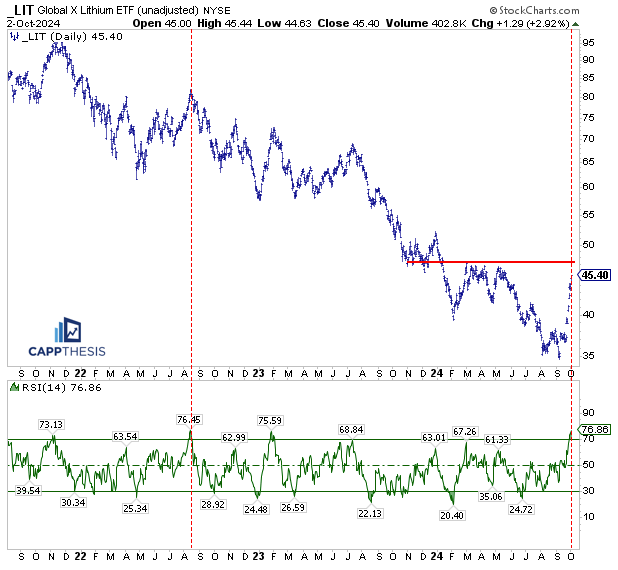
LIT Lithium
LIT also was among the leaders yesterday and now is sporting a 14-day RSI of 76, which is the highest since Aug 15’22… the top of a bear market rally back then. The difference this time, of course, is that the spike to get the ETF this stretched has been much more severe.
That said, it still hasn’t made a dent in the long-term downtrend. For that to change any time soon, LIT must get through the 47-48 level at some point. Best-case scenario is that this happens after it forms a bullish pattern. It’s all about how the next pullback is dealt with now.
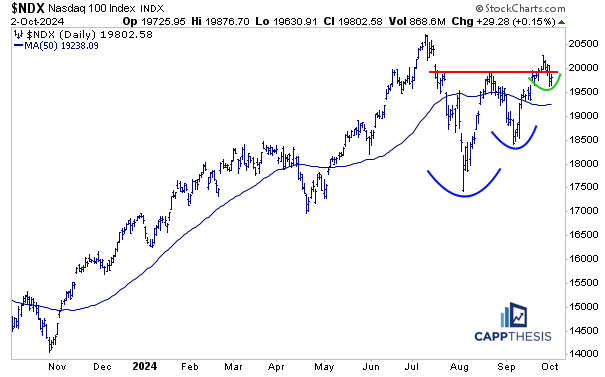
NDX
While the SPX has remained above its most recent breakout zone, the NDX has undercut its. The next test is seeing how well it fares above the 50-DMA, which it has struggled to remain atop for an extended period of time since undercutting it in mid-July.