Key Points:
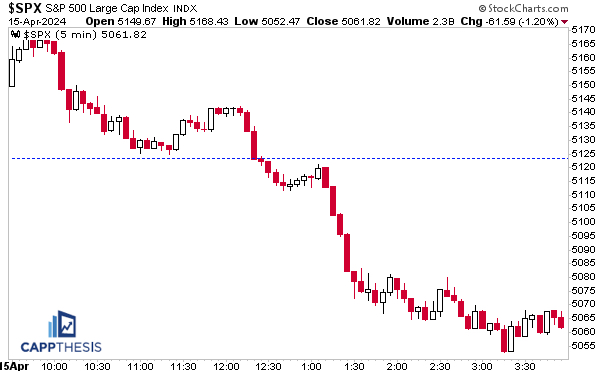
1-The SPX followed Friday’s 1.5% decline with a 1.2% loss on Monday – the first back-to-back 1% down moves since 10/25-10/26/23. More below.
2– The index’s bearish pattern was triggered yesterday. The downside target is 4,944.
3– The SPX now has had four straight negative breadth sessions. It hasn’t had more than four since before the October low point.
Topics Covered:
Market
-Consecutive 1% declines
-SPX 5,000
-Retracement
-Market Strength Indicator
-Short-term
-New bearish pattern
-Patterns
-AVWAP
Stats
-Daily price action
-Index breadth
-Sector performance
-Best & worst ETFs
Key Charts
-NDX
-USO
-ARKK
-XLI, XLC
SPX:
The SPX followed Friday’s 1.5% decline with a 1.2% loss on Monday – the first back-to-back 1% down moves since 10/25-10/26/23. After the opening gap up was sold, buyers stayed on the sidelines the rest of the day.
Another First
Digging deeper, it’s clear that consecutive 1% losses not only have been missing since October – but the polar opposite has been occurring. Each of the last five 1% declines were immediately followed by a 1% gain.
After the March 5th one percent sell-off, we had to wait an extra day for a 1% advance on March 7th. But on March 6th, the SPX still was up 50bps.
Not this time…
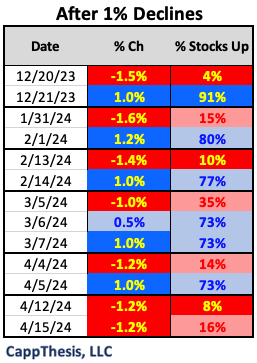
Thus, it’s now the third 1% loss of April at the half-way mark of the month. Needless to say, the year’s fourth month is standing out for the wrong reasons.
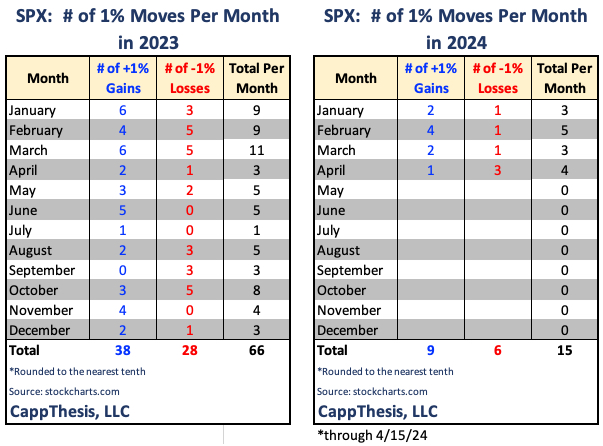
We often talk about how the market notably changed in April’23: the number of absolute 1% moves fell off a cliff as the second quarter commenced a year ago. The market was coming back from the regional bank crisis, but it also was just a few months removed from the October’22 low, thus, two-way volatility still was evident…
In essence, then, the market enjoyed an entire 12 months of low two-way vol through this past March. October of last year was the only month that had more than five +/-1% moves.
Indeed, April’24 could end up being an aberration as well, but with it happening after the spotless five-month advance, we need to be prepared for any outcome.
SPX 5,000
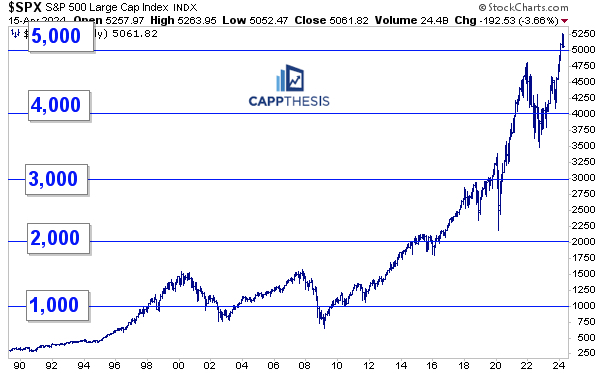
Back when the SPX first crossed 5,000 in February, we opined that the odds were high that the level would get revisited at some point (in the piece entitled “Milestones” from 2/8/24). Why? The index eventually undercut each of the prior 1,000 levels after first closing above them.
Here’s an excerpt:
“The first push above 5k has a high probability of being revisited if history is any guide. Indeed, we could see a big move higher first, but the market has dropped back under each prior key thousand-point threshold, even though the sample size is understandably small.
It may take a few months before a retracement brings the index back down to 5k – like we saw from 2019-2020 around SPX 4,000…
Or it may take a lot longer.
The SPX first hit the 2k mark in August 2014, but the push through 2k in late June 2016 was the real breakout. By then, the market had gone through nearly two years of volatility, and no one seemed to care by the simple close above 2,000 when it actually mattered. We were more concerned with Brexit.”
Could another bid arrive soon, keeping the SPX above 5,000 for a lot longer? Yes, of course. Overall, the price level, itself, doesn’t matter. It’s all about seeing how the market can take a punch.
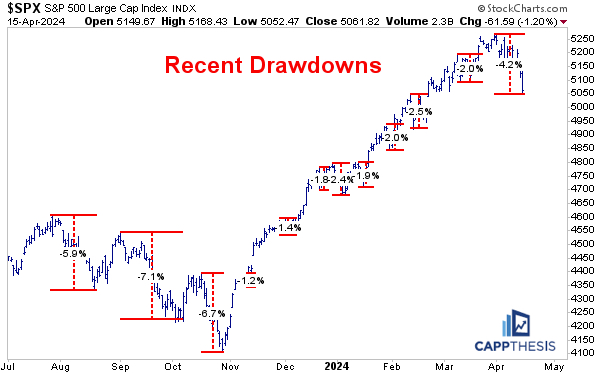
Drawdowns & Retracements
As of now, the total drawdown has grown to 4.2%, which extended the biggest pullback of this run.
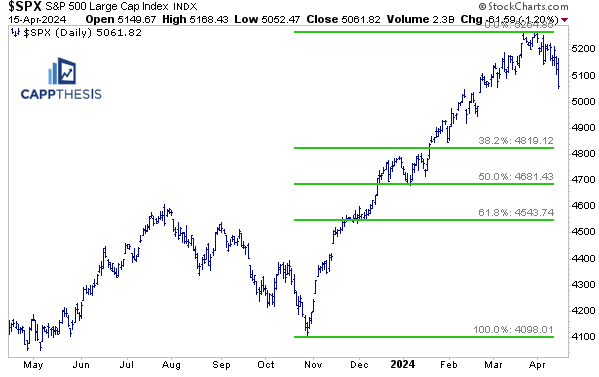
The SPX’s 38.2% retracement of the October-March advance is at 4,819. It would take an additional drop of 4.7% from current levels to get there.
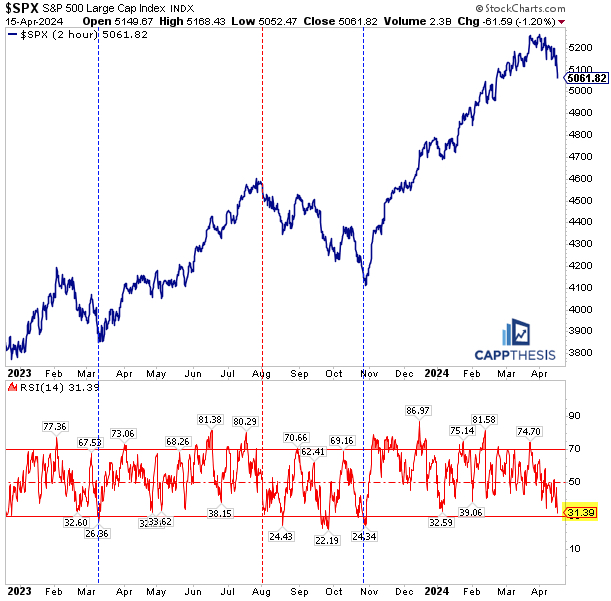
Short-term RSI
The SPX’s 14-period RSI on the two-hour chart finished yesterday at 31… just barely above oversold territory. Any additional weakness would push this down to oversold territory for the first time since October…
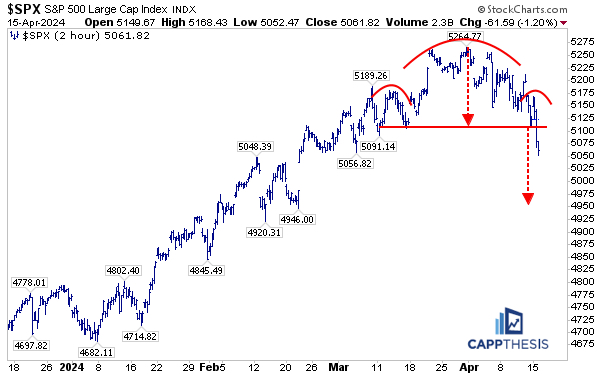
Patterns
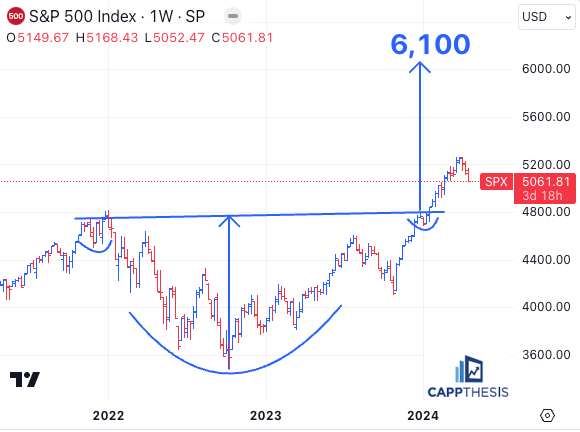
The SPX’s bearish pattern isn’t perfect, but the general shape is clear. And yesterday’s decline triggered a downside target of 4,944. As the table shows, that’s only 2.4% away, but hitting it would be a potentially significant step given that all past bearish patterns have failed up to this point.
Thus, we now have two live patterns – one bearish and bullish. This doesn’t happen often…
This time is a bit different given that we’re talking about a multi-MONTH bullish pattern and a multi-DAY bearish formation.
The silver lining to all of this is that the market now is utilizing the cushion that it spent time building since last fall. The SPX could hit the bearish target, drop another 5% from here, undercut 5k and fall all the way back to 4,800 and the 6,100 target will remain in place…

SPY AVWAP
Next VWAP support is the line anchored to the start of 2024 – a big one.
Red: 3/20/24 – FOMC
Light Blue: 4/4/24 –negative reversal
Blue: 4/10/24 – CPI
Light Purple: 2/13/24 – CPI
Light Blue: 1/31/24 – FOMC
SPY
Yellow: 1/2/24 – YTD VWAP
Pink: 10/27/23 – October’23 low
Black: 8/18/23 – August low
Light Green 3/13/23 – March Low
Purple: 1/4/22 – 2022 high
Green: 10/13/22 – 2022 low

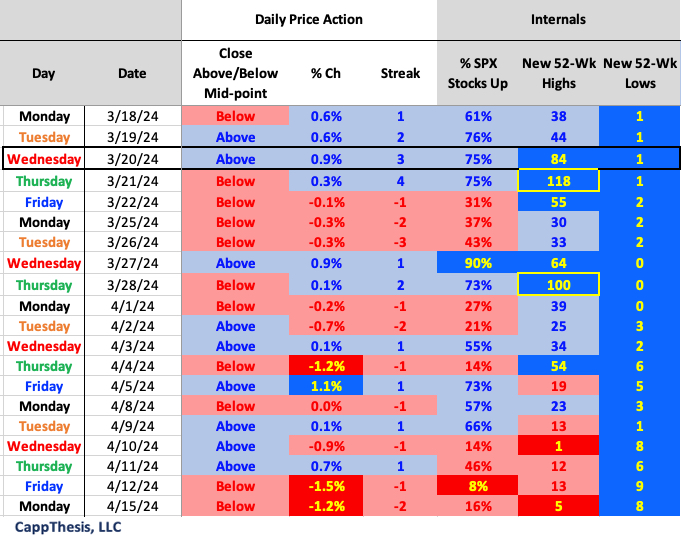
Daily Price Action
The SPX now has had four straight negative breadth sessions. It hasn’t had more than four since before the October low point.
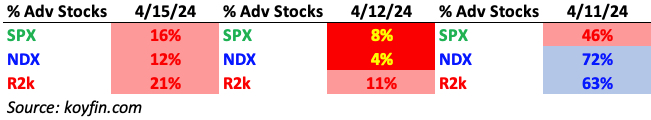
Breadth
Adv-dec ratios were bad yesterday but not extreme like Friday.
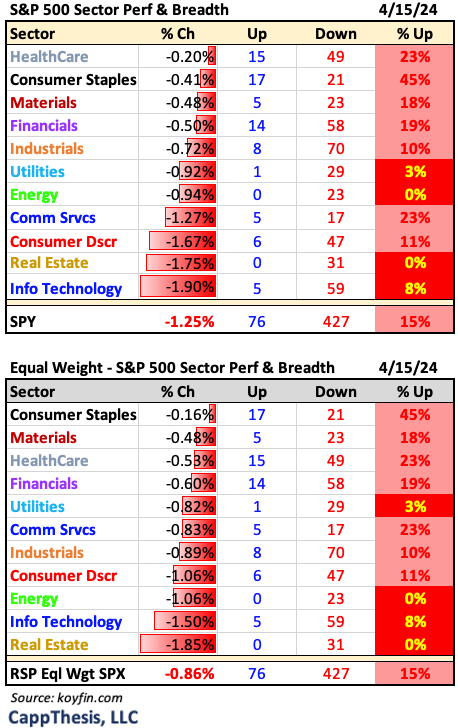
Sector ETFs
Consumer Staples had the best breadth by far with 45% stocks up.
Best and Worst 20 ETFs
Only Silver, Gold and VIX ETFs were up 1% on Monday.

NDX
The NDX also fell over 1% for the second straight day. Its last breakout zone (and former highs) is near 16,800.

The 38.2% retracement level is just under that at 16,775.
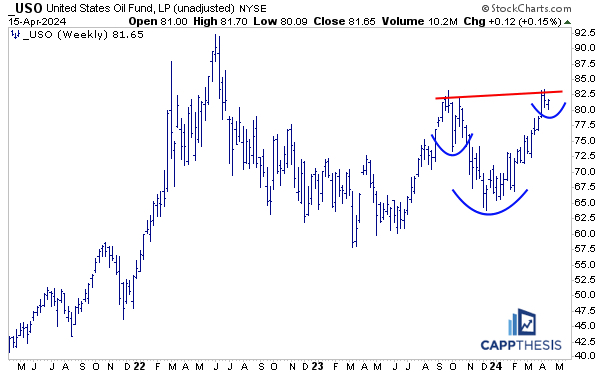
USO Crude Oil
While Crude Oil remains below the 2023 highs, the ETF tied to it – USO – has been testing its September’23 high point the last few weeks. And the recent sideways movement around that zone has started to form the right shoulder of a potential very large inverse H&S pattern.
This could take some time to play out as said right shoulder is pretty shallow, but we should pay attention to it. If it plays out, it will tell us that traders believe that crude oil, the commodity, eventually will do the same.
ARKK
ARRK endured its worst decline yesterday since 2/13/24 and its second worst since 10/24/23. This pulled the ETF all the way back to 44, which has been a very important technical zone going all the way back to late 2022. ARKK has managed to stay clear of this area since ripping back above it in November. If it can’t bounce back like it did earlier this year, then the last few months of action will resemble a big topping pattern.

XLI & XLC
XLI and XLC have been among the sector leaders much of the time since the 2023 lows. We should watch them closely now since both closed right on their respective 50-day moving averages on Monday… as XLK, NDX and SPX all closed below their respective lines.
Overall, five sector ETFs remain above their 50-day lines: XLE, XLB, XLU, XLI and XLC.


