
Key Points
The SPX paused after the powerful four-day advance, slipping just 0.2% yesterday. Despite the modest pullback, the bullish patterns remain intact, as does the market’s short-term stretched condition. Today we’ll highlight just how rare the recent four-day rally has been from one particular angle, and then spend time discussing DJIA, SMH and Metals.
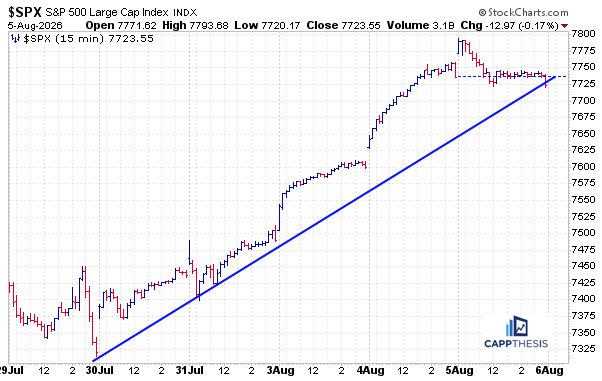
Daily Price Action
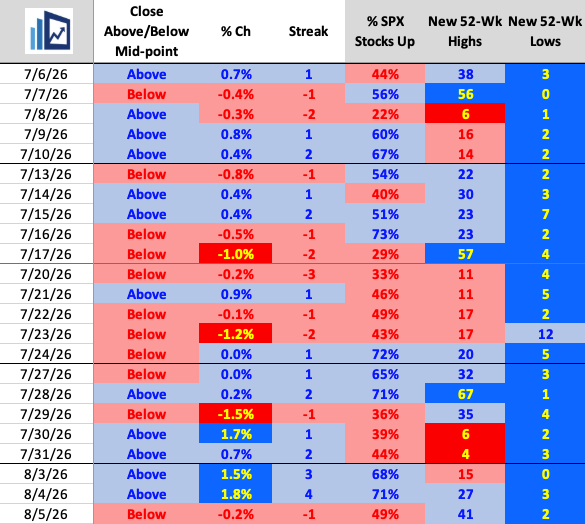
A small pause after a three gains of at least 1.5% over the previous four sessions was not a surprise. Breadth remained respectable, with just under half of the SPX components advancing.
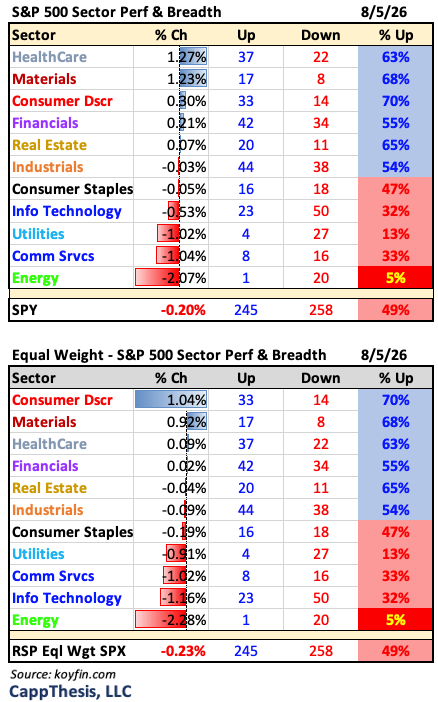
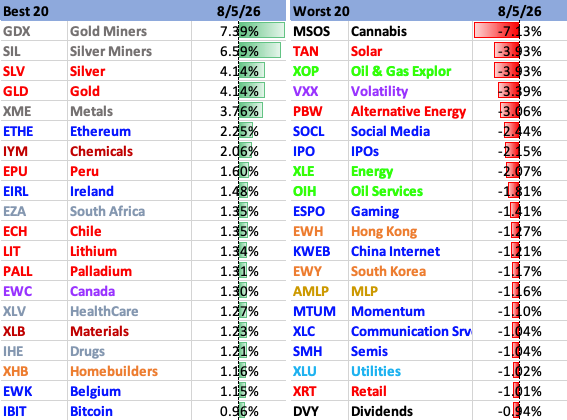
Leadership also stayed broad, with Healthcare and Materials leading the market yesterday, while six of the 11 S&P sectors finished higher. Precious metals continued to stand out as the strongest-performing group overall.

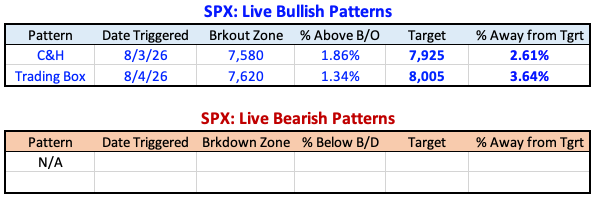
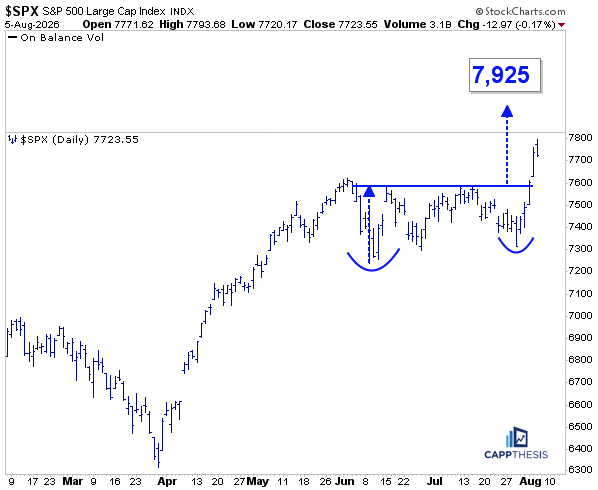
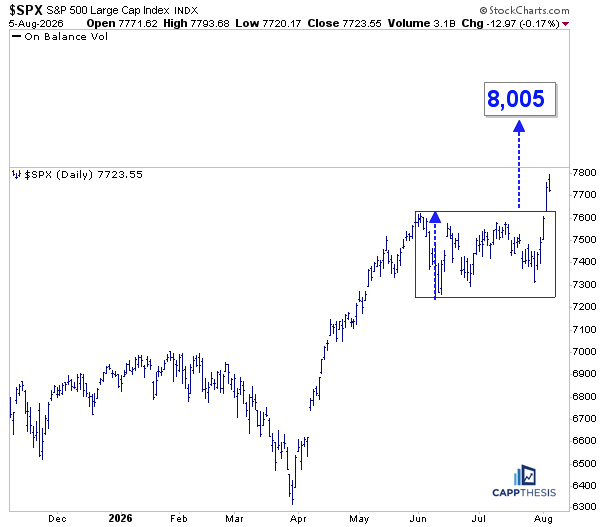
Yesterday’s price action did little to alter the technical picture after a volatile stretch that saw multiple breakouts, targets achieved, bearish patterns negated, and new bullish breakouts triggered. As a result, both upside targets of 7,925 and 8,005 remain in play.
Bollinger Bands
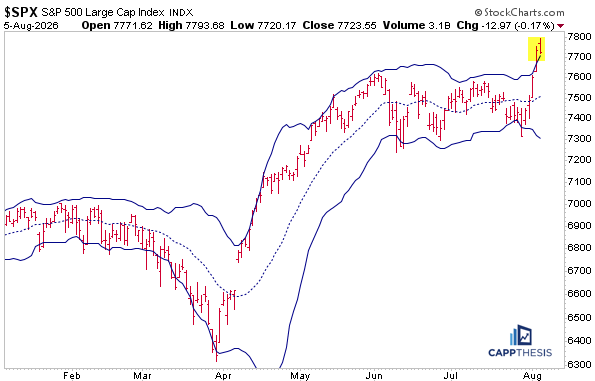
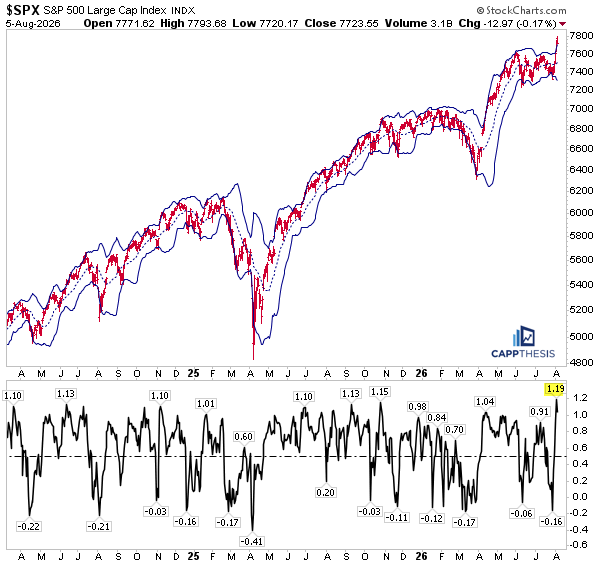
As we know, the SPX’s exceptionally strong 4-day move happened after several weeks of very compressed price action, with relatively limited movement in either direction.
As a result, the Bollinger Bands noticeably had narrowed compared to where they were a few months ago. Thus, with the sudden buying thrust, the SPX easily punched through the upper threshold – by a lot.
By contrast, the sharp rallies in both April’26 and April’25 occurred after periods of much greater volatility and downside pressure. Thus, the bands had considerably widened as selloffs picked up steam.
So, even though the initial, sharp advances the last two Aprils were larger and extended for weeks, the bands weren’t much of a factor for a while… particularly during the spring 2025 advance.
The SPX finished yesterday above the upper band for the second straight session. Bollinger Bands will likely take some time to widen again, which already has begun. Eventually we should expect the SPX to move back inside them as volatility normalizes again and the market digests this short-term pop. (h/t BB)
%B – Fourth Highest Reading in over 15 Years
Another way to quantify just how unusual this move has become is with the %B indicator, which measures where price sits relative to its Bollinger Bands.
A reading of 0 means price is at the lower band, 0.5 is near the middle, and 1.0 is at the upper band. Readings above 1.0 mean price has pushed beyond the upper band, signaling unusually strong upside momentum.
As of Tuesday’s close, the SPX reached a %B reading of 1.19. That may not sound alarming, but it actually was the fourth-highest reading since 2012. This doesn’t guarantee an immediate pullback, but it does reinforce how pronounced the pop was, especially relative to quiet trading environment over the prior few months.
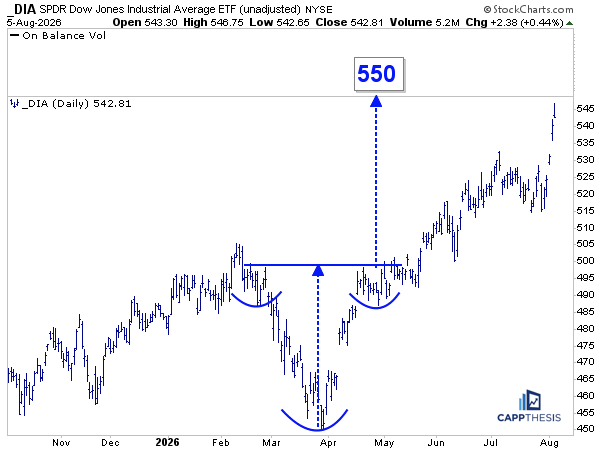
DIA DJIA ETF
The DIA continued its recent outperformance, gaining 0.44% yesterday despite closing near its intraday low. Thus, it got even closer to achieving the upside target from the inverse head-and-shoulders breakout triggered in May.
The objective may not be reached immediately after such a strong advance the last few days, but the consistency of the rally over the last few months has been notable, underscoring the DJIA’s leadership versus both the SPX and the NDX.
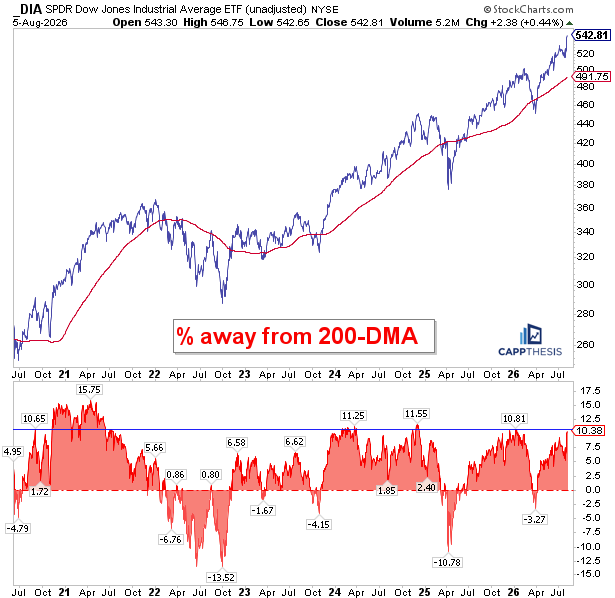
DIA vs. 200-DMA
As of last night’s close, DIA is now more than 10% above its 200-day moving average. Over the last six years, that has been one of the largest extensions above the long-term line, with the gap peaking at roughly 11% in 2024 and again in late 2025.
History suggests this doesn’t necessarily lead to an immediate pullback. In early 2024, the Dow continued to advance, although the pace eventually slowed, allowing the 200-day moving average to catch up. Following the COVID rally, the index became even more extended, reaching 15% above the 200-DMA and remaining there for several months.
The takeaway is not to expect the Dow’s recent pace to continue indefinitely. The ideal scenario would be a period of consolidation, allowing the 200-DMA get closer, while the Dow digests its gains and potentially forms another bullish pattern.
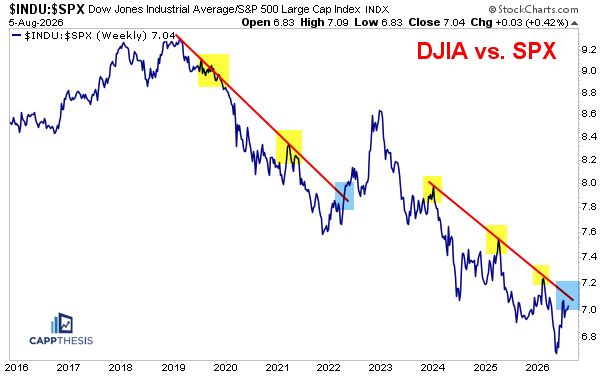
DJIA vs. SPX
Needless to say, the DJIA/SPX relative line has enjoyed a sharp rebound over the last few months and is now approaching a key downtrend line that has been in place since 2024. As the chart shows, we’ve seen multiple periods of DJIA outperformance over the past several years, but each ultimately faded at this same relative resistance line.
The current setup looks very similar to the 2019 through early 2022 period, when several relative rallies were eventually snuffed out. The notable exception was late 2021 through early 2023, when the Dow’s relative strength broke out meaningfully during the broader bear market.
The key question now is whether this relative line can finally break out again. The caveat, of course, is that the last sustained period of Dow outperformance occurred in a much weaker overall market environment in 2022.
Since this ratio is essentially a comparison of more defensive, non-growth exposure (DJIA) versus the more growth- and technology-heavy SPX, continued DJIA leadership could suggest that investors are again favoring defense over growth—a backdrop that has historically accompanied more challenging markets.
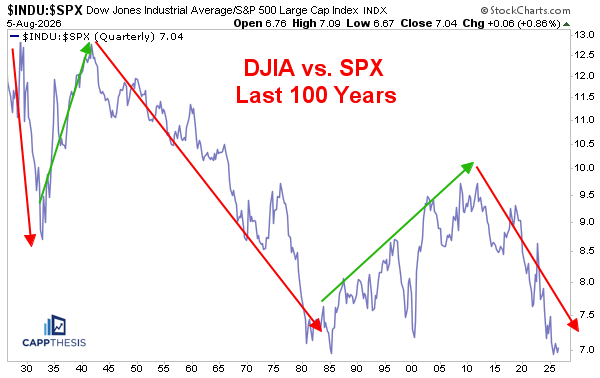
Zooming out, it’s interesting to see how this relative relationship has evolved over the last century. While there have been extended periods of Dow outperformance—sometimes lasting years or even decades—the longer-term trend has generally favored the S&P 500.
The ratio bottomed in 1985 and ultimately peaked in 2008. During that period, the late-1990s technology bubble produced a sharp bout of Dow underperformance. On a 100-year chart, that appears as little more than a blip, but it serves as a reminder that meaningful shifts in relative leadership can occur even within much larger secular trends.
Since 2011, however, the Dow has once again underperformed the S&P 500 by a wide margin, underscoring the long-term dominance of growth- and technology-oriented stocks.
Lastly, before bouncing the last few months, the ratio had gotten back to its 1985 low point, which is long-term support until proven otherwise.
SMH Semis
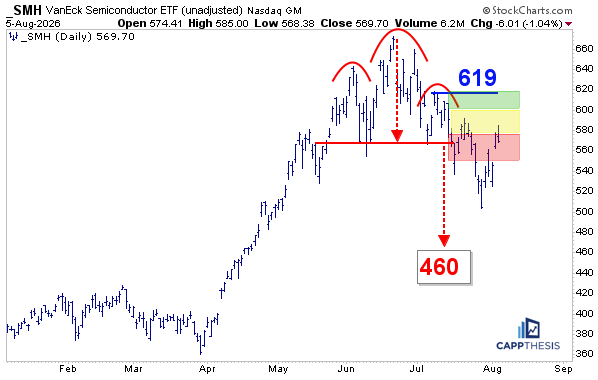
With SMH’s negative reversal and 1% decline yesterday, the ETF slipped back into the red, high-risk zone of the bearish pattern we’ve been tracking. As the chart shows, since breaking down in mid-July, it has spent most of its time either in that red zone or below it, reinforcing the idea that the bearish pattern remains intact.
GLD Gold
Precious metals posted one of their strongest advances in quite some time, materially improving the technical outlook for both gold and silver.
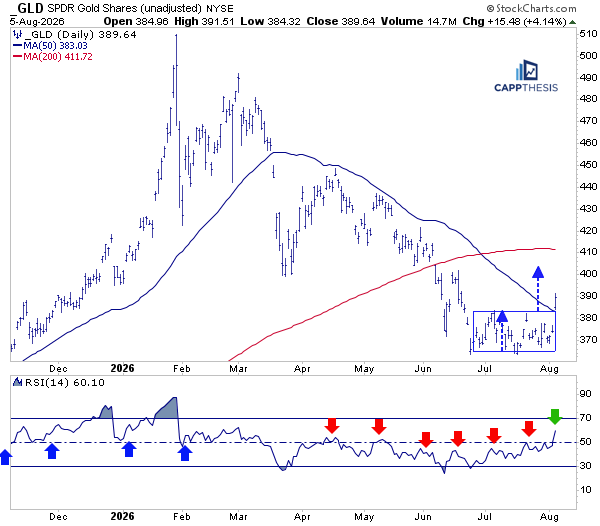
Starting with GLD, the past few weeks can now be viewed as one large trading box. Yesterday’s breakout projects a measured move target above 400. Just as importantly, GLD closed decisively above its 50-DMA for the first time since breaking below it in March.
As we’ve discussed repeatedly, that declining 50-DMA had acted as key resistance, turning back rally attempts in April and May, before the subsequent decline carried prices well below the line.
Momentum has improved, as well. The recent rally has lifted the 14-day RSI to around 60, its highest reading since earlier this year. Previous rally attempts faded before RSI could move much beyond the 50 mid-point, making this a meaningful change in character.
The next objective is to build on this breakout. Holding above the former trading box and forming another bullish continuation pattern would set the stage for a challenge of the 200-day line near 411. That is now the next important level to watch.
GLD Gold GoNoGo
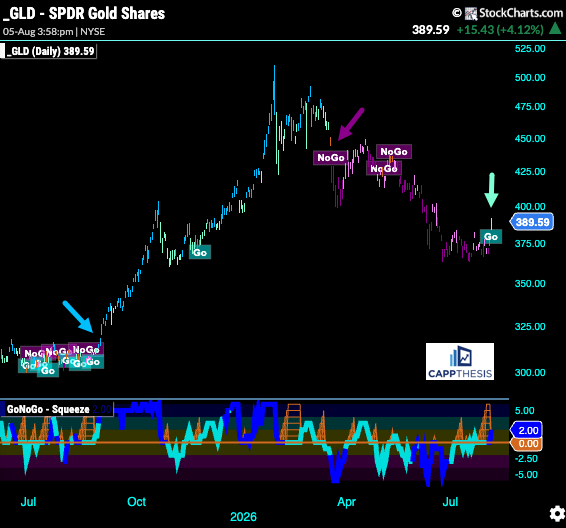
The rally over the last few days has also triggered a new Go signal in the GoNoGo indicator. The last time GLD entered Go Mode was mid-March, just before the recent corrective phase began.
Also worth noting is what happened last year. After several months of choppy, back-and-forth trading through the spring and summer, GLD finally broke out in late August. From there, the GoNoGo indicator remained in Go or Neutral Mode all the way into March’26, accompanying a sustained advance.
One day doesn’t make a trend, but it can mark the beginning of one…
SLV Silver
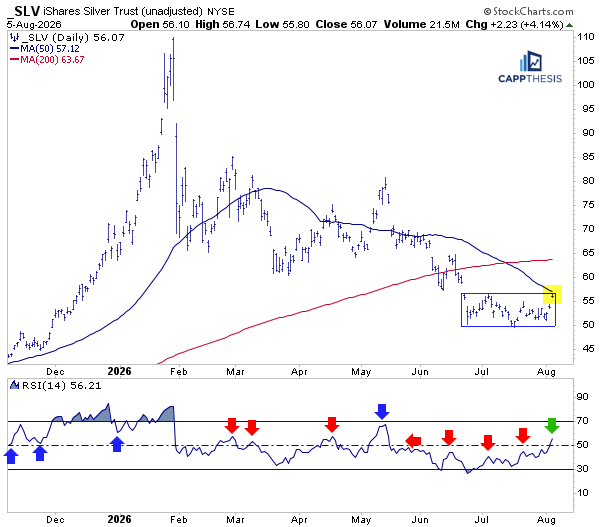
SLV Silver has followed a path similar to gold, although it still has more work to do. Unlike GLD, which decisively reclaimed its 50-day moving average, SLV closed yesterday right at the line, making it the next important hurdle to clear.
Momentum has improved, as well, with the 14-day RSI climbing back above 50 for the first time since May. The next objective is to build on this developing base, hold above it, and work back toward the 200-day moving average, which has remained overhead for the past several weeks.
SLV Silver GoNoGo
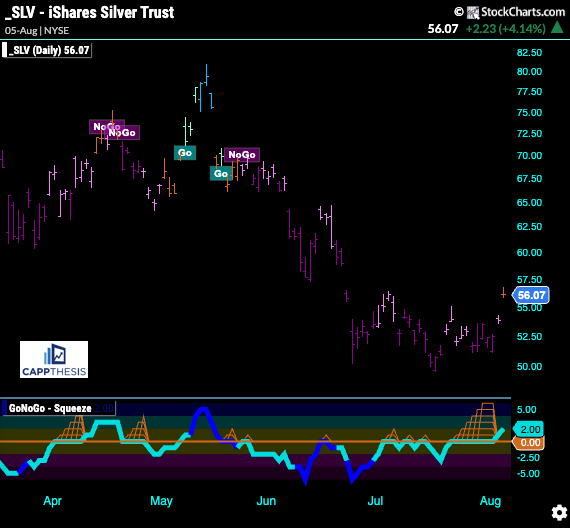
The GoNoGo indicator has not yet fully returned to Go Mode for SLV, so additional follow-through is still needed. That said, yesterday’s rally did improve the picture, with the indicator shifting from NoGo to Neutral.
DELL (Dell Technologies)
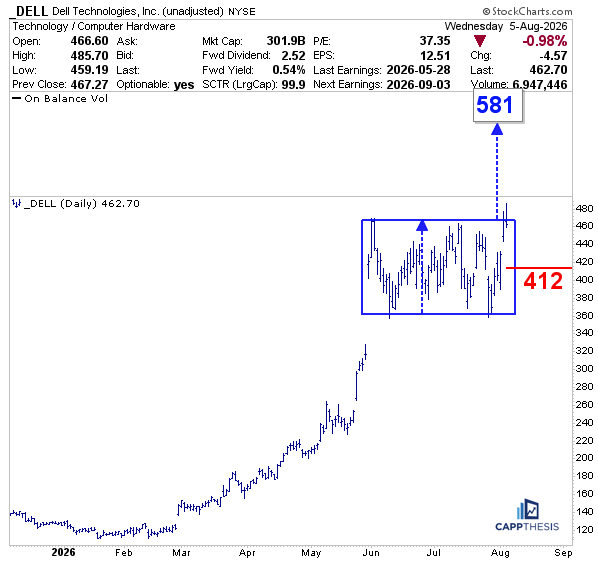
As we know, DELL enjoyed an incredible run earlier in the year, rallying more than 300% in just a few months. Since late May, it has been digesting that advance, which is a healthy development after such a powerful move.
While the price action has been somewhat erratic, the stock has remained above most of its earnings-induced gap from May, keeping the potential for a bullish continuation pattern intact.
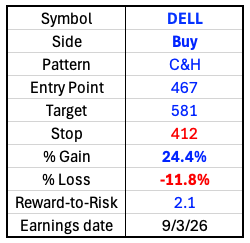
This setup is very similar to HPE, another Chart Trade idea from late July that has recently begun to show signs of breaking out. Although DELL closed near its lows yesterday, as did many stocks and ETFs, a move back above the 467-breakout zone would put the pattern back in play.
That would establish an upside target near 581, with a stop-loss around 412, near the midpoint of the current trading box.
Watch list: CVBF, GEN, ORKA, RVTY