Key Points:
1- From the August 5th low through yesterday’s peak, the SPX gained approximately 9.9%. That’s the sharpest of any multi-week rally we’ve seen yet.
2- There’s been one key difference in the short-term work since April though – we’ve started to see oversold readings on the ensuing pullbacks.
Topics Covered:
Market
-Intra-day
-Short-term
-Retracements
-Indicators
-Live patterns
-Potential patterns
-AVWAP
Daily Stats
-Daily price action
-Index breadth
-Sector performance
-Best & worst ETFs
Key Charts
-XLP (2)
-SMH
-XLE
Intra-Day
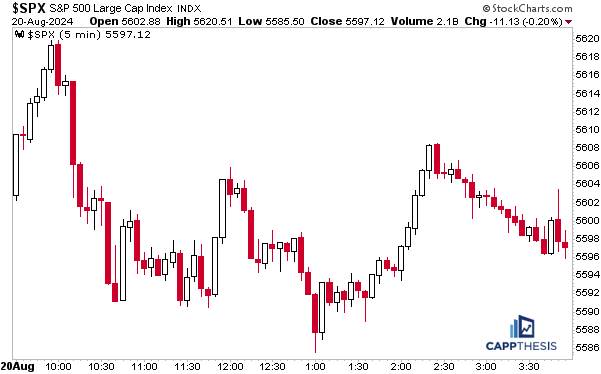
The winning streak was destined to end, and it did yesterday. The question, of course, is what happens next.
Short-Term
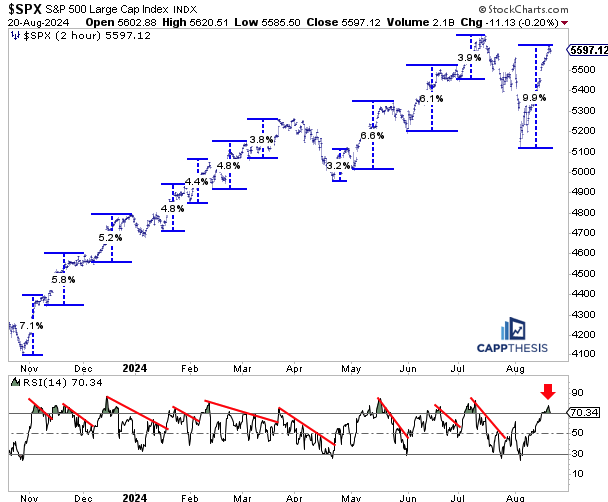
Let’s start with the short-term. From the August 5th low through yesterday’s peak, the SPX gained approximately 9.9%. That’s the sharpest of any multi-week rally we’ve seen yet. Prior to that, the best run was +7.1% from the very beginning.
Again, we’re focusing on the very short-term here, taking note of every turn and pause. As we know, said pauses in those first few months were extremely shallow.
That said, the behavior has persisted. Nearly every rally produced an overbought condition on the two-hour chart, which is bullish. But said condition can only last for so long, even from this viewpoint.
There’s been one key difference in the short-term work since April though – we’ve started to see oversold readings on the ensuing pullbacks. It happened in April, June, July and August. From this angle, it’s clear that volatility has been elevated since the second quarter started, which we should expect to continue.
Retracements
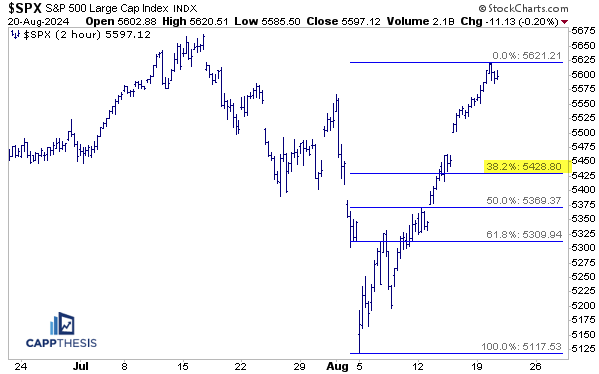
Here’s how the drawdowns in 2024 have played out thus far. Again, we’re looking at each and every pause along the way… Since we haven’t seen any sort of slowdown in two weeks now, it’s a good reminder of how things looked in both the calmest scenarios and the more raucous periods this year.
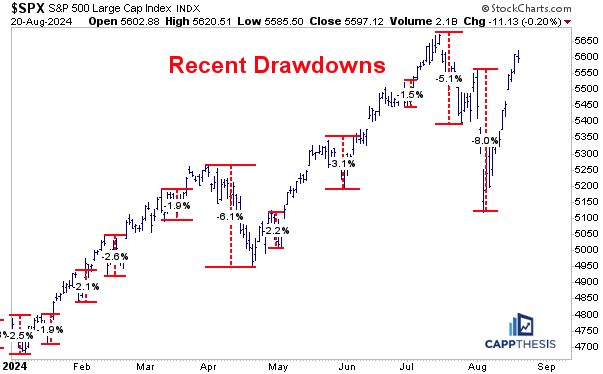
Should yesterday’s marginal 20 bps loss develop into something more severe, the Fibonacci retracements may come into play. The first level – the 38.2% retracement – is near 5,428. That would amount to a -3.5% drop from yesterday’s high. Should that happen, it could satisfy both sides – bears looking for a pullback and bulls waiting for the next higher low to materialize.
Indicators
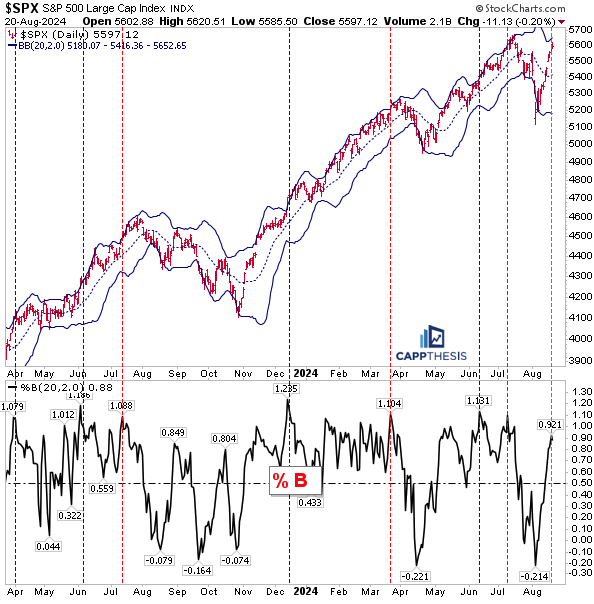
Believe it or not, the near 10% spike still hasn’t pulled the SPX back to its upper Bollinger Band. That’s because the preceding near 10% drop forced the bands to materially widen. That said, the index is very close to touching the top line again.
We like to show the %B indicator along with the bands, especially at potential extremes. In basic terms, the %B compares the SPX to the upper (and lower) band. When the number spikes or drops by a large amount, extreme readings result.
Noted are the recent times that the %B eclipsed 1.0, which suggests an extreme overbought state. The red lines depict when a downturn resulted soon thereafter. The blue lines show the times when the SPX continued to advance. How the SPX reacts if/when the %B gets overly extended again now will be telling.
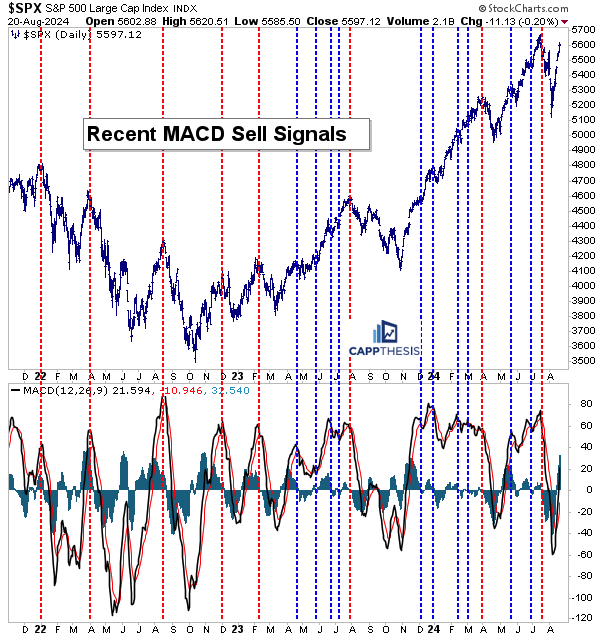
Ditto for the MACD. As we’ve discussed before – in the strongest trends, MACD sell signals have a tendency NOT to work. See all of the blue lines that have happened since the spring of 2023. Overall, we’ve had 13 MACD sell signals, and 10 haven’t worked.
That said, we can’t ignore the MACD since the three times that the sell signals did work, it literally nailed the three key trading tops (August’23, April’24 and July’24). We still have a while to go before another MACD sell signal hits, but it’s good to keep this one on our radar screens.
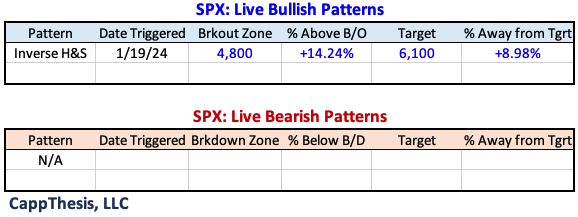
Live Patterns
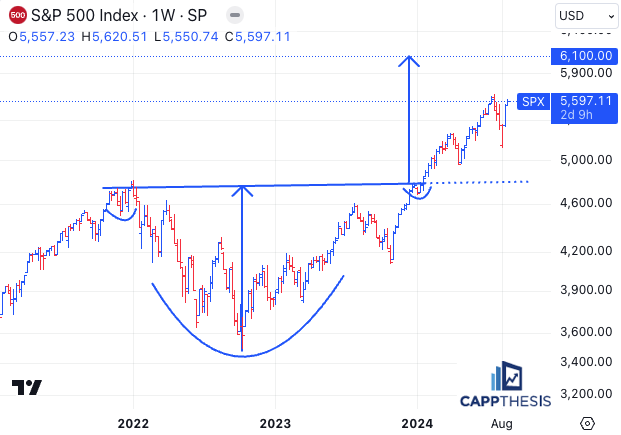
Potential Patterns
We continue to wait for the next formation to take shape.
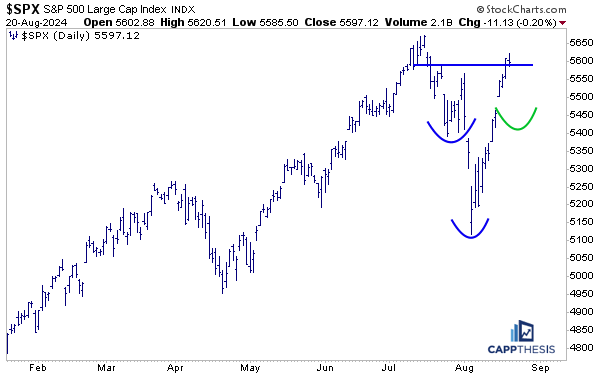
SPY AVWAP
SPY remains above every VWAP line for the first time in a month.
SPY
Red: 6/12/24 – CPI/FOMC
Black: 7/16/24 – July’24 high
Green: 5/31/24 – Pivot low
Blue: 5/23/24 – Pivot high
Black: 4/19/24 low
Light Blue: 8/5/24 – Pivot low
Yellow: 1/2/24 – YTD VWAP
Pink: 10/27/23 – October’23 low
Light Green 3/13/23 – March Low
Purple: 1/4/22 – 2022 high
Green: 10/13/22 – 2022 low
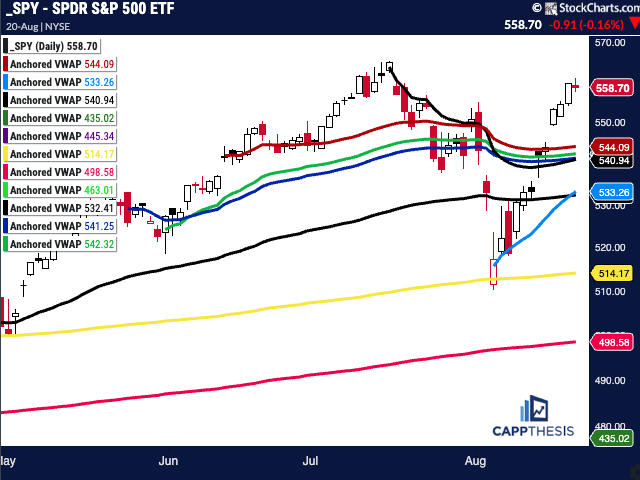
Daily Price Action
There hasn’t been a new 52-week low within the S&P 500 since 8/14.
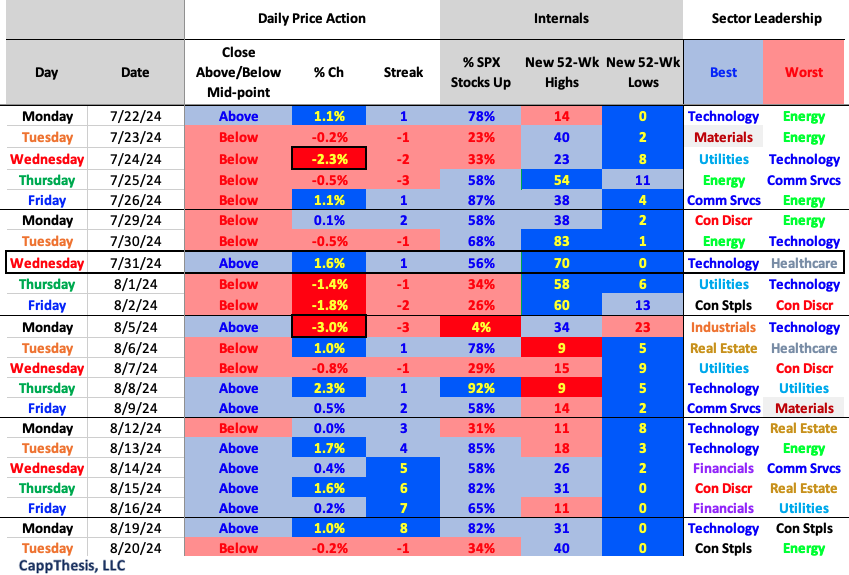
Breadth
Small caps lagged.

Sector ETFs
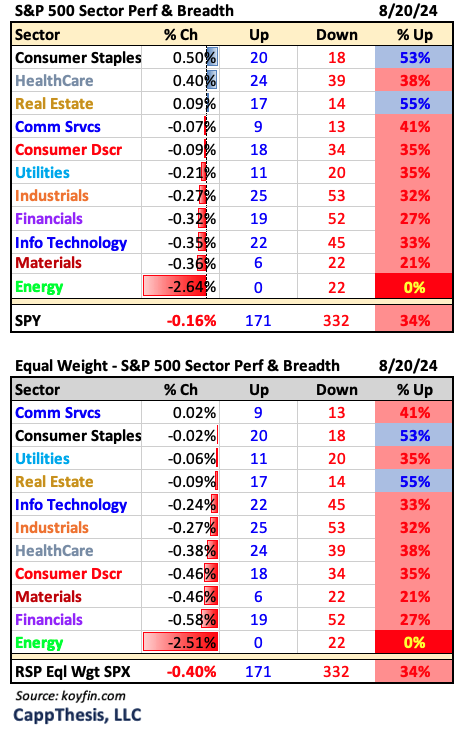
Just Consumer Staples and Real Estate managed positive internals yesterday.
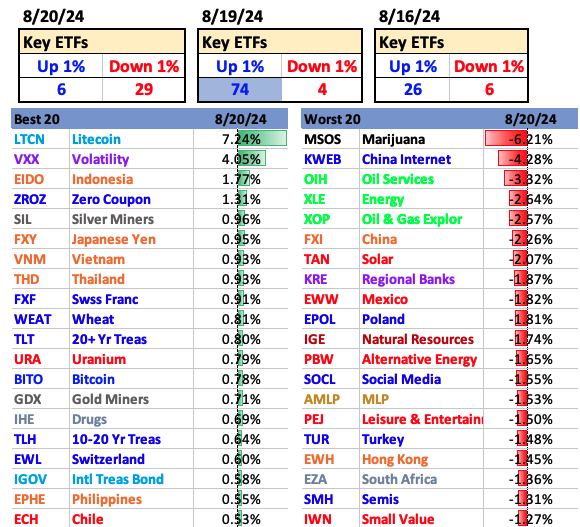
Best and Worst 20 ETFs
Energy names got hit the hardest on Tuesday.
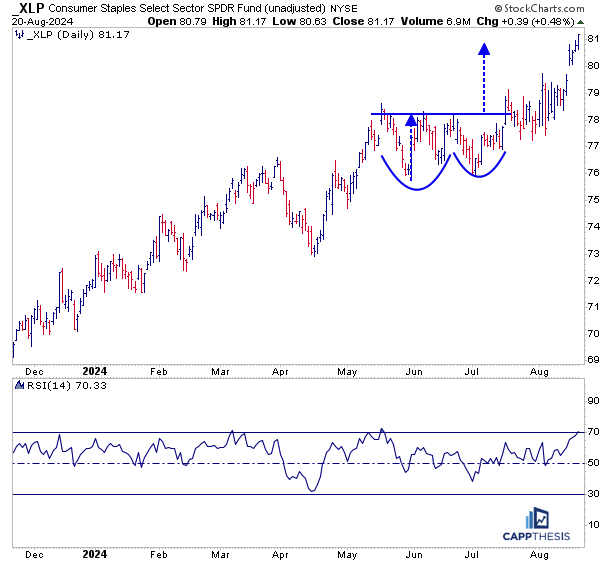
XLP Consumer Staples
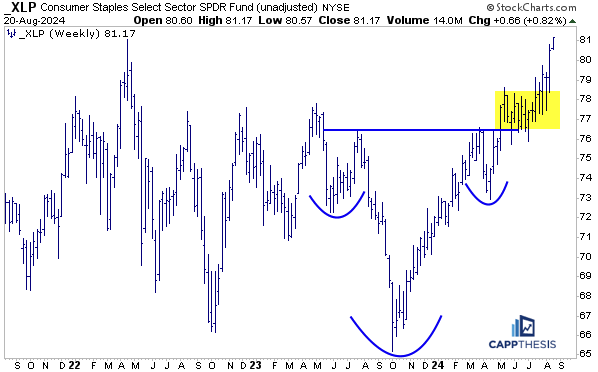
XLP led the sectors yesterday and now is up six straight days and 10 of the last 11. Along the way, it hit its upside target from this cup and handle pattern.
Thus, while we can’t expect the recent pace to persist, it’s now built up a cushion to back and fill above the larger weekly breakout.
SMH Semis
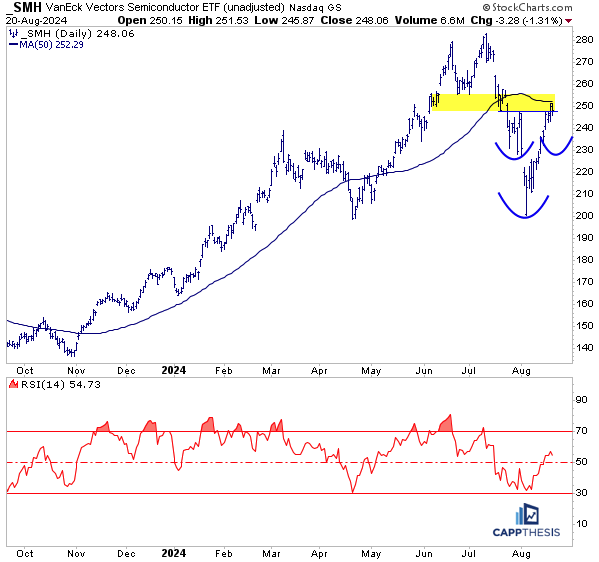
SMH lost over 1.3% yesterday, pausing at a likely spot – near its flat 50-day moving average, which lines up with its breakdown zone from July. Next step… log a higher low.
XLE Energy
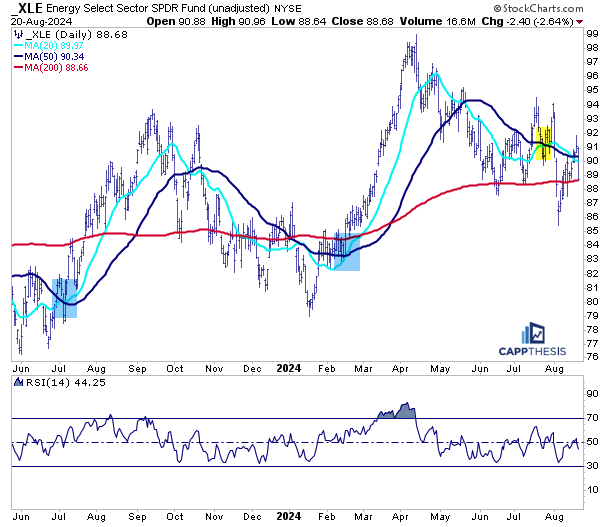
XLE lost over 2.6% yesterday, which was its third 2% decline of August. XLE continues to be faded with every rally attempt. We’ve seen this before over the last two years; thus, it makes sense to be patient.
One thing needs to happen – the 20-day moving average needs to eclipse the 50-day moving average… and then stay above it. Highlighted are the last two times that this happened since last summer. Strong moves resulted for the next few months.
