Key Points:
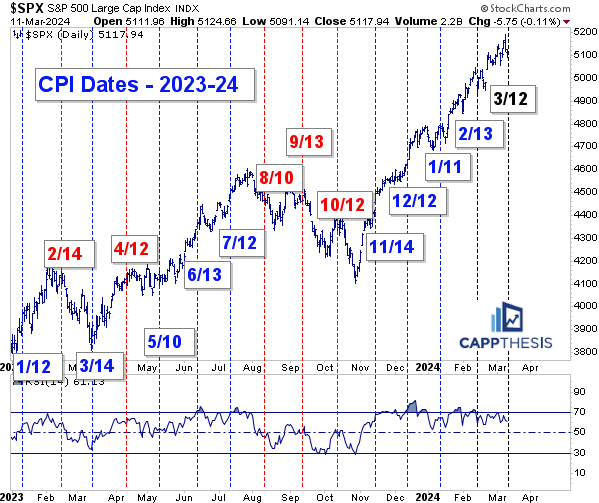
1- The SPX has been higher two weeks after the CPI report for four straight months before today’s report.
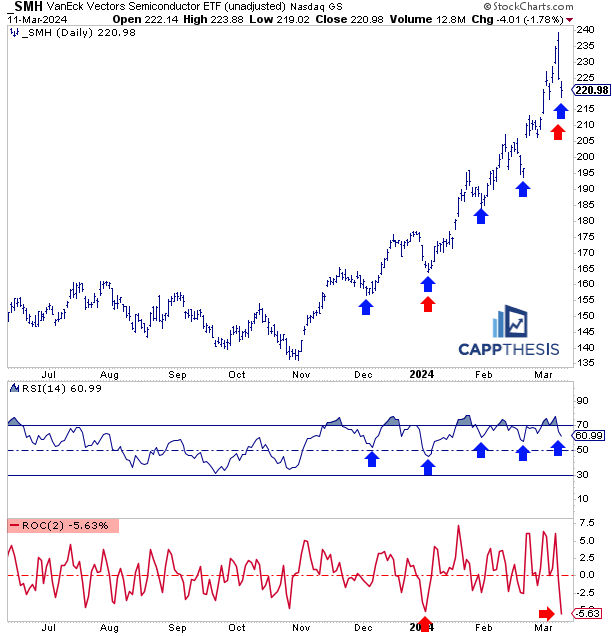
2– SMH Semis dropped 1.8% on Monday, which took its two-day decline to -5.6%, its first two-day -5% move since 1/2 – 1/3/24. Before that, it last had a -5% two-day decline in December’22.
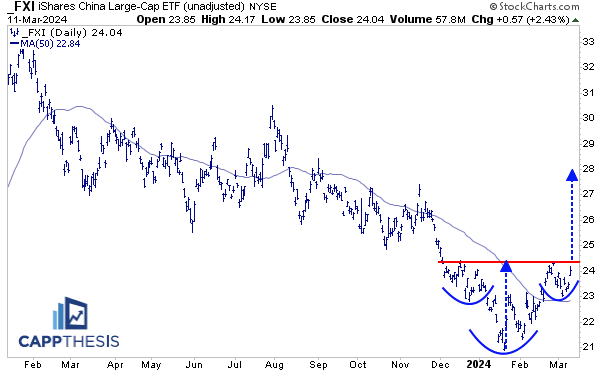
3– FXI China now is close to completing a four-month inverse H&S pattern. A breakout would target the 28 level.
Topics Covered:
Market
-SPX & CPI
-Patterns
-AVWAP
Stats
-Daily price action
-Index breadth
-Sector performance
-Best & worst ETFs
Key Charts
-SMH Semis
-XBI Biotech
-XLC Comm Services
-FXI China
-GDX Gold Miners
SPX:
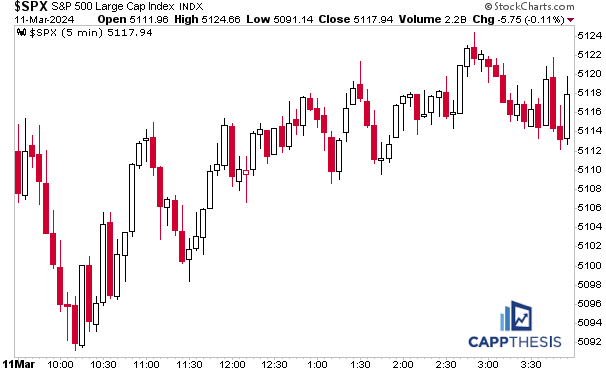
The SPX dipped marginally on Monday in front of the inflation data, but it finished near its intra-day highs, rallying for most of the day.
SPX & CPI
The SPX now will be trying to extend its streak of performing well in the two weeks after a CPI report. As the chart below shows, the index has done this four straight times from November’23 through February’24, which is quite a run.
Of course, we could use just about any data point since late October and point to the index being higher two weeks later. But we know that CPI is the axe. In fact, it was the SPX’s reaction (+1.9%) to the CPI report on 11/14/23 that really put this rally into overdrive mode.
Indeed, that was the market’s FIFTH 1% gain in 12 trading days, and the Zweig Breadth Thrust already was in play. But the tape transformed from an emotional snap back within a downtrend to a more consistent uptrend after that. There have been nine 1% gains and four 1% losses over the last 78 trading sessions since 11/14.
Along the way, the SPX has started CPI Day at a higher price than the last CPI Day. That’s pretty obvious, with the question being when the run will cease. A bad reaction over the next two weeks could give us a big clue.
This is important – note that we’re not talking about a bad piece of data – we’re more concerned about a bad reaction to the data. The market has been responding well to any news – good or bad – over the last five months. At some point, the opposite will start to occur, with the SPX reacting poorly to news. This is what happens in downtrends.
While we know that’s coming at some point, trying to detect the exact day and news item of when that change will happen is useless.
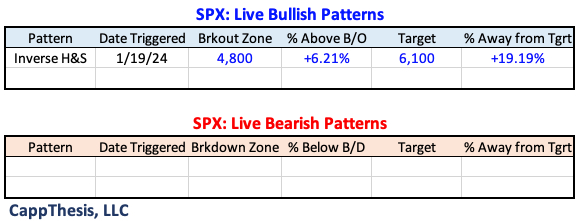
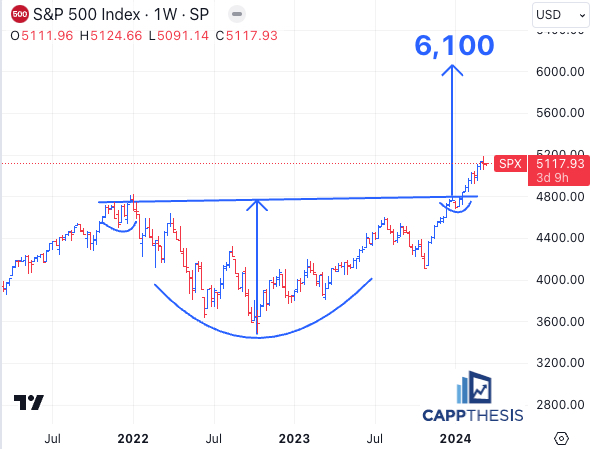
Patterns
It’s now a waiting game for the next short-term pattern to develop. The big breakout remains in play, with a target up near 6,100.
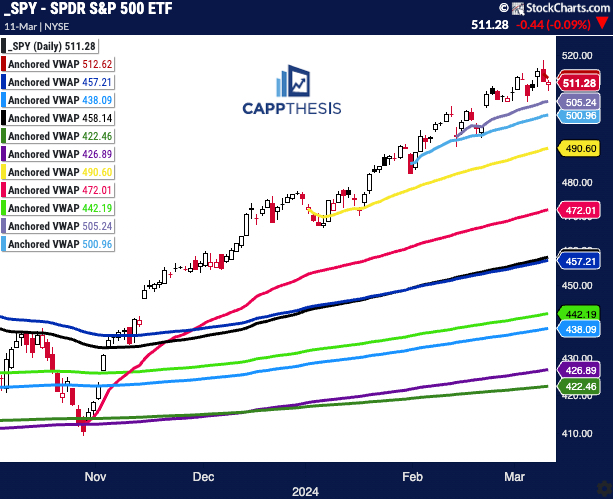
SPY AVWAP
SPY remains below the VWAP line anchored to the 3/8/24 high.
Red: 3/8/24 – Recent high/neg reversal
SPY
Light Purple: 2/13/24 – CPI
Light Blue: 1/31/24 – FOMC
Yellow: 1/2/24 – YTD VWAP
Pink: 10/27/23 – October’23 low
Blue: 6/15/23 – FOMC negative reversal
Black: 8/18/23 – August low
Light Green 3/13/23 – March Low
Light Blue: 2/3/23 – Former high point
Purple: 1/4/22 – 2022 high
Green: 10/13/22 – 2022 low
Daily Price Action
The SPX now has had positive adv-dec numbers in 12/14 trading days since 2/27.
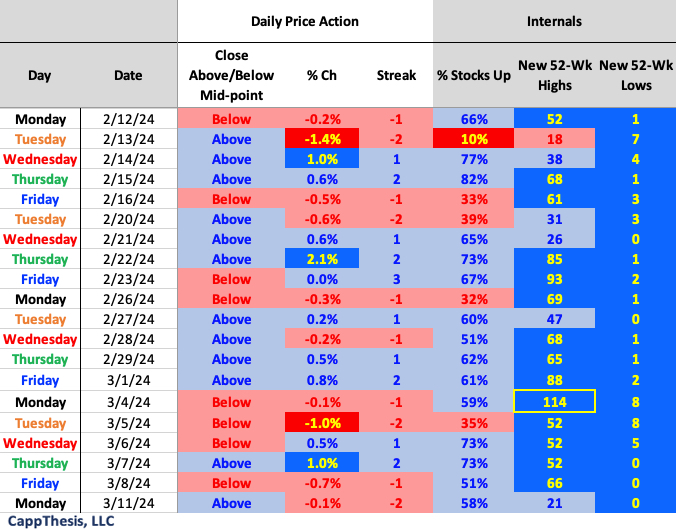
Breadth
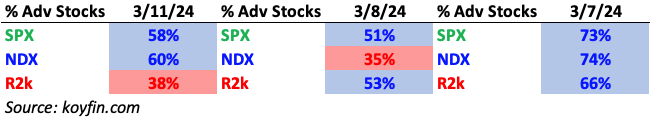
Small Caps lagged on Monday from a market internals perspective.
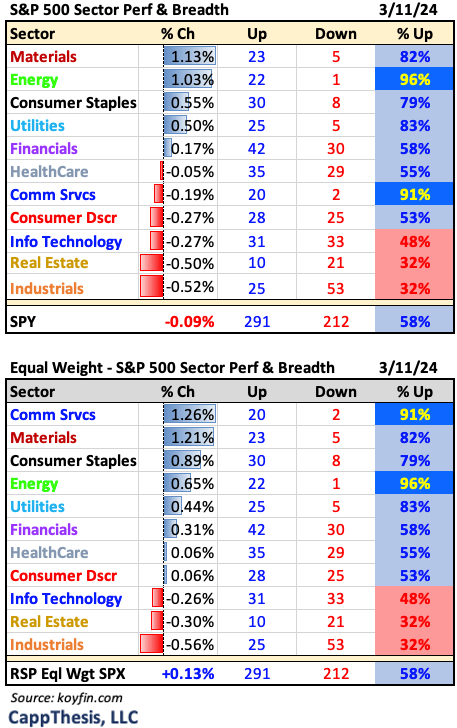
Sector ETFs
Materials and Energy were the standouts on Monday, with both up 1%, however, the equal weight Comm Services ETF (RSPC) shot higher by 1.3%.
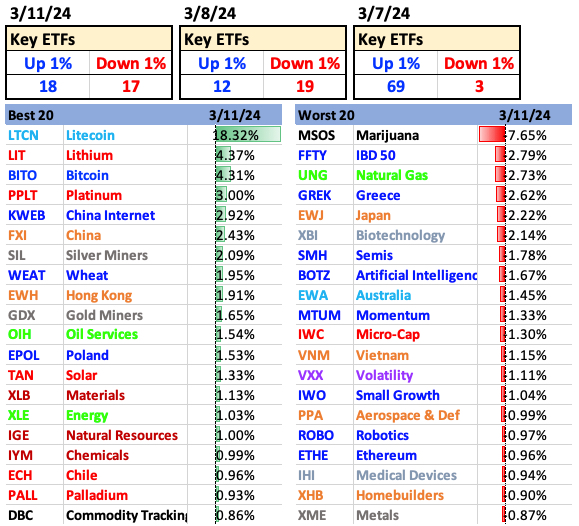
Best and Worst 20 ETFs
Crypto and non-growth areas were the best performers on our ETF list.
SMH Semis
SMH dropped 1.8% on Monday, which took its two-day decline to -5.6%, its first two-day -5% move since 1/2 – 1/3/24. Before that, it last had a -5% two-day decline in December’22 – and many times in 2022 overall, not surprisingly.
So… this means one of two things: this is a buyable dip or the start of a much bigger corrective phase. Thus far, the uptrend hasn’t been affected, and the RSI is near 60, which has supported dip buying the last two times. Seeing a lower high develop from here would be a notable change of character.
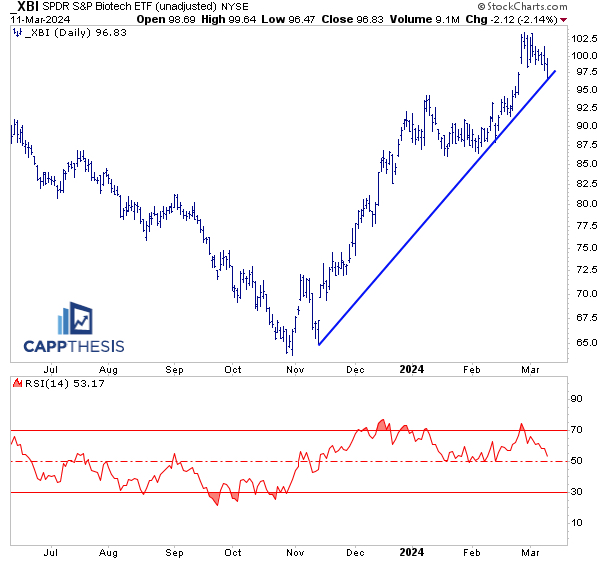
XBI Biotech
XBI endured its worst decline in a month yesterday and settled directly on its uptrend line from mid-November. Its RSI has fallen back to 53 now. Given that the indicator hasn’t been below 50 since mid-November, it will be instructive to watch from here.
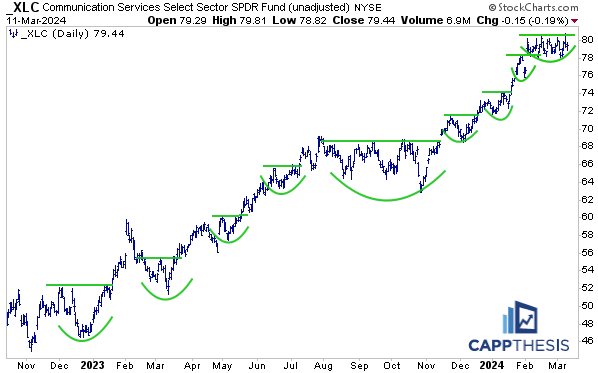
XLC Comm Services
Despite META getting hit hard, XLC only was down marginally yesterday. And as detailed above, 20/22 of its components advanced on the day.
Overall, the ETF has flat lined since the 2/2 spike, which has set up this potential bullish pattern. If it seems like we refer to bullish formations a lot in XLC, that’s because we do… and the chart since 2022 shows how well the ETF has leveraged the eight prior patterns. Trends trend…
FXI China
We’ve been profiling FXI from a longer-term perspective, showing its mean-reverting potential. That has worked well, with the ETF now noticeably off its lows. From a daily point of view, FXI now is close to completing a four-month inverse H&S pattern. A breakout would target the 28 level.
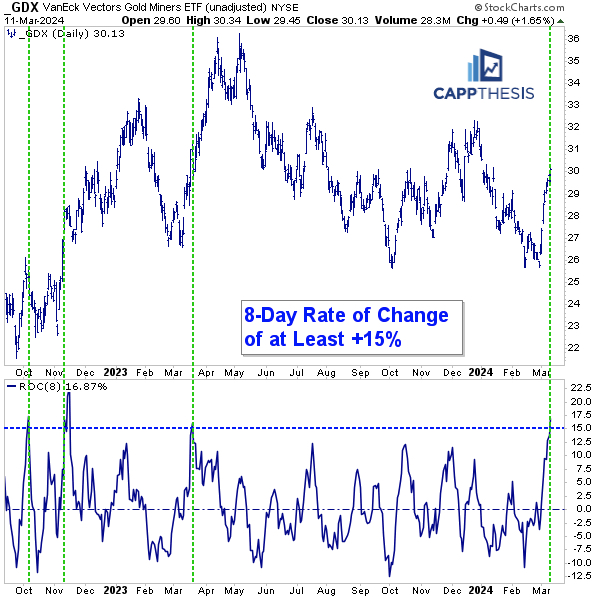
GDX Gold Miners
GDX advanced for the eighth straight day yesterday, over which time it is +16.8% (using closing prices). This is now just the fourth 8-day move of at least 15% since the COVID 2020 spike from the lows. Here are the other three – after pausing, GDX continued to advance each prior time. With GLD making new highs now, GDX continues to play catch up.