Key Points
The S&P 500 extended its winning streak to three, albeit just marginally advancing on Thursday. But today, we’ll be focusing on a different streak: we haven’t had a +/-1% move since the 1.5% advance on November 24, which we’ll be dissecting today… along with a host of key ETFs and a trade idea in the healthcare space.
Last 5 Trading Days
Daily Price Action
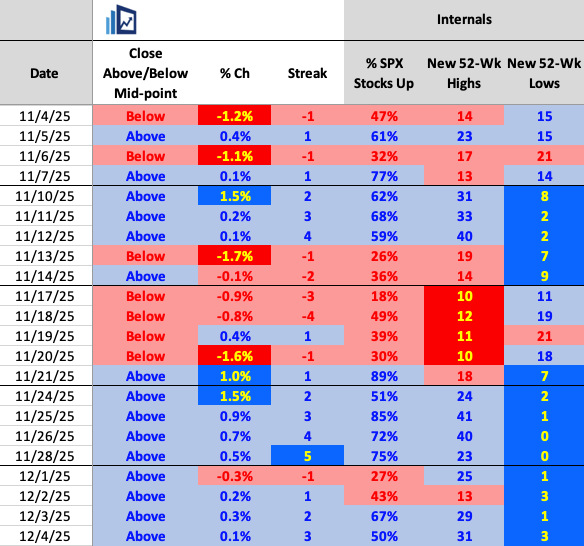
The S&P 500’s long streak of closing above its pivot zone extended to nine sessions in a row, underscoring once again how persistent the underlying bid has been over the past two weeks. Breadth was marginally positive, with another sector taking the lead in yesterday’s session.
Sectors
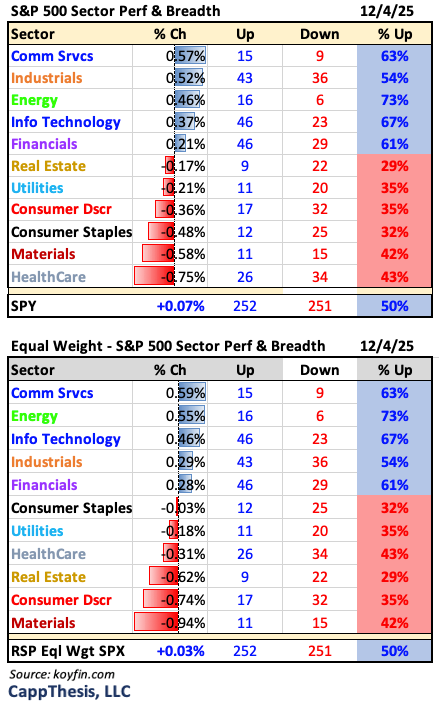
Communication Services was the leading sector yesterday for the first time since September 15. For perspective, over that same period, Technology has led on 15 different days, and Energy has led 14 times. Overall, five S&P 500 sectors posted positive breadth yesterday.
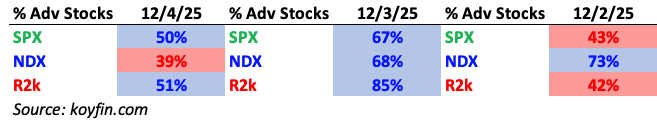
Index Breadth
Internals were negative for the NDX, with only about 40% of stocks advancing. In contrast, the S&P 500 and Russell 2000 were essentially flat, with just slightly more advancers than decliners.
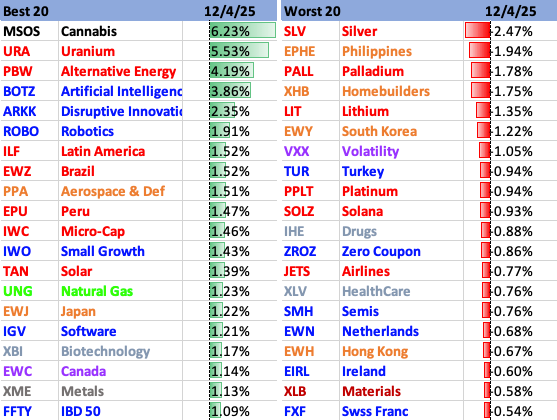
Best & Worst 20 ETFs
Yesterday we saw strong gains from alternative energy, AI-related ETFs, ARKK, and Latin America. On the downside, precious metals pulled back, along with homebuilders and bonds.
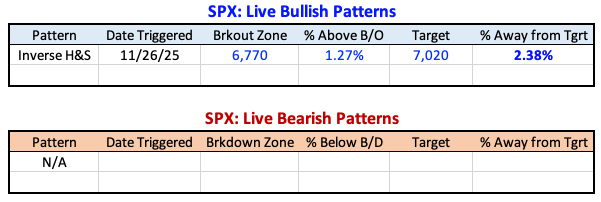
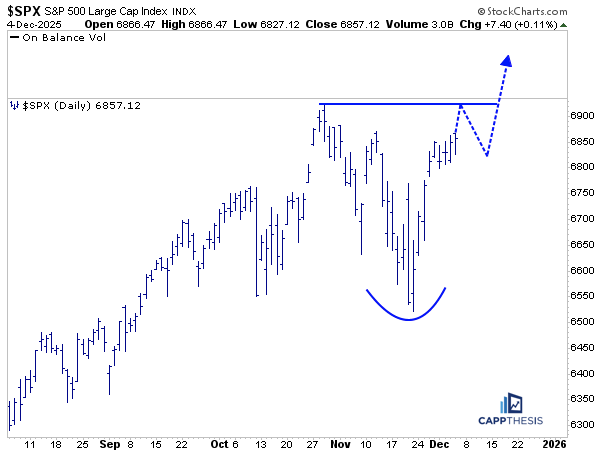
With the continued advance, the S&P’s most recent bullish pattern breakout remains in play, with a target of 7,020.
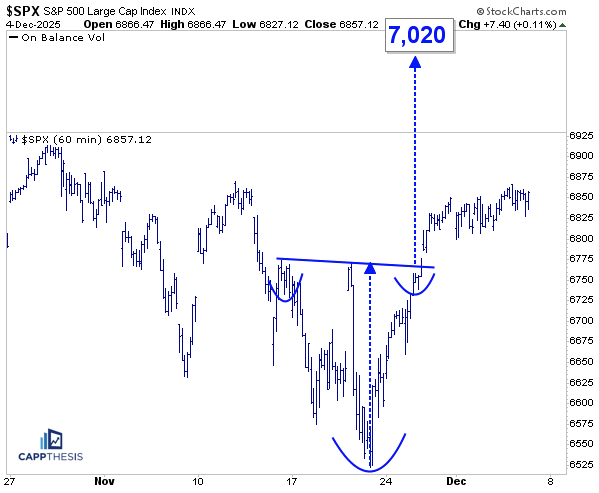
Potential Patterns
The potential bullish pattern continues to develop, with the S&P 500 now moving very close to its most recent mid-November peak (6,870). This also represents the next short-term resistance zone to clear. A breakout above that level would open the path toward the more meaningful resistance: the late-October and former high (6,920), which now is in the crosshairs…
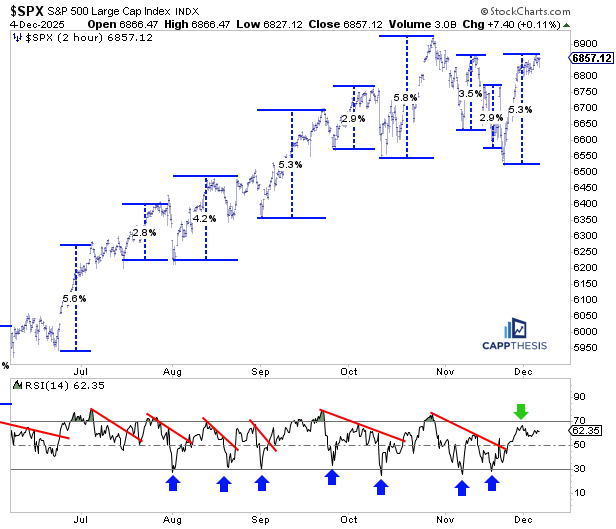
Short-Term
Here’s an update of the short-term chart. The tactical rally now stands at +5.3%, and even though that makes it one of the strongest advances since July, it still hasn’t pushed the 14-period RSI on the 2-hour chart into overbought territory. It came very close, but not quite.
Needless to say, any further extension from here would likely drive the RSI above the 70-threshold, which would most likely coincide with the S&P 500 making new all-time highs. As of last night’s close, the index is now only about 1% below the 6,920 high from October 27…
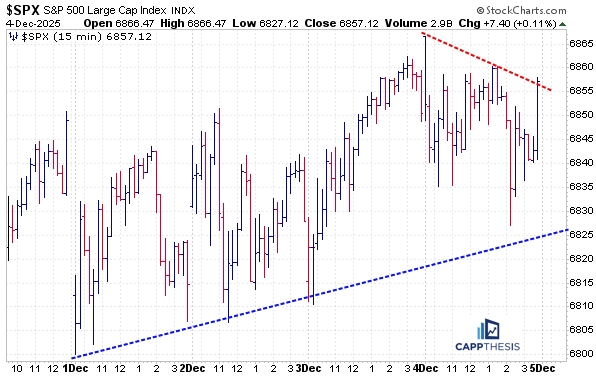
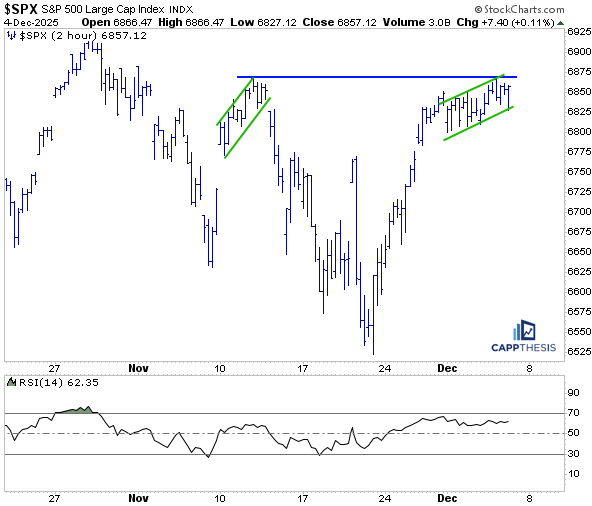
And if we zoom in on the same short-term chart, we can see why things have slowed from a momentum perspective. The very strong advance that began on the morning of Friday, November 21 has given way to a much slower pace over the past few days—especially as December has begun. The last few trading sessions can easily be seen as an upward-sloping trading channel.
One potential concern is that this is resembling what happened in mid-November, when a very similar ascending trading channel stalled right at the same level the S&P is testing again now.
There are differences, however.
This current advance has lasted longer, and so far, it has shown a lower degree of volatility on the way up—fewer outsized moves compared to November…
Long Streaks without a +/-1% Move
This rally, of course, began right after the last big 1.6% decline on 11/20/25. That was followed by a cluster of very strong trading sessions on Friday the 21st and then again on Monday the 24th. At the time, we were discussing what needed to happen for this effort to be stronger and more durable than the prior ones.
When you get multiple strong up days like that following a sharp decline, it helps clear out shorts and, ultimately, that could give way to a calmer, more trustworthy trading environment. And that’s exactly what has played out over the last week and a half. Since those two big gains, the S&P has now posted seven consecutive sessions without a 1% move.
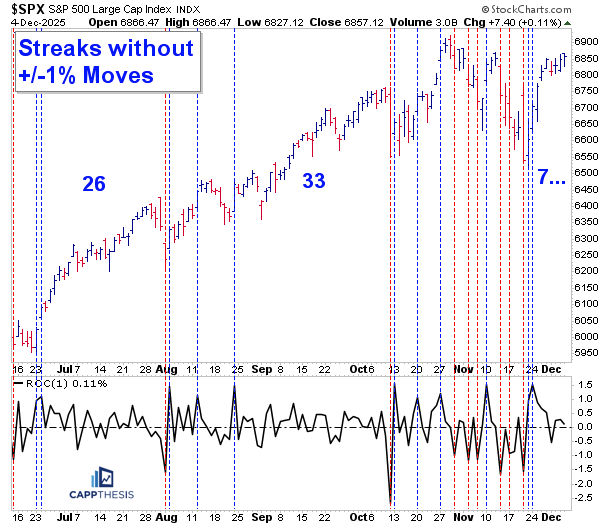
That may not sound extreme, but considering the period that preceded it—when we had twelve 1% moves in just six weeks—it’s a distinct shift in character. This is how we can return to the type of stable environment that is conducive to bullish pattern breakouts. We don’t necessarily need this streak to continue, but seeing fewer large swings is always the goal coming off a corrective period defined by sharp, acute moves.
For perspective, earlier this year—in the summer and again this past fall—the S&P went 26 days and 33 days, respectively, without a 1% move. Those stretches corresponded with strong market performance.
If this current stretch ends up replicating that behavior, the S&P could very well grind its way back to new highs, supported by this same pattern of steady, consistent advance.
Whether it takes us into year-end is uncertain, but it remains the best-case scenario and—importantly—one that has been a reliable blueprint over the past several months.
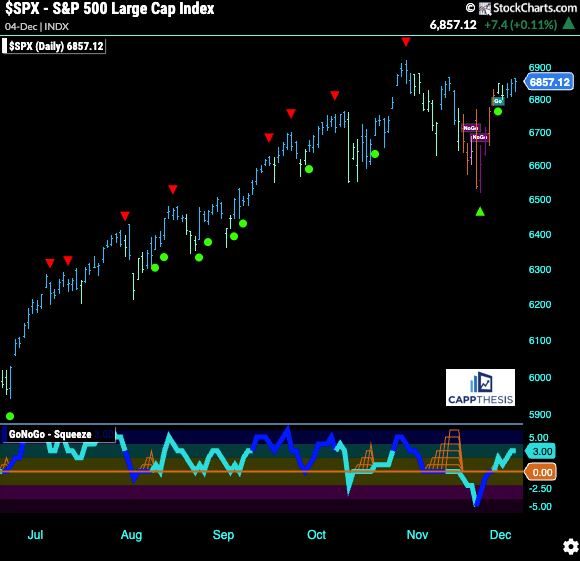
GoNoGo Trend – Daily
The GoNoGo indicator remains in a Strong Trend (blue) mode after yesterday’s small gain. Again, this shift back to GO is occurring as the S&P 500 approaches its all-time highs and as bullish patterns begin to form.
We saw a very similar phenomenon in mid-May, when two major bullish patterns completed on the same day, coinciding with the GoNoGo indicator flipping back to “Go” mode. That combination proved powerful, with the market extending higher for months afterward.
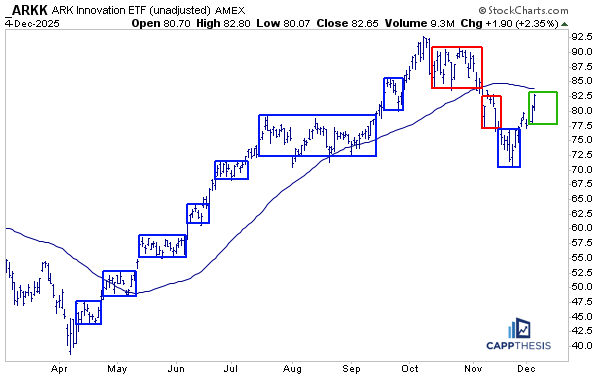
ARKK
The ARK ETF has come back very strongly, which is a constructive sign—especially after two straight trading-box breakdowns on the way down. Despite that weakness, it managed to hold its critical 40-support zone at the end of November.
This next phase is important because ARK still has not yet overtaken its 50-day moving average, which has flattened out over the past few weeks. On the way up, that moving average was reliable support in August and September, but it also highlights how persistent the underlying bid has been: ARK had barely touched the 50-day since reclaiming it back in early May.
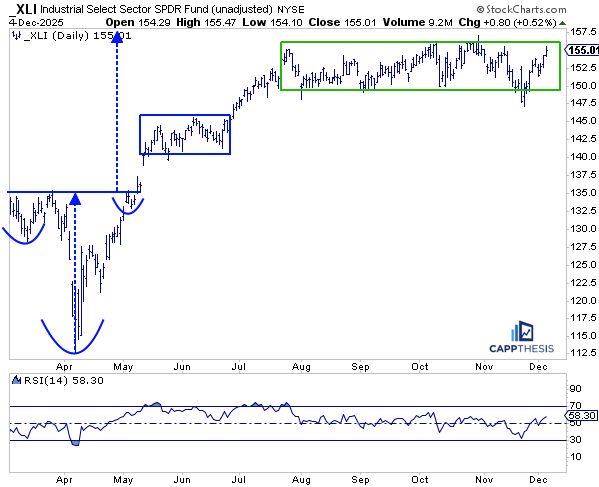
XLI Industrials
After the most recent advance, XLI (Industrials) is now back near its former high point. As we know, this has been a very long trading range for quite some time, and there was real potential in November for that breakdown to extend much lower, given the huge air pocket beneath it.
But instead of completely rolling over, many areas that looked like legitimate breakdowns turned out to be head fakes to the downside—a classic bear trap.
Now traders have the opportunity to prove this time is different by buying strength and turning this into a substantial breakout in XLI.
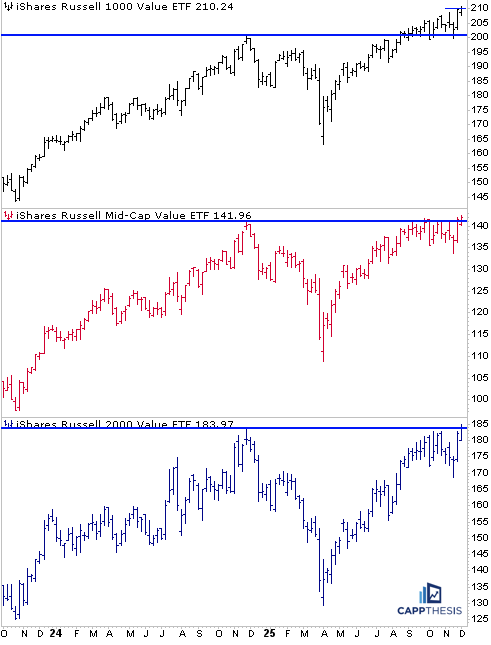
Russell Value ETFs
Yesterday, we spoke about IWN (Small-Cap Value) making a new all-time high. It did so again yesterday — but this time it had company. Both the Mid-Cap Value ETF (IWS) and the Large-Cap Value ETF (IWD) also posted new all-time highs, reinforcing the strength across the entire value complex…
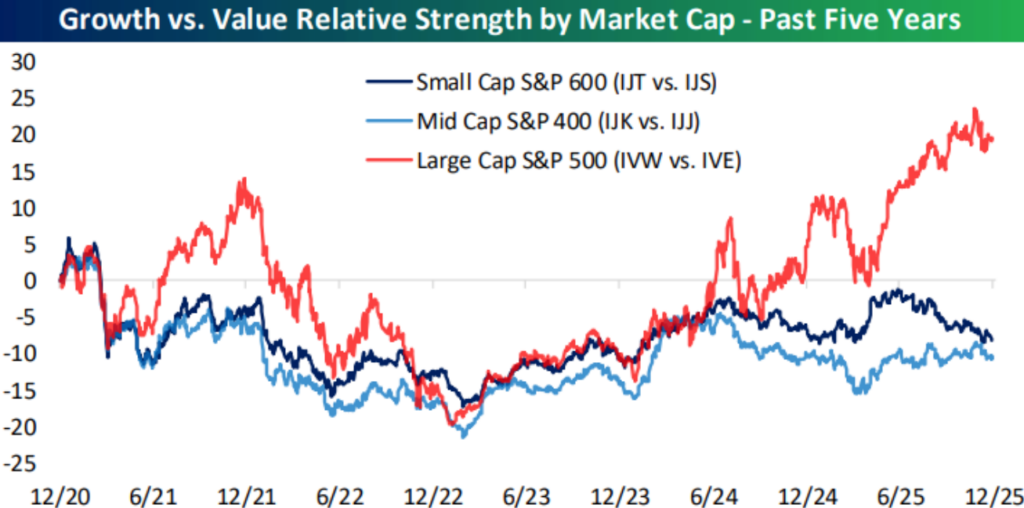
As Bespoke Investment Group notes here, we’re familiar with how large-cap growth has dramatically outperformed large-cap value over the past several years — clearly illustrated by the red line on their chart below. But importantly, that has not been the case as you move down the market-cap spectrum.
Both mid-caps and small-caps have actually outperformed their growth counterparts over the same timeframe. It’s a dynamic we shouldn’t ignore, and it’s an interesting one from a relative-strength perspective.
Just because large-cap growth is doing well in a highly speculative environment doesn’t mean that small-cap growth will automatically outperform small-cap value. We’re seeing that play out once again.
Of course, in strong uptrends, both growth and value can benefit — it’s just a matter of identifying where the leadership is coming from next.
ESPO Gaming & eSports
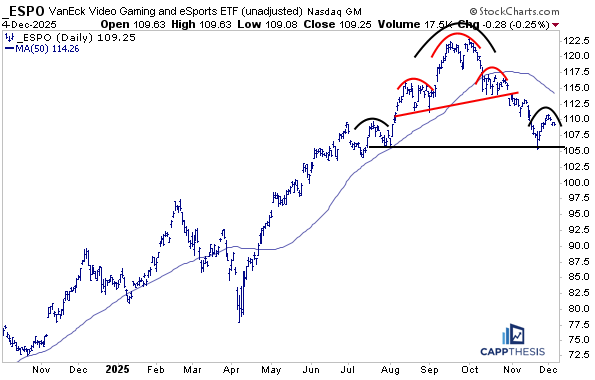
There are still a few areas trading well below their recent highs, and one of them is ESPO. While this ETF is extremely illiquid—as noted yesterday with only about 17k shares traded—it still provides a useful read on its underlying holdings and how they’re behaving.
ESPO recently formed a bear setup (highlighted in red), broke down, and came very close to hitting its downside target. It’s now attempting to rebound off the 105-support level. If it can hold there, it has the potential to bounce back toward the 50-day moving average.
However, a quick rollover from this level would confirm a larger bearish pattern on the broader chart. That would make ESPO one to keep on the radar.
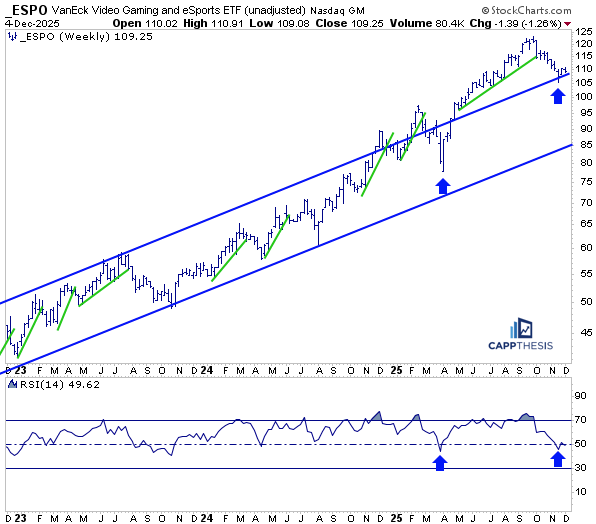
Zooming out to the weekly chart for ESPO, we can see it has had an extremely strong run up to this point. The recent pullback has brought its 14-week RSI slightly below 50 over the past few weeks. As the blue arrow shows, the last time this happened was in April, and it led to a significant upside reversal.
From a purely technical perspective, this looks like a potential buying opportunity, especially if the larger bearish pattern can be averted.
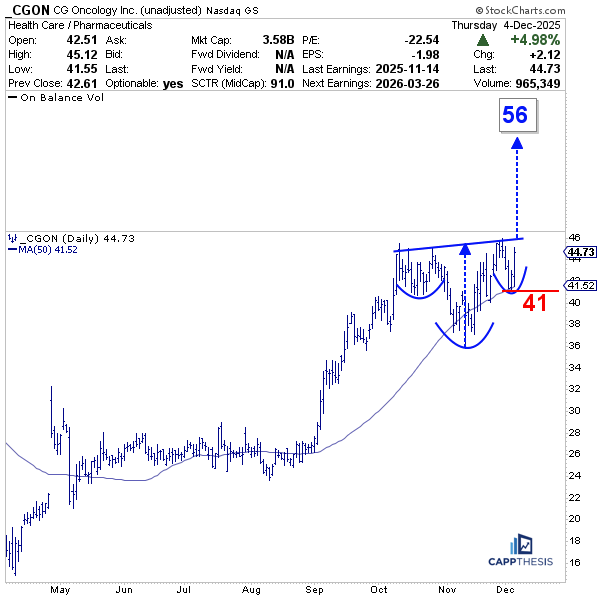
CGON CG Oncology
Healthcare has been coming back lately, and many stocks have benefited. One we specifically care about is CGON (CG Oncology), which was up almost 5% yesterday.
When a stock moves that much in a single session, it can be tricky from a timing perspective — but I wanted to highlight this not because of yesterday’s move, but because of the chart pattern it has been forming since topping in mid-October.
As is clear on the chart, CGON has been tracing out a potential bullish inverse head-and-shoulders pattern with a slightly upward-sloping neckline. That means it may take more effort for price to push back above that zone, and it may not happen immediately. But if it does, there is a clear upside target near 56.
If Healthcare as a whole is going to reclaim a sustained bid after an overdue pullback the last few days, then CGON could be one of the beneficiaries. Its 50-day moving average sits near 41, which also corresponds to the low of the proposed right shoulder.
From a short-term tactical perspective, that 41 area would be the logical suggested stop-loss, given its alignment with the pattern structure.