Key Points:
1- While the SPX officially logged its first two-day decline since the October lows yesterday, the index also finished above its mid-range for the fourth straight session.
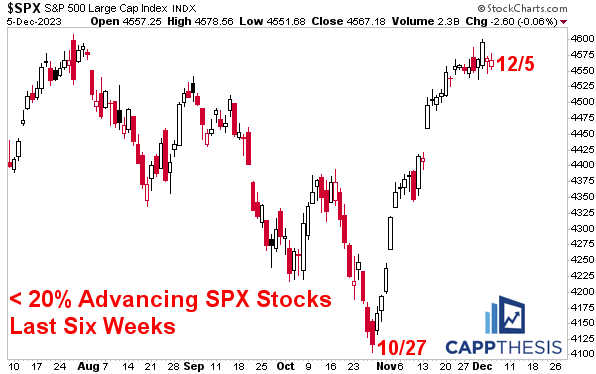
2- With just 18% advancing stocks on Tuesday, it was the worst breadth for the SPX since 10/27 – the low before the rally began. That’s not full the story. See more below.
3- It’s now been 14 trading days since the last 1% gain and 27 sessions since the last 1% decline.
Topics Covered:
Market
-Closes above the mid-point
-Breadth – Daily & Weekly
-Pattern update
-AVWAP
Stats
-Daily Price Action
-Index Breadth
-Sector Perf & Breadth
-Best & Worst ETFs
Key Charts
-Bitcoin
-Bitcoin vs. SPX
-Crude Oil
-INDA
SPX:
Officially, the SPX’s 6-basis point loss on Tuesday made it two straight declines, which now is the first losing streak since three-straight from 10/25 – 10/27. But with both down-moves so small, this has done little damage.
A Key Streak
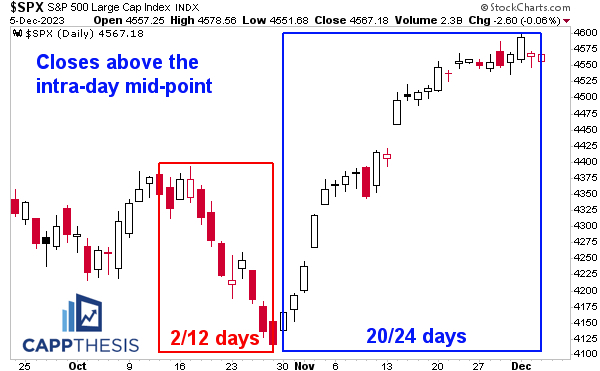
Another streak was extended yesterday that you won’t hear about in the headlines: the index closed above its mid-range for the fourth straight session.
It’s now done this in 11/13 days and, incredibly, in 20 of the last 24 trading sessions, as well.
This has been just as telling (possibly more so) as the index’s daily performance over the last six weeks. Buyers have continued to use any dip – no matter how small – as an opportunity to buy more.
And while that hasn’t resulted in sizable one-day gains in nearly a month, it’s kept the underlying bid intact. It’s also allowed the, now, three bullish formations to stay in play, as well (see more below).
A Bad Day for Breadth
That said, with just 18% advancing stocks on Tuesday, it was the worst breadth for the SPX since 10/27 – the low before the rally began.
That day of course, was the tail-end of the third -6%, multi-week sell-off and the end of the corrective price action. And at the time, the index was sporting two bearish patterns, was oversold and the CNN Business Fear & Greed Index had just hit Extreme Fear – where it stayed for just one day…
In other words, things were washed out to the downside.
With the pendulum having completely swung in the opposite direction now, the question is whether a bad day of internals again now – six weeks later – will lead to a greater pullback.
As the saying goes, one day doesn’t make a trend, but it could start one. It’s all about the follow through. We remember that on 10/30, the SPX was up 1.2%. That didn’t excite too many traders given how the last few months had gone.
But within 12 days, we had FIVE 1% gains and a Zweig Breadth Thrust (among other things), which completely flipped the market’s complexion.
While we don’t need to see that kind of action in the opposite direction for the trend to reverse lower, we DO need to see more than a single day of bad internals to push things markedly lower.
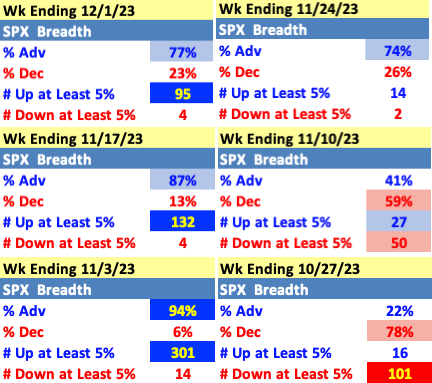
Strong Weekly Breadth
As we profile every week in the PostScript report, the steady market internals on a daily level have resulted in positive weekly readings for three straight weeks and in four of the last five.
It’s important to recognize that the huge week from 10/30-11/3 kickstarted a persistent bid even though those huge numbers haven’t been matched since then. Again, we don’t need those kinds of giant moves now: We just need consistency, which has been the theme lately.
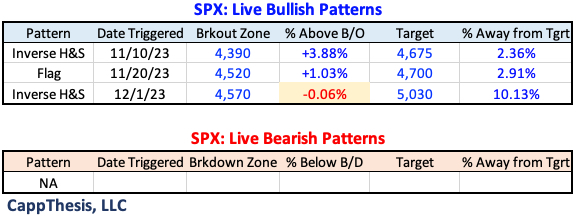
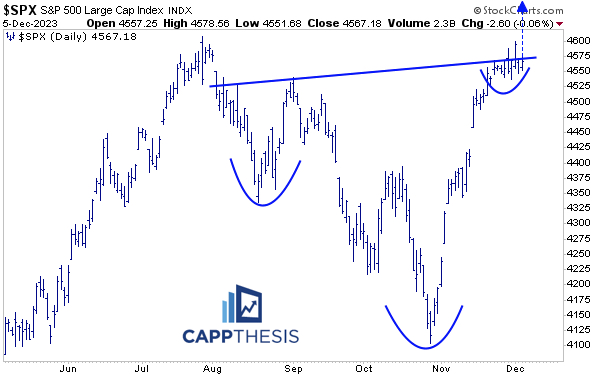
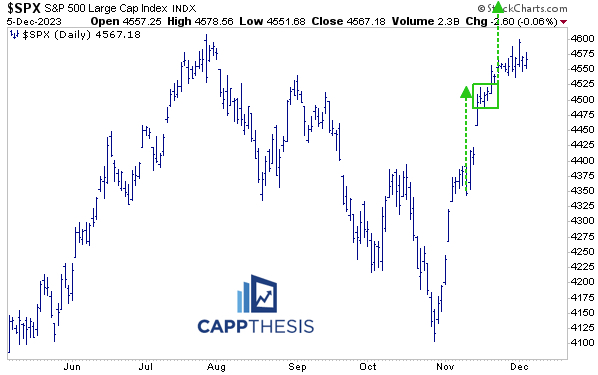
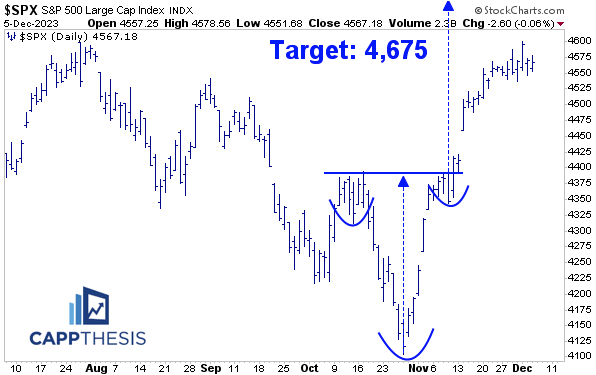
Patterns
Yesterday’s non-movement kept the SPX close to the breakout zone of the big bullish pattern. The other two bullish formations remain in play, as well.
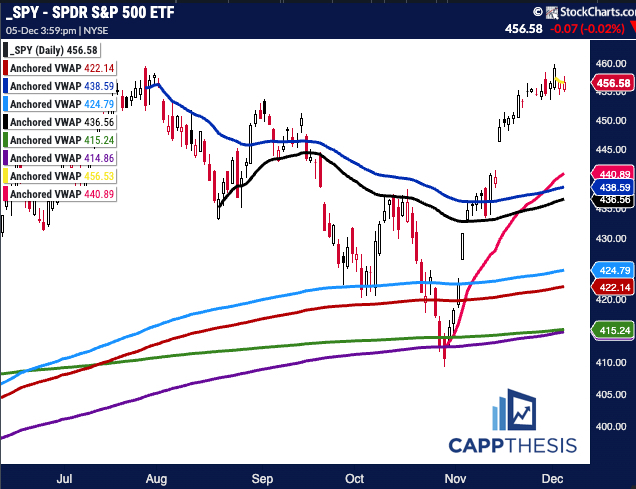
SPY AVWAP
The most recent AVWAP still is anchored to the 12/1 high – in yellow.
Purple: 1/4/22 – 2022 high
Green: 10/13/22 – 2022 low
Red: 1/2/23 – YTD VWAP
Light Blue: 2/3 – Former high point
Yellow: 9/20 – FOMC Meeting
Pink: 10/27 – October low
Black: 8/18 – August low
Blue: 6/15 – FOMC negative reversal
Yellow: 12/1 – Most recent high
Daily Price Action
It’s now been 14 trading days since the last 1% gain and 27 sessions since the last 1% decline.
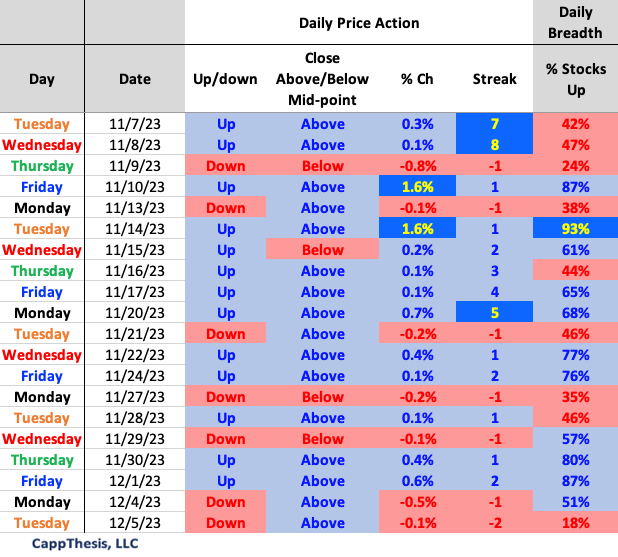
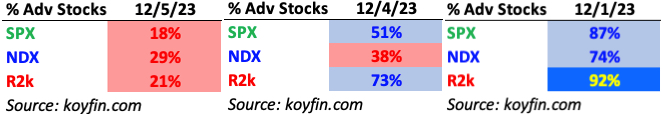
Breadth
As noted above, at just 18% advancing stocks, it was the worst breadth for the SPX since 10/27 – the low before the rally began. The NDX outperformed yesterday, but it still had more than 70% of its components decline.
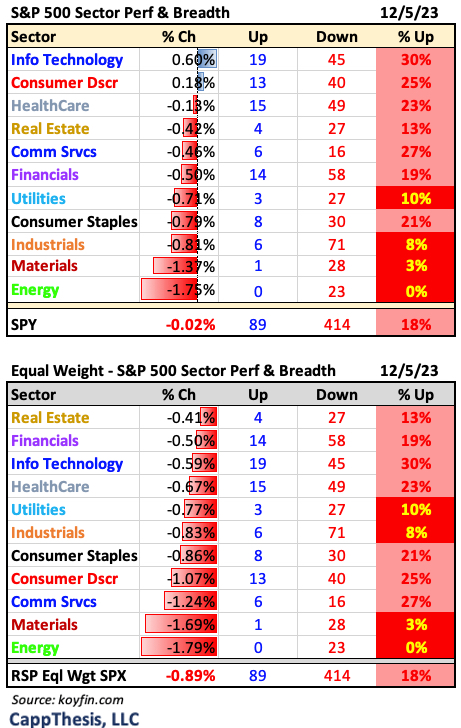
Sector ETFs
With Technology’s relative strength, the SPX did noticeably better than RSP for the first time in three days.
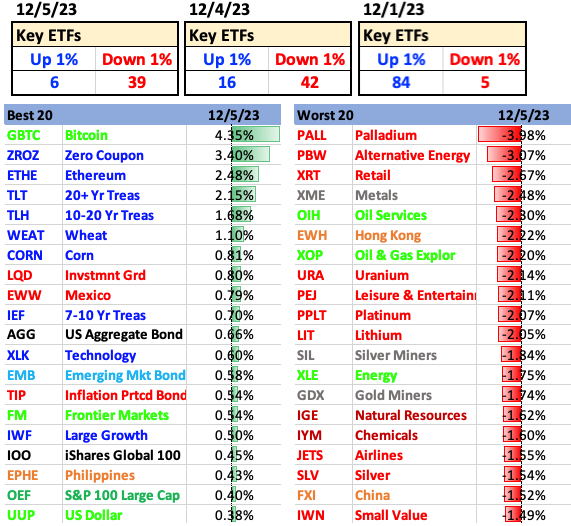
Best and Worst 20 ETFs
Big down moves outpaced big up moves for the second straight day to start the week.
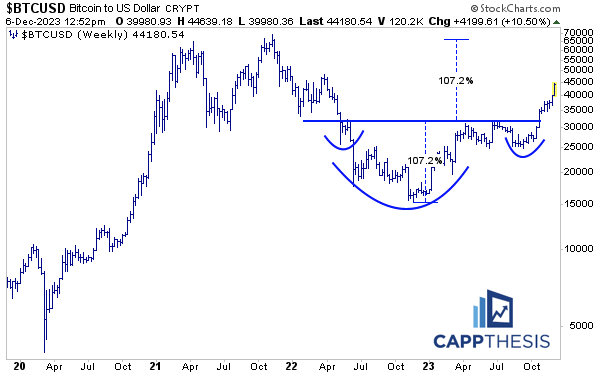
Bitcoin
With Bitcoin’s gain accelerating and three prior upside targets having been achieved, this is the last live bullish pattern. Its upside objective is the zone near its former highs.
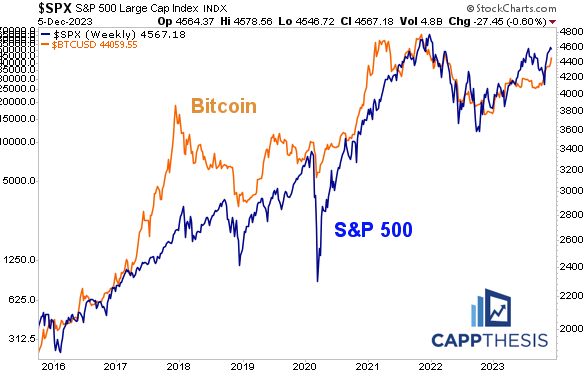
Bitcoin & SPX
Bitcoin started this move with the first whiff of dollar weakness in mid-October – a full week before the SPX bottomed.
As stated then, over the years, the SPX and Bitcoin rarely have moved in opposite directions for long periods of time. Thus, even if one doesn’t trade (or care about) Bitcoin, watching its behavior has been quite instructive for years. That’s true again now.
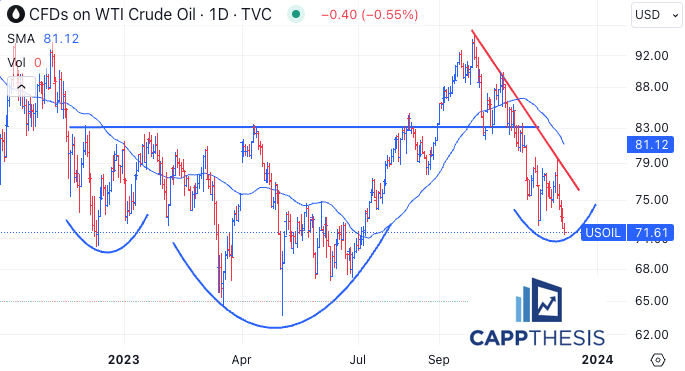
Crude Oil
With Crude Oil down five straight days and still below the downtrend line, the potential right shoulder of the big base is at a critical point. If a bid doesn’t return soon, the sizable foundation would be under pressure.
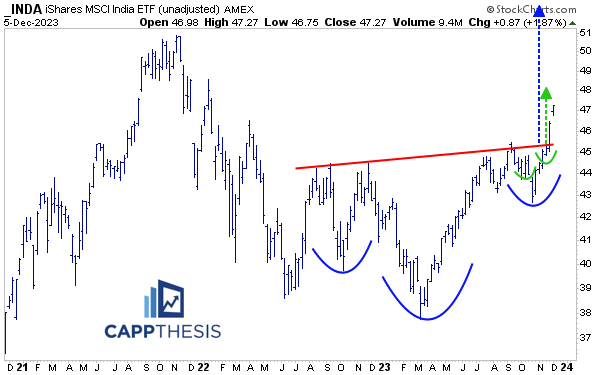
INDA
The INDA ETF logged its sixth straight advance yesterday, made a new 52-week high and now has an RSI of 82. That makes it very stretched in the short-term… but on the weekly chart, it continues to be in breakout mode from when we first profiled it on 11/21 (Opening Look: Round Trip).